Several metals and many alloys are in liquid form around room temperature, e.g., mercury (Hg, −38.8 °C), francium (Fr, 8.0 °C), cesium (Sc, 28.5 °C), gallium (Ga, 29.8 °C), the eutectic mercury-based alloys, and the eutectic gallium-based alloys. If eutectic, liquid metal alloys can be in liquid form that has been used in practical applications, replacing mercury. Liquid metals have high thermal and electric conductivity and have been used to conduct heat and electricity between non-metallic and metallic surfaces. They have also been used as thermal interface materials between coolers and processors. Concerning these metals, our understanding of the liquid-vapor interface is critical for proper applications. This entry summarizes the basic features of the density distribution of liquid metal-vapor interface, which are advanced based on pseudo-potential representation and numerical simulation at the University of Chicago.
- Liquid metal and alloys
- liquid metal-vapor interface
- pair correlation function
- liquid gallium
- longitudinal density distribution
- pseudo-potential representation
- local density approximation
- inhomogeneous liquids
- self-consistent Monte Carlo simulation.
1. Introduction
Advances in the understandings of the structures of liquid metal-vapor and liquid metal-solid interfaces have been made in the past decades . The progress has been made possible by a combination of theoretical computer simulation and experimental studies of grazing incidence x-ray diffraction and reflection [26-34], including simple liquid metals, binary alloys , and ternary alloys .
The characteristic factors of the liquid metal-vapor interface are represented by the density distribution along the normal and the pair correlation function parallel to the liquid-vapor interface. These factors can be used to predict the magnitude of segregation of solute in the liquid-vapor interfaces of alloys and the occurrence of two-dimensional crystallization in the segregated layer in the liquid-vapor interface in dilute alloy systems.
Due to the complexity of the inhomogeneous systems, there is no ideal solution to solve these systems. So far, the most successful theoretical approach is the pseudo-potential representation that is established through a multi-component, disorderly distribution of ion cores and valence electrons. Then, based on the constructed pseudo-potential system Hamiltonian, a self-consistent Monte Carlo simulation is carried out to obtain the longitudinal density distribution.
In many practical applications, local density approximations have been employed to approximate an inhomogeneous system. This is achieved by invoking the properties of a homogeneous fluid and using a local density to approximate the properties of an inhomogeneous system. Within many local density approaches, it appears that the local density with a pseudopotential approximation for ion interaction is quite satisfactory in the descriptions of the behavior of the transversal pair correlation function.
The reported liquid metal-vapor interface systems include both simple liquid metals and their alloys, e.g., alkaline metals, gallium (Ga), aluminum (Al), indium (In), thallium (Tl), mercury (Hg), tin (Sn), lead (Pb), InGa binary alloys, BiGa binary alloys, GaSn binary alloy, dilute Pb in Ga alloy, dilute Tl in Ga Alloy, dilute ternary alloy of Pb and Sn in Ga, and more.
2. The Density Distribution
2.1. Pseudo-potential Hamiltonian
The pseudo-potential system Hamiltonian is given by
where 
is the effective pair interaction potential, The pseudo-potential
is a structure independent contribution to the energy, including the electron-ion and the ion-ion interactions. The pseudo-potential depends only on the electron density
and a reference core density
.
2.2. Electron Density Profile
Based on a given ion-ion interaction from the pseudo-potential Hamiltonian, several electron density profiles may be prepared along the z-axis. This can be done before ion-core density simulation to achieve calculational efficiency. These electron density profiles can be prepared around the bulk density of the liquid metal. Based on a model “jellium distribution” which is a rigid electron-profile, the electron density profiles can be obtained by solving the Kohn-Sham equation. A typical representation of the electron density profiles is presented in Fig.1.
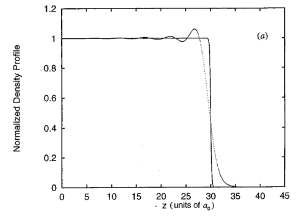
Figure 1. A normalized longitudinal electronic density profile of liquid Ga (oscillation) based on a “jellium distribution” (solid) [Phys. Rev. E 1997, 56, 7033].
2.3. Monte Carlo Simulation
Usually, a common model of system simulation consists of a slab that contains N ions and nN electrons, where n is the valency of the metal. The particles are randomly placed on the slab that is parallel to the x-y plane. The simulation box has the 3-D boundaries L0 x L0 x 2L0 in the x, y, and z directions. The side of the box (L0) is selected such that the average density of the ions in the slab matches the density of the liquid metal. A schematic representation of a simulation slab at the initial condition is presented in Fig. 2. It shows a liquid BiGa binary alloy with a dilute Bi (4%) in Ga (96%) at the liquid-vapor interface.
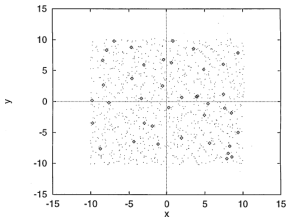
Figure 2. A simulation slab at the outmost layer of the BiGa liquid metal-vapor interface where the XY-plane is parallel to the interface and the coordinates are in atomic units (au) [J. Chem. Phys. 1998, 108, 5055].
The total depth of the simulation slab may be arranged from 10-17 layers which are usually slightly more than the characteristic layering structure of the interface. Each layer is about an atomic diameter in thickness. Each side of the slab at the interface can be about 5-7 layers. The initial configuration eliminates ion-core to ion-core overlaps by a force-biased Monte Carlo simulation with periodic boundary conditions.
3. Atomic Density Profiles
The most important feature of the physical structure in the liquid metal-vapor interface may be understood from equilibrium correlations of the particles both in the transverse and the longitudinal direction of the interface.
3.1. The Transverse Density Profile
The pair correlation function of a system describes how the density changes concerning the separation between two particles in the system. For liquid-metal-vapor interfaces, the transverse pair correlation function that describes how the density varies within a density layer parallel to the interface can be calculated from paired particles in the interfacial region
where VT is the volume of all the particles in the layer. Assume that all atoms are in the form of a spherical shell, then Vs is an average volume of the spherical shell between r and (r + Δr), NT is the number of particles in a transverse density layer, and N(r, Δr) is the average number of pairs of particles between r and (r + Δr).
where NT is the total number of particles in the slice, N(r, Δr) is the average number of pairs of particles between r and (r + Δr), VT is the total volume of all the particles in the slice, and Vs is the average volume of the intersection of the spherical shell between r and (r + Δr). A typical air-correlation function of liquid metal (or alloy) is shown in Fig. 3.
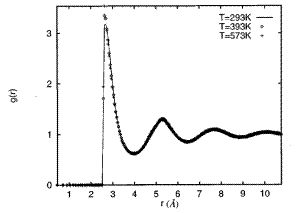
Figure 3. Pair-correlation functions of bulk liquid Ga at three different temperatures [Phys. Rev. E 1997, 56, 7033].
3.2. The Longitudinal Density Profile
For a given system, the longitudinal density profile is a key characteristic of the system structure at the interface. It provides a sensitive test for theory in comparison to the experimental observations. Fig. 4 is a typical normalized longitudinal density profile along with its corresponding electron density profile.
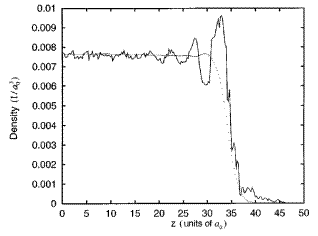
Figure 4. The longitudinal density distribution of liquid Ga with the corresponding electron density (dotted line) at the liquid-vapor interface [Phys. Rev. E 1997, 56, 7033].
For most of the reported systems of the liquid metal-vapor interface, either simple liquid metals or liquid metal alloys, pseudo-potential representation provides a qualitative agreement between theoretical predictions and the experimental observations. Fig. 5 shows a representative comparison between the experimental observation and the theoretical prediction from simulation based on pseudo-potential Hamiltonian. It shows that the simulated longitudinal density profile agrees qualitatively well with the experimental observation.
It has been noted that the density distributions are usually not sensitive to temperature. There is hardly any obvious difference between the density profiles at different temperatures. This is both for pure metals and for alloys.
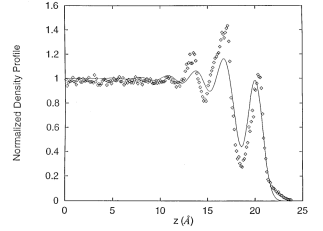
Figure 5. A representative comparison of the density profile between the experiment (solid) and the simulation, using the BiGa binary alloy as an example [J. Chem. Phys. 1998, 108, 5055].
4. Discussion and Perspective
The theoretical description of pseudo-potential Hamiltonian with self-consistent Monte Carlo simulation has been successful in comparison to experimental observations. Studies on the liquid-vapor interface have provided us an improved understanding of these systems. In turn, it leads to successful applications in daily life. Contrarily, our understanding of the structures of liquid metal-solid interfaces has been very limited. This is mainly because of the limited experimental and theoretical studies reported so far.
There have been only a few studies of liquid metal-solid interfaces, as reported in the literature [35-39]. One of the first studies was an experimental observation and a self-consistent Monte Carlo simulation concerning the liquid Hg−Sapphire interface [35-36]. In that system, liquid Hg had an interface on the Sapphire (001) surface. We need focused studies on the liquid metal-solid interface to have a better understanding.
We are interested to know, based on our knowledge of the liquid metal-vapor interface, how to improve our understanding of liquid metal-solid interfaces. Specifically, we would like to know the differences between liquid metal-solid interfaces and liquid metal-vapor interfaces and what are the key elements that lead to these differences.
References
- Rice, S. A. Structure of the liquid-vapor interfaces of metals and binary alloys. Non-Cryst. Solids 1996, 207, 755.
- Yang, B.; Gidalevitz, D.; Li, D.; Huang, Z.; Rice, S. A. Two-dimensional freezing in the liquid-vapor interface of a dilute Pb:Ga alloy. PNAS 1999, 96(23),
- Zhao, M.; Rice, S. A. Density Distribution in the Liquid Hg-sapphire Interface. Phys. Chem A 2011, 115, 3859–3866.
- Woo, C. H.; Wang, S.; Matsuura, M. Electronic structure of metals. I. Energy independent model pseudopotential formalism. Phys. F Metal Phys. 1975, 5, 1836.
- Kohn, W.; Sham, L. J. Self-Consistent Equations Including Exchange and Correlation Effects. Rev. A 1965, 140, 1133.
- Hohenberg, P.; Kohn, W. Inhomogeneous Electron Gas. Rev. B 1964, 136, 864.
- D’Evelyn, M. P; Rice, S. A. Structure in the density profile at the liquid-metal-vapor interface. Rev. Lett. 1981, 47, 1844.
- D’Evelyn, M. P.; Rice, S. A. A study of the liquid-vapor interface of mercury: Computer simulation results. Chem. Phys. 1983, 78, 5081.
- D’Evelyn, M. P.; Rice, S. A. A Pseudoatom theory for the liquid-vapor interface of simple metals: Computer simulation studies of sodium and cesium. Chem. Phys. 1983, 78, 5225.
- Harris, J. G.; Gryko, J.; Rice, S. A. Self‐consistent Monte Carlo simulations of the electron and ion distributions of inhomogeneous liquid alkali metals. I. Longitudinal and transverse density distributions in the liquid-vapor interface of a one‐component system. Chem. Phys. 1987, 87, 3069.
- Harris, J. G.; Gryko, J.; Rice, S. A. Self-consistent Monte Carlo simulations of the electron and ion distributions of inhomogeneous liquid alkali metals. II. Longitudinal and transverse density distributions in the liquid-vapor interface of binary metallic alloys. Stat. Phys. 1987, 48, 1109.
- Jiang, X.; A. Rice, S. A. A theoretical study of the structure of the liquid Ga-diamond (111) interface. Chem. Phys. 2005, 123, 104703.
- Jiang, X.; Zhao, M.; Rice, S. A. Theoretical study of the longitudinal density distribution in the liquid-vapor interface of a dilute ternary alloy: Pb and Sn in Ga. Rev. B 2005, 72, 942011-942017.
- Jiang, X.; Zhao, M.; Rice, S. A. Longitudinal Density Distribution in the Liquid-Vapor Interface of a Dilute Tl in Ga Alloy. Rev. B 2005, 71, 1042031.
- Zhao, M; Rice, S. A. Density Distribution in the Liquid-Vapor Interface of a Dilute Pb in Ga. Rev. B 2001, 63, 85409.
- Rice, S, A.; Zhao, M. Quantum Monte Carlo Simulation Studies of the Structure of the Liquid and the Liquid-Vapor of Sn and Pb. Phys. Chem. A 1999, 103, 10159-10165.
- Zhao, M.; Chekmarev, D.; Rice, S, A. Quantum Monte Carlo Simulations of the Structure in the Liquid-Vapor Interface of BiGa Binary Alloys. Chem. Phys. 1998, 108, 5055-5067.
- Rice, S, A.; Zhao, M. Self-Consistent Quantum Monte Carlo Simulations of the Structure of Liquid-Vapor Interface of a Eutectic Indium-Gallium Binary Alloy. Rev. B 1998, 57, 13501-13507.
- Zhao, M.; Chekmarev, D.; Cai, Z. H.; Rice, S, A. The Structure of Liquid Ga and the Liquid-Vapor Interface of Ga. Rev. E 1997, 56, 7033-7042.
- Rice, S.A.; Zhao, M.; Chekmarev, D. Theoretical Studies of the Structures of the Liquid-Vapor Interfaces of Metals and Binary Alloys in Microscopic Simulation of Interfacial Phenomena in Solids and Liquids, The Materials Research Society, Vol. 492, 1998, pp.3-14.
- Zhao, M.; Chekmarev, D.; Rice, S, A. Comparison of the Structure of the Liquid-Vapor Interfaces of Al, Ga, In and Tl. Chem. Phys. 1998, 109, 1959-1965.
- Chekmarev, D.; Zhao, M.; Rice, S. A. Structure of the Liquid-Vapor Interface of a Metal from a Simple Model Potential: the Corresponding States of the Alkali Metals. Chem. Phys. 1998, 109, 768-778.
- Chekmarev, D.; Zhao, M.; Rice, S. A. Computer Simulation Study of the Structure of the Liquid-Vapor Interface of Mercury at 20, 100, and 200o Phys. Rev. E 1999, 59, 479-491.
- Zhao, M.; Rice, S. A. The Structure of Liquid-Vapor Interface of a Gallium-Tin Binary Alloy. Chem. Phys. 1999, 111, 2181-2189.
- Li, F.; Zhao, M. Structure and Liquid-Vapor Interface of a Simple Metal. Theor. Phys. 1998, 29, 167.
- Li, D.; Rice, S. A. Melting of quasi-two-dimensional crystalline Pb supported on liquid Ga. Rev. E 2005, 72, 41506.
- Li, D.; Jiang, X.; Yang, B.; Rice, S. A. Phase transitions in the liquid-vapor interface of dilute alloys of Bi in Ga: New experimental studies. Chem. Phys. 2005, 122, 224702.
- Yang, B.; Li, D.; Rice, S. A. Two-dimensional freezing of Tl in the liquid-vapor interface of dilute Tl in a Ga alloy. Rev. B 2003, 67, 212103.
- Yang, B.; Li, D.; Rice, S. A. Structure of the liquid-vapor interface of a dilute ternary alloy: Pb and In in Ga. Rev. B 2003, 67, 54203.
- Li, D.; Yang, B.; Rice, S. A. Structure of the liquid-vapor interface of a dilute ternary alloy: Pb and Sn in Ga. Rev. B 2002, 65, 224202.
- Yang, B.; Li, D.; Huang, Z.; Rice, S. A. The structure of the liquid-vapor interface of a dilute Pb in Ga alloy. Rev. B 2000, 62, 13111.
- Lei, N.; Huang, Z.; Rice, S. A. Structure of the liquid-vapor interface of a Sn:Ga alloy. Chem. Phys. 1997, 107, 4051.
- Lei, N.; Huang, Z.; Rice, S. A. Surface segregation and layering in the liquid-vapor interface of a dilute bismuth:gallium alloy. Chem. Phys. 1996, 104, 4802.
- Lei, N.; Huang, Z.; Rice, S. A.; Grayce, C. In‐plane structure of the liquid-vapor interfaces of dilute bismuth: gallium alloys: X‐ray‐scattering studies. Chem. Phys. 1996, 105, 9615.
- Zhao, M.; Rice, S. A. Density Distribution in the Liquid Hg−Sapphire Interface. Phys. Chem. A 2011, 115(16), 3859–3866.
- Tamam, L.; Pontoni, D.; Hofmann, T.; Ocko, B. M.; Reichert H.; Deutsch, M. Atomic-Scale Structure of a Liquid Metal−Insulator Interface. J. Phys. Chem. Lett. 2010, 1, 1041.
- de Jong, A. E. F.; Vonk, V.; Boćkowski, M.; Grzegory, I.; Honkimäki, V.; Vlieg, E. Complex Geometric Structure of a Simple Solid-Liquid Interface: GaN(0001)-Ga. Rev. Lett. 2020, 124(8), 086101
- Men, H.; Fan, Z. Atomic ordering in liquid aluminium induced by substrates with misfits. Materi. Science 2014, 85, 1-7.
- Vonk, V.; Cremers, M.; de Jong, A.; Pintea, S.; Vlieg, E. Atomic layering and misfit-induced densification at the Si(111)/In solid–liquid interface. Surface Science 2014, 621, 69-76.