Your browser does not fully support modern features. Please upgrade for a smoother experience.
Please note this is an old version of this entry, which may differ significantly from the current revision.
Nowadays, with the convenience of international traveling and driven by many individuals’ fond dreams of challenging high-altitude exercises, high-altitude mountaineering is becoming increasingly popular worldwide. Therefore, researchers performed a meta-analysis to determine the effects of high-altitude mountaineering on cognitive functions in mountaineers before and after climbing.
- high-altitude
- mountaineering
- mountaineer
- cognitive function
1. Introduction
High-altitude mountaineering can bring about a sense of performance achievement and heightened willpower to challenge one’s environment [1]. Currently, with the convenience of international travel, high-altitude exercises, such as hiking, mountaineering, and skiing, are no longer just fond dreams for many individuals. High-altitude climbing [2] refers to the act of climbing elevations with altitudes exceeding 3500 m.
Studies have shown that hypobaric and anoxic environments in high-altitude areas affect people’s cognitive functions, such as short-term memory, attention span, attention conversion ability, and thinking and judgment ability [3][4][5][6][7], which could be potentially hazardous to individual health, both physically and mentally [8][9]. Such conditions can lead to irrational decisions, leading to falls, frostbite, accidents, fatigue, and death.
However, only a few studies have explored the physiological and cognitive changes that occur during high-altitude exploration [10][11]. In addition, most high-altitude mountaineering studies on cognitive functioning are of small sample size, and the effects of high-altitude mountaineering on cognitive function have not been well documented in a systematical format. In this meta-analysis, the effects of altitude exposure on the cognitive function of mountaineers were systematically reviewed, and applied neuropsychological tests were classified according to their superior cognitive domains. Therefore, the purpose of this meta-analysis was to critically assess the effects of high-altitude mountaineering exercise on cognitive function in terms of executive function, motor speed, memory function, and verbal function in mountaineers.
2. TMB
Three studies in which 56 participants were reported to have the test on TMB were analyzed, and three sets of statistics were generated from the comparison tests of the same groups. As shown in Table 1, there was no significant difference between the pre-test and the post-test on the participants’ TMB (95% CI, −0.05 to 0.83), and the mean ES was 0.39, p > 0.05.
Table 1. Effective size (ES) and forest plot of TMB.
| Effect Size | Forest Plot | ||||
|---|---|---|---|---|---|
| Studies | Weight | Random, 95% CI | Random, 95% CI | ||
| ES | Low | High | |||
| Charles | 38.31% | 0.64 | 0.04 | 1.25 | 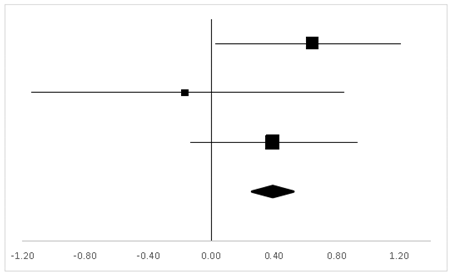 |
| Carole | 17.67% | −0.17 | −1.15 | 0.81 | |
| Gregory | 44.02% | 0.39 | −0.16 | 0.94 | |
| Total | 100% | 0.39 | −0.05 | 0.83 | Test for overall effect: Z = 1.72 (p > 0.05) |
| Heterogeneity: Q = 1.98, df = 2, C = 17.55, T2 = −0.001 | |||||
3. DSF
Six studies with 123 participants tested on DSF were analyzed, and six sets of statistics were generated from the comparison tests of the same groups. As shown in Table 2, there was a significant difference regarding DSF (95% CI, 0.24–0.90) between the pre-test and the post-test, and the mean ES was 0.57, p < 0.01.
Table 2. ES and forest plot of DSF.
| Effect Size | Forest Plot | ||||
|---|---|---|---|---|---|
| Studies | Weight | Random, 95% CI | Random, 95% CI | ||
| ES | Low | High | |||
| Charles | 22.2% | −0.19 | −0.79 | 0.40 | 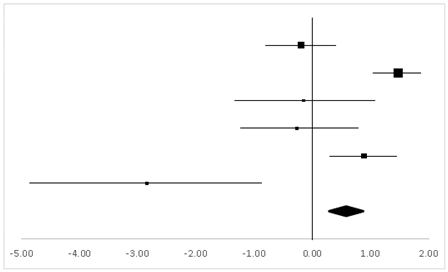 |
| Wu | 35.21% | 1.47 | 1.06 | 1.88 | |
| Philip | 6.52% | −0.15 | −1.39 | 1.09 | |
| Carole | 9.87% | −0.27 | −1.25 | 0.72 | |
| Gregory | 23.47% | 0.88 | 0.31 | 1.45 | |
| Carine | 2.74% | −2.85 | −4.81 | −0.88 | |
| Total | 100% | 0.57 | 0.24 | 0.90 | Test for overall effect: Z = 3.36 (p < 0.01) |
| Heterogeneity: Q = 42.10, df = 5, C = 40.30, T2 = 0.92 | |||||
4. DSB
Three sets of statistics were generated from the comparison tests of the same groups, with three articles involving 35 participants tested on DSB. As suggested in Table 3, there was no significant difference in DSB (95% CI, −0.83 to 0.30) between the pre-test and the post-test, and the mean ES was −0.26, p > 0.05.
Table 3. ES and forest plot of DSB.
| Effect Size | Forest Plot | ||||
|---|---|---|---|---|---|
| Studies | Weight | Random, 95% CI | Random, 95% CI | ||
| ES | Low | High | |||
| Philip | 14.92% | −1.54 | −2.95 | −0.13 | 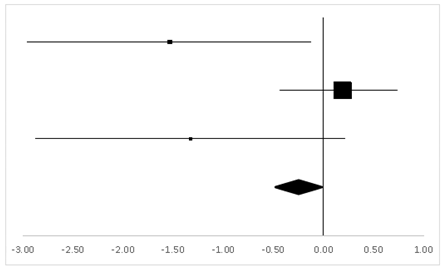 |
| Gregory | 72.28% | 0.19 | −0.36 | 0.73 | |
| Carine | 12.8% | −1.33 | −2.86 | 0.21 | |
| Total | 100% | −0.26 | −0.83 | 0.30 | Test for overall effect: Z = −0.91 (p > 0.05) |
| Heterogeneity: Q = 7.29, df = 2, C = 7.34, T2 = −0.72 | |||||
5. FTL
According to four sets of statistics from three studies with two inter-group and two inner-group comparison test designs, 58 participants had FTL and revealed no significant difference between the pre-test and the post-test in this respect (95% CI, −0.27 to 0.59), and the mean ES was 0.16, p > 0.05 (Table 4).
Table 4. ES and forest plot of FTL.
| Effect Size | Forest Plot | ||||
|---|---|---|---|---|---|
| Studies | Weight | Random, 95% CI | Random, 95% CI | ||
| ES | Low | High | |||
| Gregor | 18.9% | 0.07 | −0.86 | 0.99 | 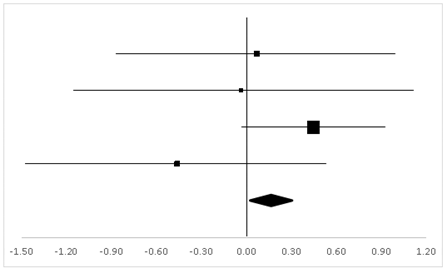 |
| Hornbein (Operation) | 13.24% | −0.04 | −1.17 | 1.09 | |
| Hornbein (Mountaineers) | 51.18% | 0.45 | −0.03 | 0.92 | |
| Carole | 16.69% | −0.46 | −1.46 | 0.53 | |
| Total | 100% | 0.16 | −0.27 | 0.59 | Test for overall effect: Z = 0.72 (p > 0.05) |
| Heterogeneity: Q = 3.07, df = 3, C = 18.39, T2 = 0.004 | |||||
6. FTR
Table 5 shows the findings of four sets of statistics from three studies on FTR. Altogether, 58 participants took the test with two inter-group and two inner-group comparison test designs. The results suggested a significant difference between the pre-test and the post-test in this respect (95% CI, 0.06–0.94), and the mean ES was 0.50, p < 0.05.
Table 5. ES and forest plot of FTR.
| Effect Size | Forest Plot | ||||
|---|---|---|---|---|---|
| Studies | Weight | Random, 95% CI | Random, 95% CI | ||
| ES | Low | High | |||
| Gregor | 19.4% | −0.26 | −1.19 | 0.67 | 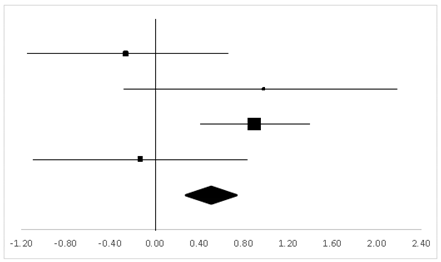 |
| Hornbein (Operation) | 12.35% | 0.98 | −0.22 | 2.18 | |
| Hornbein (Mountaineers) | 50.63% | 0.89 | 0.4 | 1.39 | |
| Carole | 17.62% | −0.13 | −1.11 | 0.85 | |
| Total | 100% | 0.50 | 0.06 | 0.94 | Test for overall effect: Z = −2.22 (p < 0.05) |
| Heterogeneity: Q = 7.38, df = 3, C = 17.73, T2 = −0.25 | |||||
7. WMSV
The findings from the WMSV participated in by 49 test-takers, as reported in two studies, indicated a significant difference between the pre-test and the post-test (95% CI, 0.14–1.12), with the mean ES being 0.63, p < 0.05 (Table 6). In this category, two studies with a within-subject design and one study with a between-subject design contributed to the three sets of statistics from which the results were generated.
Table 6. ES and forest plot of the WMSV.
| Effect Size | Forest Plot | ||||
|---|---|---|---|---|---|
| Studies | Weight | Random, 95% CI | Random, 95% CI | ||
| ES | Low | High | |||
| Hornbein (Operation) | 14.51% | 1.18 | −0.04 | 2.41 | 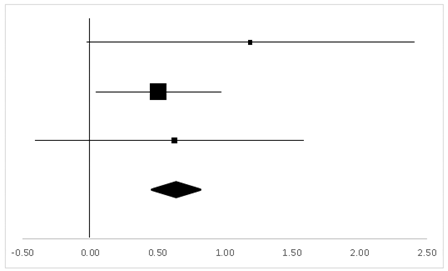 |
| Hornbein (Mountaineers) | 64.69% | 0.51 | 0.03 | 0.98 | |
| Carole | 20.8% | 0.62 | −0.38 | 1.63 | |
| Total | 100% | 0.63 | 0.14 | 1.12 | Test for overall effect: Z = 2.52 (p < 0.05) |
| Heterogeneity: Q = 0.9, df = 2, C = 11.28, T2 = −0.1 | |||||
8. AST-Ver
For AST-Ver, three sets of statistics from two studies with a within-subject design and one with a between-subject design reported 49 participants’ behaviors, and there was no significant difference between the pre-test and the post-test (95% CI, −0.38 to 0.13). The mean ES was −0.35, p > 0.05 (Table 7).
Table 7. ES and forest plot of AST-Ver.
| Effect Size | Forest Plot | ||||
|---|---|---|---|---|---|
| Studies | Weight | Random, 95% CI | Random, 95% CI | ||
| ES | Low | High | |||
| Hornbein (Operation) | 16.1% | −0.38 | −1.52 | 0.76 | 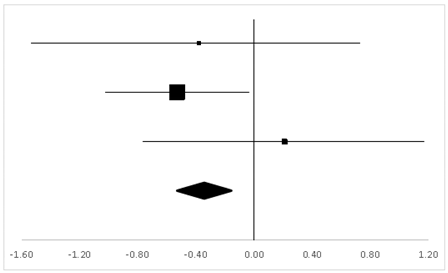 |
| Hornbein (Mountaineers) | 62.88% | −0.53 | −1.01 | −0.05 | |
| Carole | 21.01% | 0.21 | −0.77 | 1.19 | |
| Total | 100% | −0.35 | –0.83 | 0.13 | Test for overall effect: Z = −1.43 (p > 0.05) |
| Heterogeneity: Q = 1.84, df = 2, C = 12.07, T2 = −0.01 | |||||
9. AST-Vis
Two studies reported 63 participants in the Aphasia Test (Visual Motor Errors), from which, three sets of statistics with two within-subject designs and one between-subject design generated the finding, as shown in Table 8. There was no significant difference between the pre-test and the post-test (95% CI, −0.43 to 0.42), and the mean ES was 0, p > 0.05.
Table 8. ES and forest plot of AST-Vis.
| Effect Size | Forest Plot | ||||
|---|---|---|---|---|---|
| Studies | Weight | Random, 95% CI | Random, 95% CI | ||
| ES | Low | High | |||
| Charles | 37.22% | 0.27 | −0.33 | 0.86 | 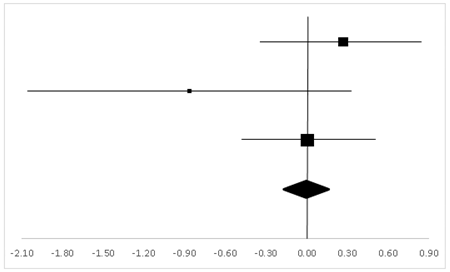 |
| Hornbein (Operation) | 11.94% | −0.87 | −2.05 | 0.32 | |
| Hornbein (Mountaineers) | 50.84% | 0 | −0.47 | 0.47 | |
| Total | 100% | 0 | −0.43 | 0.42 | Test for overall effect: Z = −0.02 (p > 0.05) |
| Heterogeneity: Q = 2.83, df = 2, C = 18.28, T2 = 0.05 | |||||
This entry is adapted from the peer-reviewed paper 10.3390/ijerph20065101
References
- Crust, L.; Swann, C.; Allen-Collinson, J. The Thin Line: A Phenomenological Study of Mental Toughness and Decision Making in Elite High-Altitude Mountaineers. J. Sport Exerc. Psychol. 2016, 38, 598–611.
- Paralikar, S.J.; Paralikar, J.H. High-altitude medicine. Indian J. Occup. Environ. Med. 2010, 14, 6–12.
- Du, J.Y.; Li, X.Y.; Zhuang, Y.; Wu, X.Y.; Wang, T. Effects of Acute Mild and Moderate Hypoxia on Human Short Memory. Space Med. Med. Eng. 1999, 12, 270–273.
- Li, X.; Wu, X.; Han, L.; Wei, Y.; Wang, T. The effects of acute moderate hypoxia on humanerformance of attention span and atiention shift. J. Fourth Mil. Med. Univ. 1999, 20, 71–73.
- Pelamatti, G.; Pascotto, M.; Semenza, C. Verbal free recall in high altitude: Proper names vs common names. Cortex 2003, 39, 97–103.
- Bonnon, M.; Noel, M.C.; Therme, P. Effects of different stay durations on attentional performance during two mountain expeditions. Aviat. Space Environ. Med. 2000, 71, 678–684.
- Leifflen, D.; Poquin, D.; Savourey, G.; Barraud, P.A.; Raphel, C.; Bittel, J. Cognitive performance during short acclimation to severe hypoxia. Aviat. Space Environ. Med. 1997, 68, 993–997.
- Wang, J.; Ke, T.; Zhang, X.; Chen, Y.; Liu, M.; Chen, J.; Luo, W. Effects of acetazolamide on cognitive performance during high-altitude exposure. Neurotoxicol. Teratol. 2013, 35, 28.
- De, A.L.V.; Antunes, H.K.; dos Santos, R.V.; Lira, F.S.; Tufik, S.; de Mello, M.T. High altitude exposure impairs sleep patterns, mood, and cognitive functions. Psychophysiology 2012, 49, 1298–1306.
- Grocott, M.P.; Martin, D.S.; Wilson, M.H.; Mitchell, K.; Dhillon, S.; Mythen, M.G.; Montgomery, H.E.; Levett, D.Z. Caudwell xtreme everest expedition. High Alt. Med. Biol. 2010, 11, 133–137.
- West, J.B. American medical research expedition to Everest. High Alt. Med. Biol. 2010, 11, 103–110.
This entry is offline, you can click here to edit this entry!