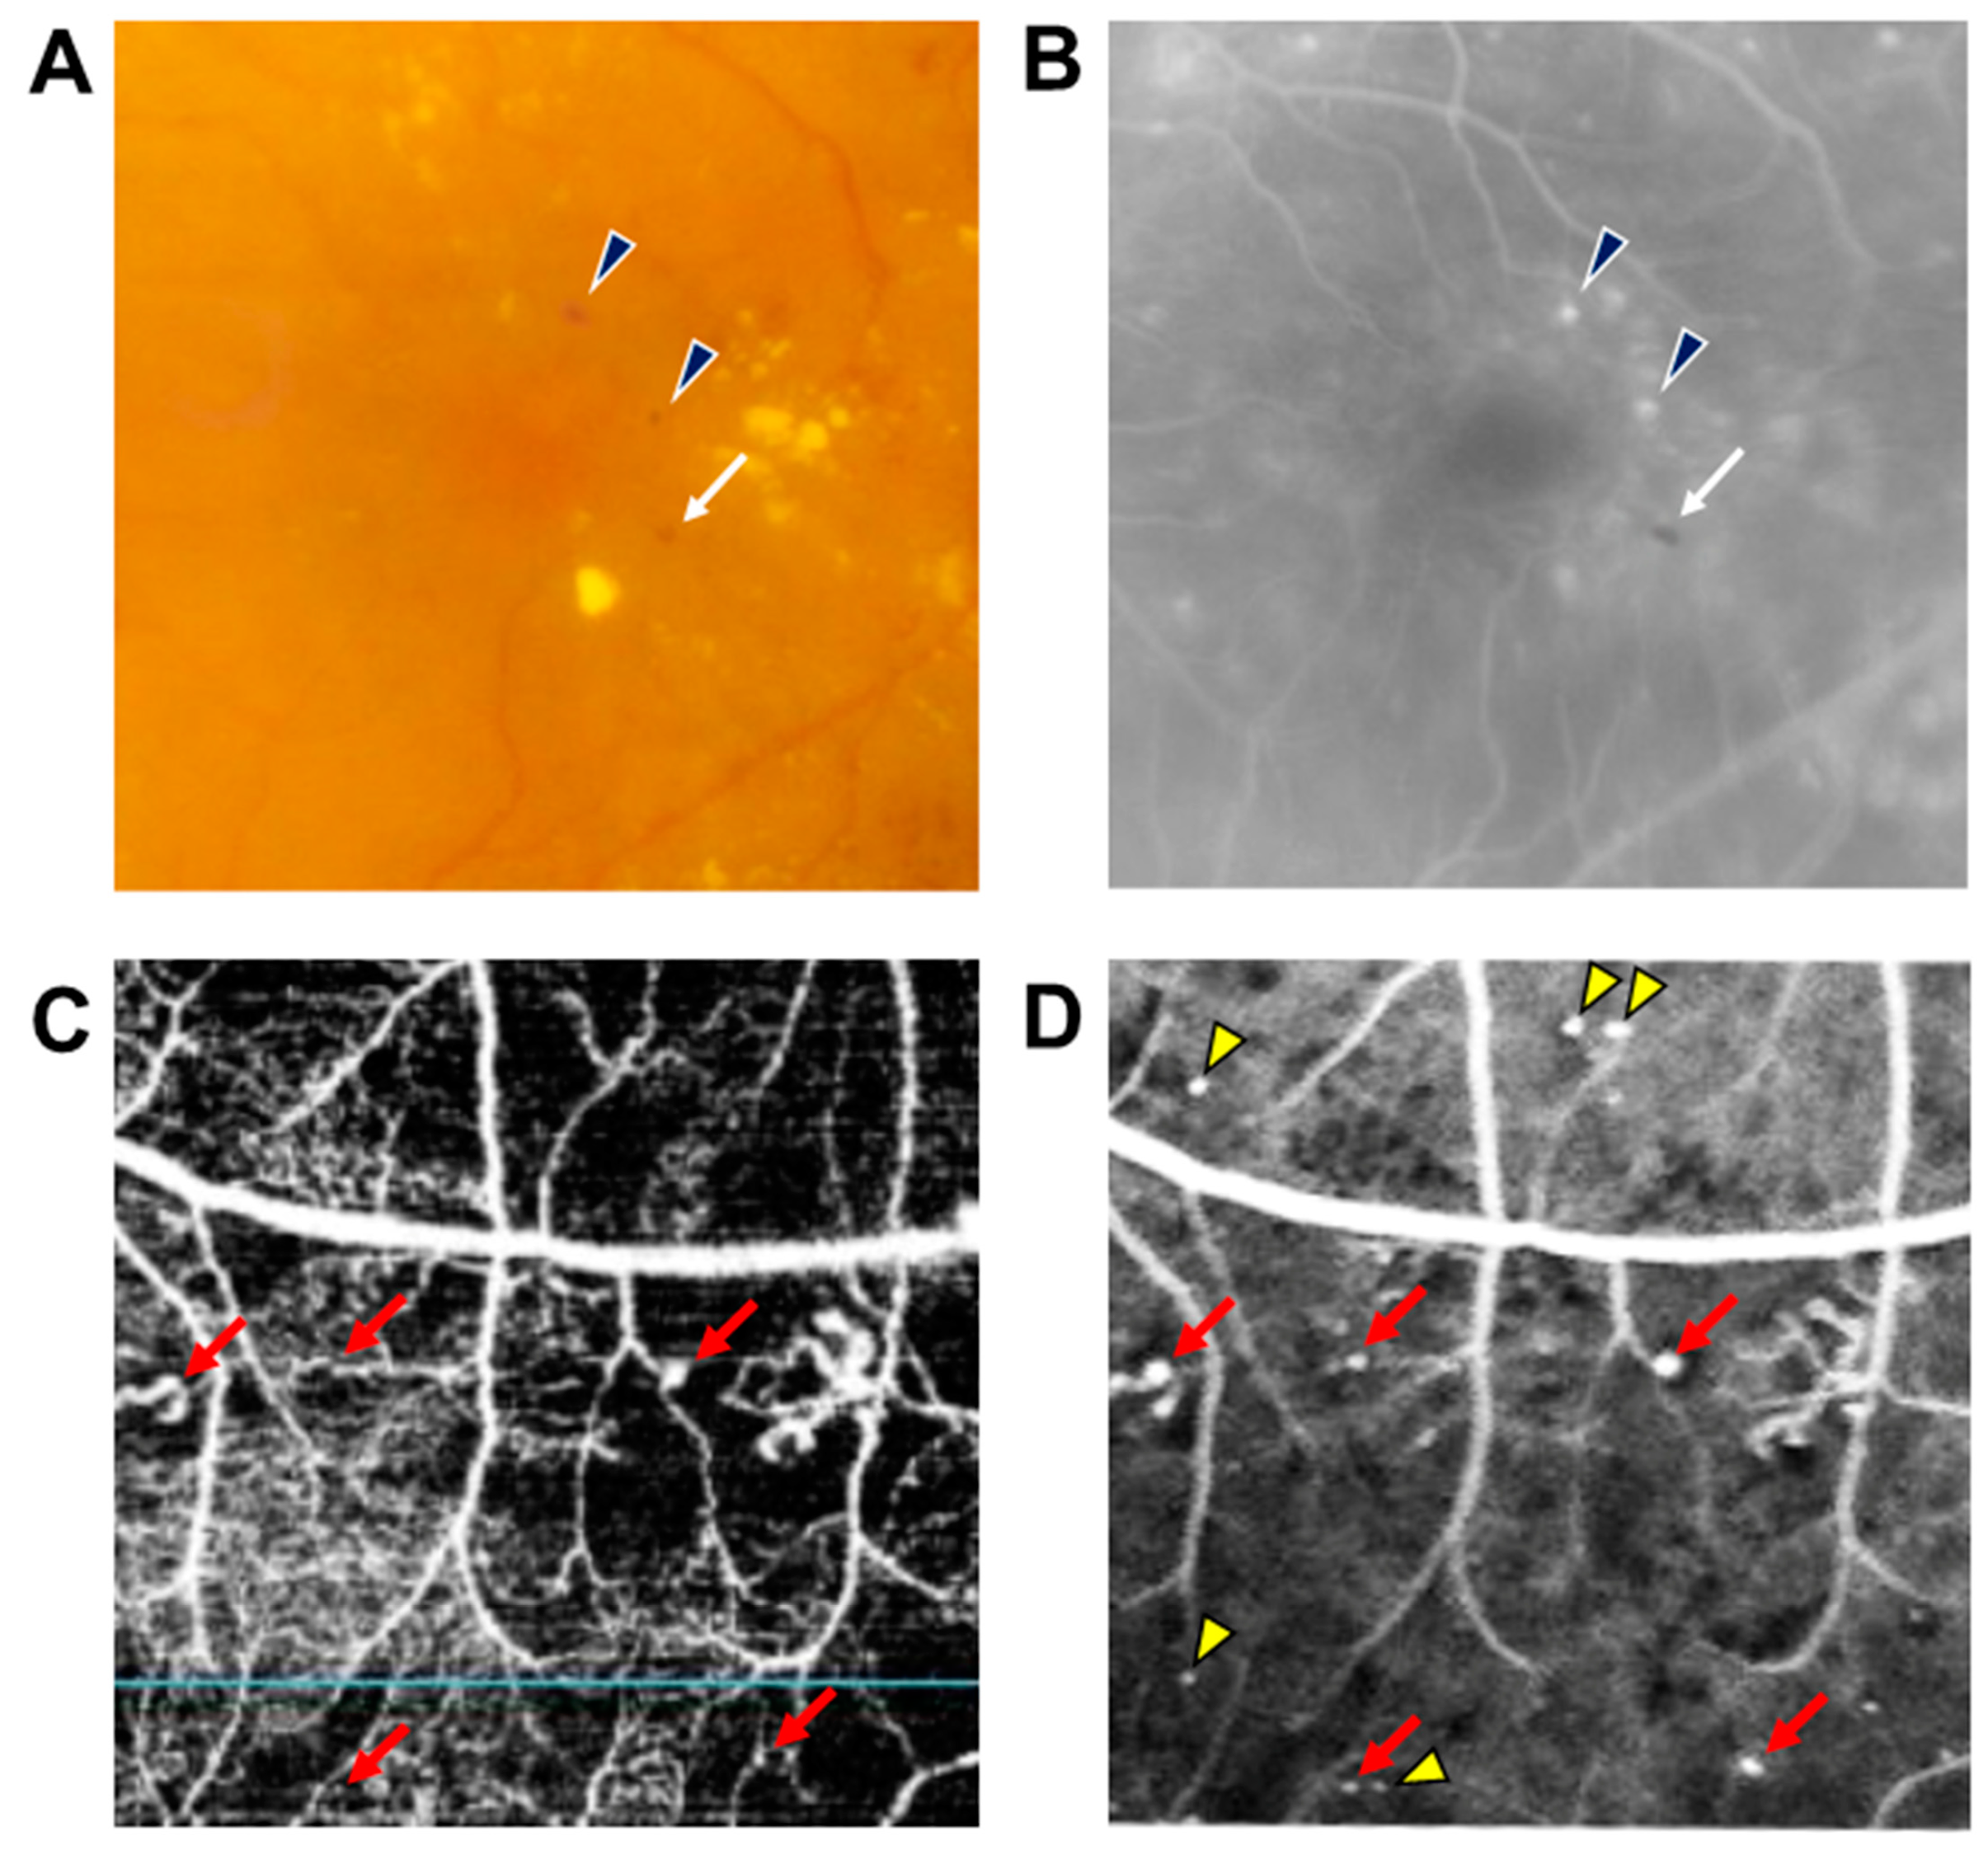
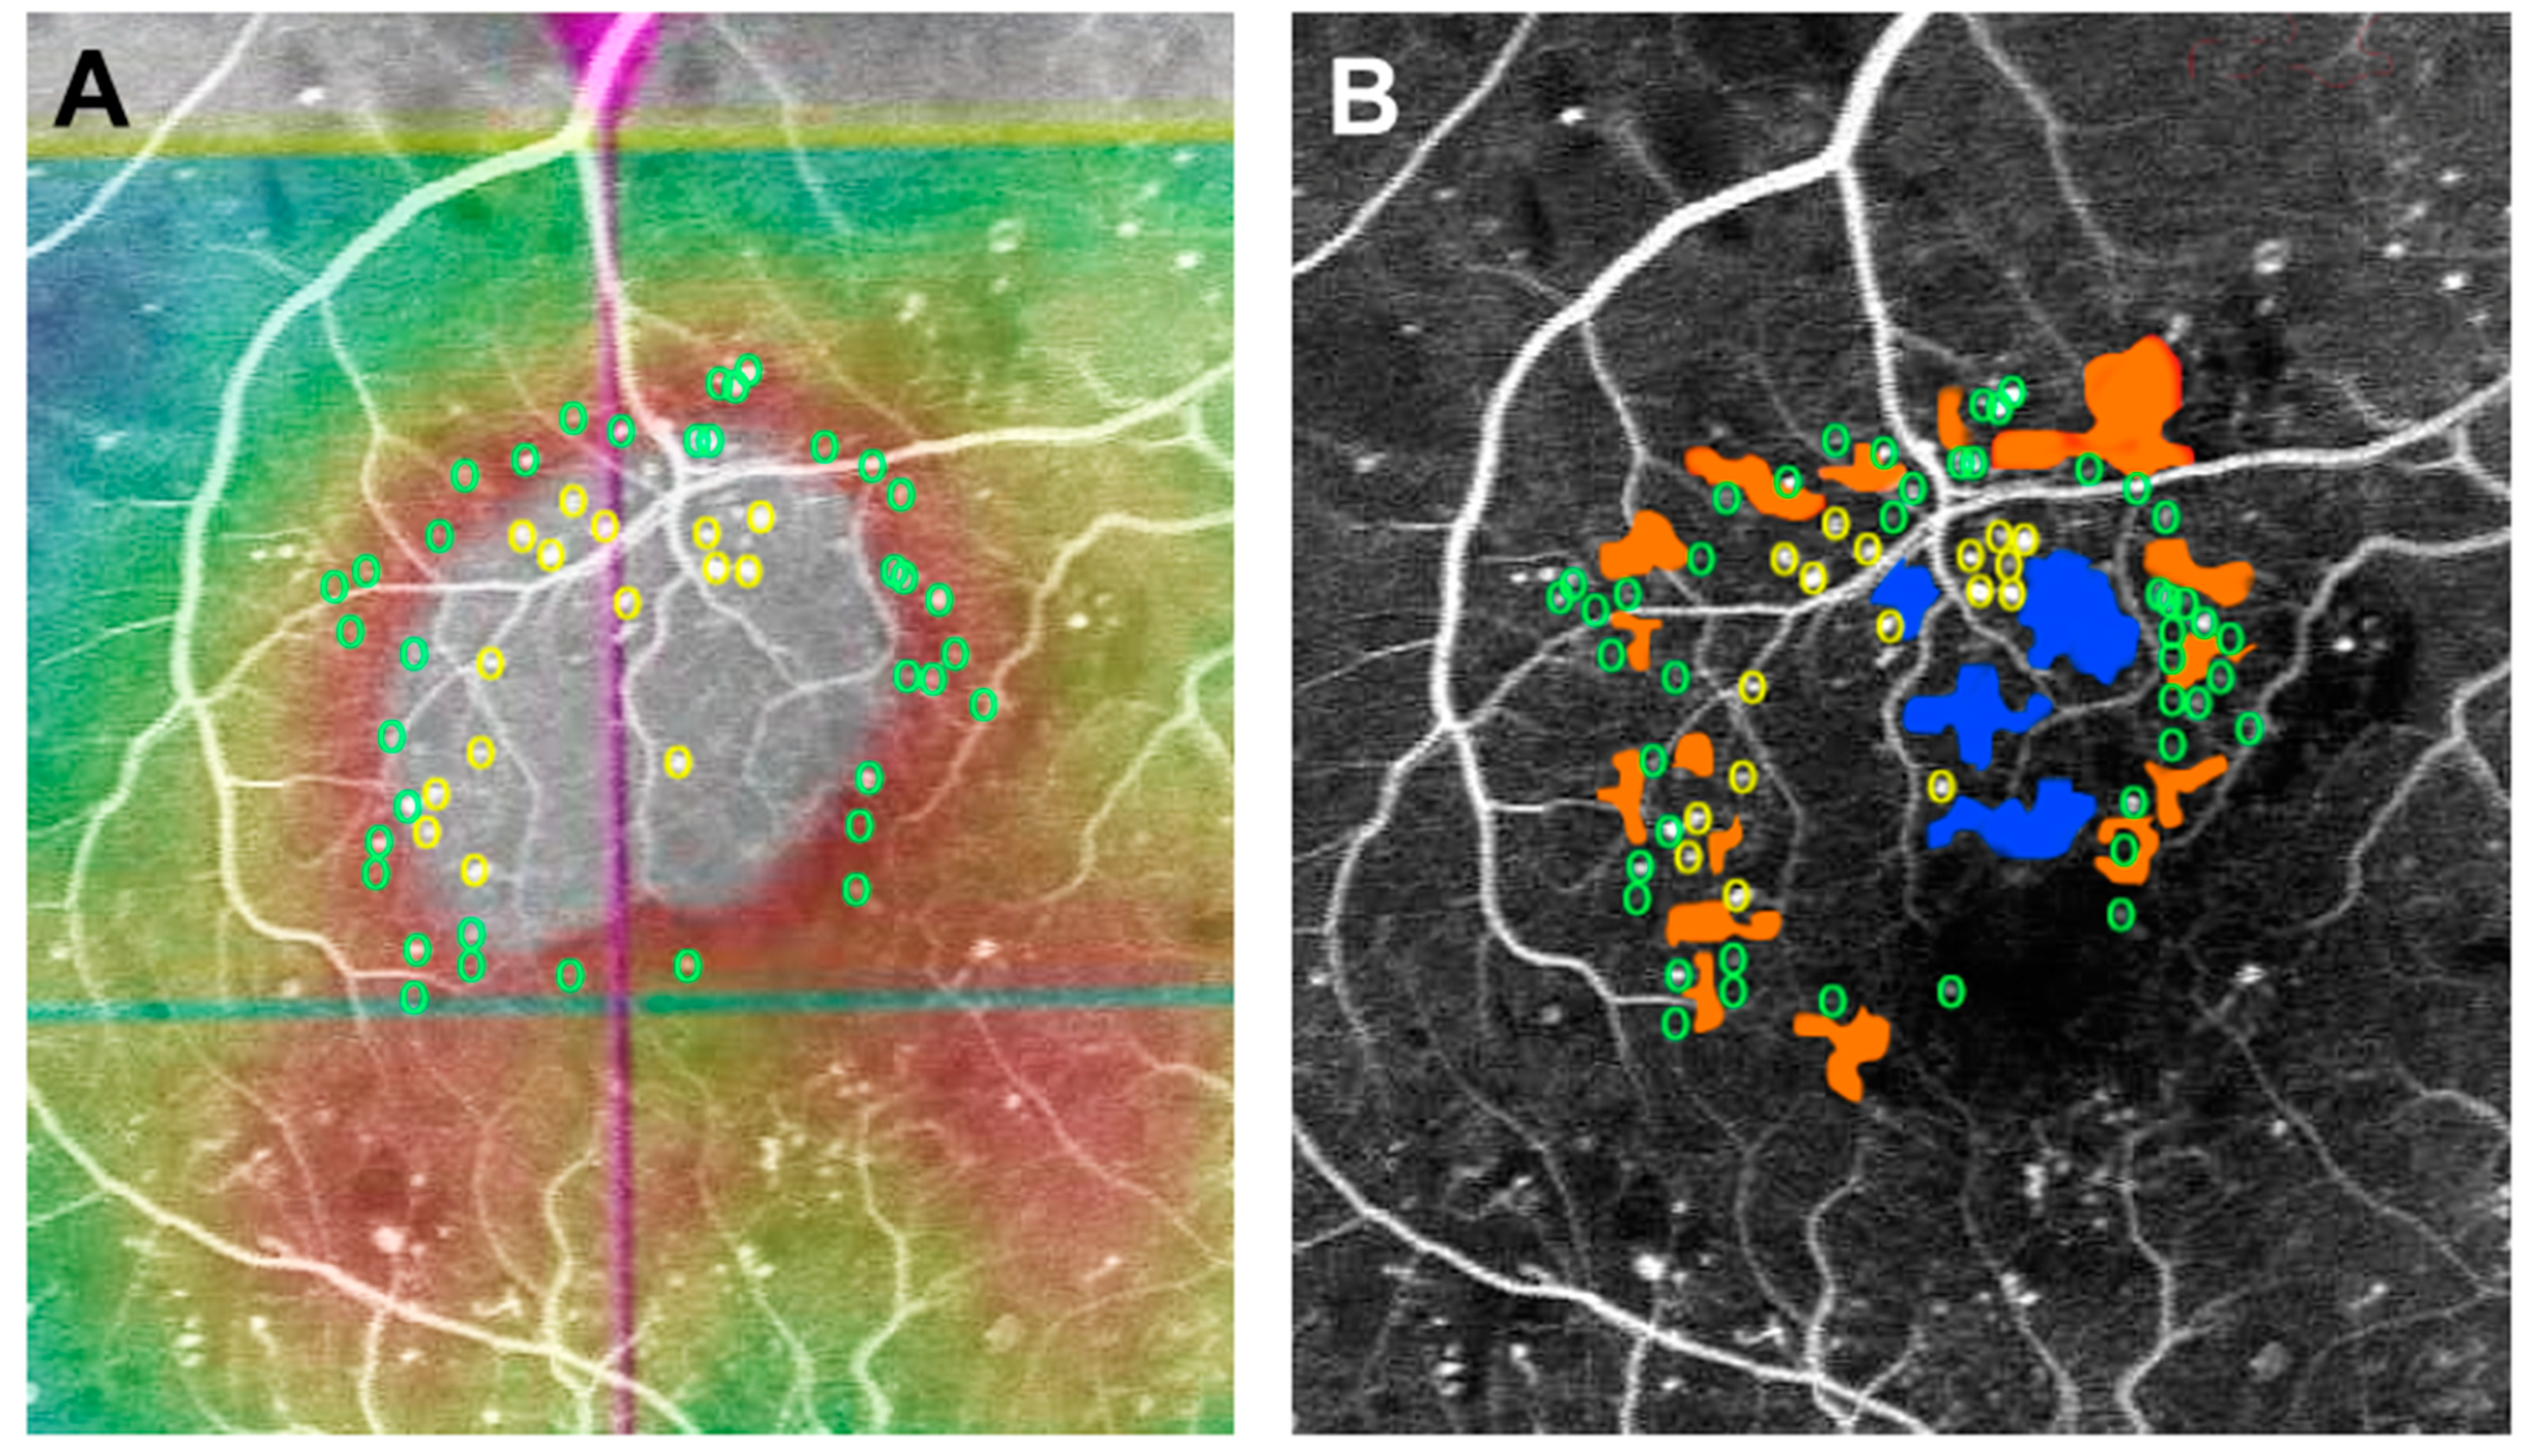
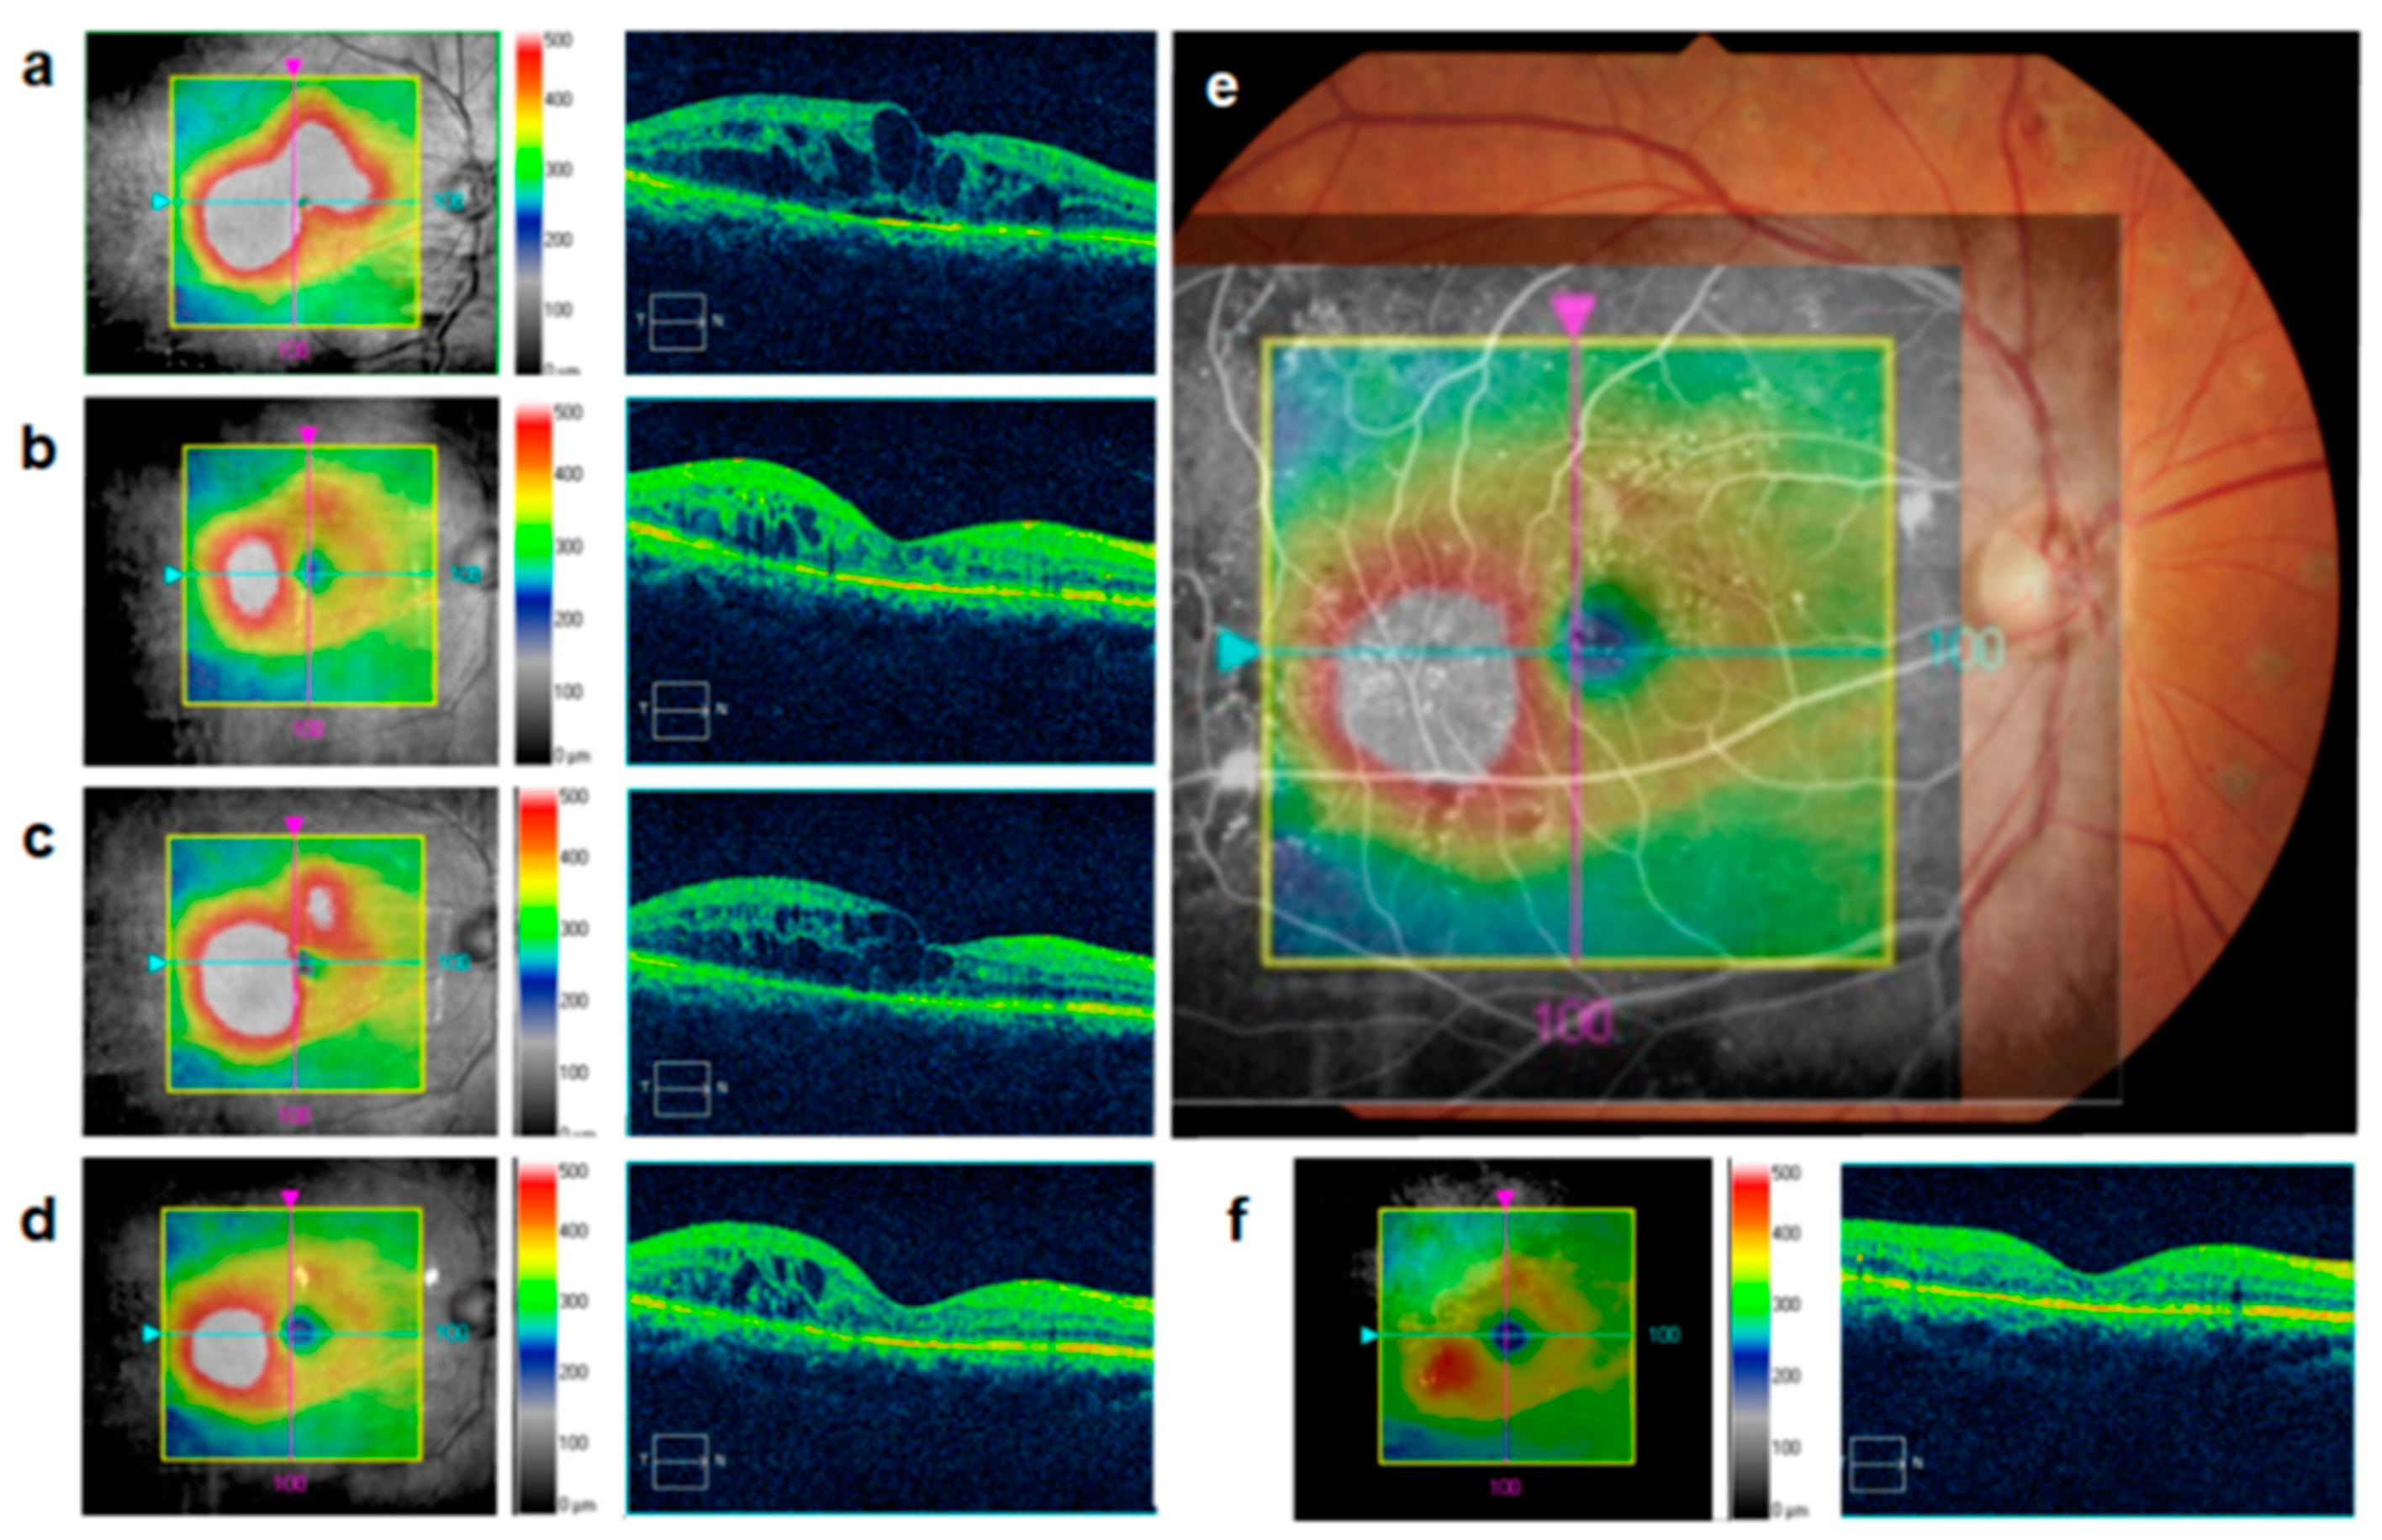
Microaneurysms (MAs), a characteristic feature in diabetic retinopathy (DR) and diabetic macular edema (DME), can be detected by fluorescein angiography, optical coherence tomography (OCT) and OCT angiography. These instrumental analyses demonstrated a geographic and functional association between MA and ischemic areas. MA turnover, the production and loss of MA, reflects the activity of DME and DR. Several cytokines are involved in the pathogenesis of MAs, which is characterized by pericyte loss and endothelial cell proliferation in a vascular endothelial growth factor (VEGF)-dependent or -independent manner. Ischemia and MAs localized in the deep retinal layers are characteristic of refractory DME cases. Even in the current anti-VEGF era, laser photocoagulation targeting MAs in the focal residual edema is still an effective therapeutic tool, but it is necessary to be creative in accurately identifying the location of MAs and performing highly precise and minimally invasive coagulation. MAs play a distinctive and important role in the pathogenesis of the onset, progression of DR and DME, and response to anti-VEGF treatment. Further research on MA is significant not only for understanding the pathogenesis of DME but also for improving the effectiveness of treatment.
- diabetic retinopathy
- diabetic macular edema
- microaneurysms
1. Introduction
2. Clinical Feature of Microaneurysms
2.1. Diabetic Retinopathy (DR)

2.2. DME
2.3. Distribution Pattern of MAs in Diffuse DME

3. Pathology of MAs in DR and DME
3.1. VEGF May Potentially Induce the Development of MAs
3.2. Mechanisms of Pericyte Dropout
4. Clinical Role of MAs in the Management of DR and DME
4.1. MA Turnover Is a Biomarker for Disease Activity and Treatment
4.2. MAs Is Associated with Resistance to Anti-VEGF Therapy
4.3. Direct Photocoagulation Aiming MAs

5. Conclusions
This entry is adapted from the peer-reviewed paper 10.3390/medicina59030435
References
- Terasaki, H.; Ogura, Y.; Kitano, S.; Sakamoto, T.; Murata, T.; Hirakata, A.; Ishibashi, T. Management of diabetic macular edema in Japan: A review and expert opinion. Jpn. J. Ophthalmol. 2018, 62, 1–23.
- Cogan, D.G.; Kuwabara, T. Capillary shunts in the pathogenesis of diabetic retinopathy. Diabetes 1963, 12, 293–300.
- Bressler, N.M.; Beaulieu, W.T.; Glassman, A.R.; Blinder, K.J.; Bressler, S.B.; Jampol, L.M.; Melia, M.; Wells, J.A. Persistent Macular Thickening Following Intravitreous Aflibercept, Bevacizumab, or Ranibizumab for Central-Involved Diabetic Macular Edema With Vision Impairment: A Secondary Analysis of a Randomized Clinical Trial. JAMA Ophthalmol. 2018, 136, 257–269.
- Ogura, Y.; Shiraga, F.; Terasaki, H.; Ohji, M.; Ishida, S.; Sakamoto, T.; Hirakata, A.; Ishibashi, T. Clinical practice pattern in management of diabetic macular edema in Japan: Survey results of Japanese retinal specialists. Jpn. J. Ophthalmol. 2017, 61, 43–50.
- Nozaki, M.; Kato, A.; Yasukawa, T.; Suzuki, K.; Yoshida, M.; Ogura, Y. Indocyanine green angiography-guided focal navigated laser photocoagulation for diabetic macular edema. Jpn. J. Ophthalmol. 2019, 63, 243–254.
- Moss, S.E.; Klein, R.; Klein, B.E.K. The 14-year incidence of visual loss in a diabetic population. Ophthalmology 1998, 105, 998–1003.
- Aiello, L.P.; Avery, R.L.; Arrigg, P.G.; Keyt, B.A.; Jampel, H.D.; Shah, S.T.; Pasquale, L.R.; Thieme, H.; Iwamoto, M.A.; Park, J.E.; et al. Vascular Endothelial Growth Factor in Ocular Fluid of Patients with Diabetic Retinopathy and Other Retinal Disorders. N. Engl. J. Med. 1994, 331, 1480–1487.
- Fu, Y.; Lu, X.; Zhang, G.; Lu, Q.; Wang, C.; Zhang, D. Automatic grading of Diabetic macular edema based on end-to-end network. Expert Syst. Appl. 2023, 213, 118835.
- Fu, Y.; Zhang, G.; Li, J.; Pan, D.; Wang, Y.; Zhang, D. Fovea localization by blood vessel vector in abnormal fundus images. Pattern Recognit. 2022, 129, 108711.
- Patel, R.D.; Messner, L.V.; Teitelbaum, B.; Michel, K.A.; Hariprasad, S.M. Characterization of ischemic index using ultra-widefield fluorescein angiography in patients with focal and diffuse recalcitrant diabetic macular edema. Am. J. Ophthalmol. 2013, 155, 1038–1044.e2.
- Stefánsson, E.; Chan, Y.K.; Bek, T.; Hardarson, S.H.; Wong, D.; Wilson, D.I. Laws of physics help explain capillary non-perfusion in diabetic retinopathy. Eye 2018, 32, 210–212.
- Takamura, Y.; Yamada, Y.; Noda, K.; Morioka, M.; Hashimoto, Y.; Gozawa, M.; Matsumura, T.; Inatani, M. Characteristic distribution of microaneurysms and capillary dropouts in diabetic macular edema. Graefe’s Arch. Clin. Exp. Ophthalmol. 2020, 258, 1625–1630.
- Xue, K.; Yang, E.; Chong, N.V. Classification of diabetic macular oedema using ultra-widefield angiography and implications for response to anti-VEGF therapy. Br. J. Ophthalmol. 2017, 101, 559–563.
- Tolentino, M.J.; Miller, J.W.; Gragoudas, E.S.; Jakobiec, F.A.; Flynn, E.; Chatzistefanou, K.; Ferrara, N.; Adamis, A.P. Intravitreous injections of vascular endothelial growth factor produce retinal ischemia and microangiopathy in an adult primate. Ophthalmology 1996, 103, 1820–1828.
- Sugimoto, M.; Ichio, A.; Mochida, D.; Tenma, Y.; Miyata, R.; Matsubara, H.; Kondo, M. Multiple Effects of Intravitreal Aflibercept on Microvascular Regression in Eyes with Diabetic Macular Edema. Ophthalmol. Retin. 2019, 3, 1067–1075.
- Park, D.Y.; Lee, J.; Kim, J.; Kim, K.; Hong, S.; Han, S.; Kubota, Y.; Augustin, H.G.; Ding, L.; Kim, J.W.; et al. Plastic roles of pericytes in the blood-retinal barrier. Nat. Commun. 2017, 8, 15296.
- Ogura, S.; Kurata, K.; Hattori, Y.; Takase, H.; Ishiguro-Oonuma, T.; Hwang, Y.; Ahn, S.; Park, I.; Ikeda, W.; Kusuhara, S.; et al. Sustained inflammation after pericyte depletion induces irreversible blood-retina barrier breakdown. J. Clin. Investig. 2017, 2, e90905.
- Brindle, N.P.J.; Saharinen, P.; Alitalo, K. Signaling and functions of angiopoietin-1 in vascular protection. Circ. Res. 2006, 98, 1014–1023.
- Cai, J.; Kehoe, O.; Smith, G.M.; Hykin, P.; Boulton, M.E. The angiopoietin/Tie-2 system regulates pericyte survival and recruitment in diabetic retinopathy. Investig. Ophthalmol. Vis. Sci. 2008, 49, 2163–2171.
- Robinson, W.G.; Tillis, T.N.; Laver, N.; Kinoshita, J.H. Diabetes-related histopathologies of the rat retina prevented with an aldose reductase inhibitor. Exp. Eye Res. 1990, 50, 355–366.
- Kador, P.F.; Akagi, Y.; Terubayashi, H.; Wyman, M.; Kinoshita, J.H. Prevention of pericyte ghost formation in retinal capillaries of galactose-fed dogs by aldose reductase inhibitors. Arch. Ophthalmol. 1988, 106, 1099–1102.
- Engerman, R.L.; Kern, T.S. Experimental galactosemia produces diabetic-like retinopathy. Diabetes 1984, 33, 97–100.
- Kobayashi, T.; Kubo, E.; Takahashi, Y.; Kasahara, T.; Yonezawa, H.; Akagi, Y. Retinal vessel changes in galactose-fed dogs. Arch. Ophthalmol. 1998, 116, 785–789.
- Hirano, T.; Toriyama, Y.; Iesato, Y.; Ishibazawa, A.; Sugimoto, M.; Takamura, Y.; Nagaoka, T.; Murata, T. Effect of Leaking Foveal Microaneurysms on the Treatment of Center-Involving Diabetic Macular Edema: A Pilot Study. Ophthalmic Res. 2019, 61, 10–18.
- Takamura, Y.; Tomomatsu, T.; Kubo, E.; Tsuzuki, S.; Akagi, Y. Role of the polyol pathway in high glucose-induced apoptosis of retinal pericytes and proliferation of endothelial cells. Investig. Ophthalmol. Vis. Sci. 2008, 49, 3216–3223.
- Santos, A.R.; Mendes, L.; Madeira, M.H.; Marques, I.P.; Tavares, D.; Figueira, J.; Lobo, C.; Cunha-Vaz, J. Microaneurysm Turnover in Mild Non-Proliferative Diabetic Retinopathy is Associated with Progression and Development of Vision-Threatening Complications: A 5-Year Longitudinal Study. J. Clin. Med. 2021, 10, 2142.
- Yamada, Y.; Takamura, Y.; Morioka, M.; Gozawa, M.; Matsumura, T.; Inatani, M. Microaneurysm density in residual oedema after anti-vascular endothelial growth factor therapy for diabetic macular oedema. Acta Ophthalmol. 2021, 99, e876–e883.
- Yamada, Y.; Takamura, Y.; Matsumura, T.; Gozawa, M.; Morioka, M.; Inatani, M. Regional Variety of Reduction in Retinal Thickness of Diabetic Macular Edema after Anti-VEGF Treatment. Medicina 2022, 58, 933.
- Schmidt-Erfurth, U.; Garcia-Arumi, J.; Bandello, F.; Berg, K.; Chakravarthy, U.; Gerendas, B.S.; Jonas, J.; Larsen, M.; Tadayoni, R.; Loewenstein, A. Guidelines for the Management of Diabetic Macular Edema by the European Society of Retina Specialists (EURETINA). Ophthalmologica 2017, 237, 185–222.
