Your browser does not fully support modern features. Please upgrade for a smoother experience.
Please note this is an old version of this entry, which may differ significantly from the current revision.
The new methods to image conductivity based on magnetic forces are presented, often known as Lorentz forces.
- Lorentz force
- magneto
- record
1. Introduction
Measurement of electrical conductivity has many potential applications in biology and medicine. For instance, tumors often have different electrical properties than the surrounding tissue, so imaging conductivity might be suitable for cancer diagnosis and screening. The distribution of conductivity has been determined using several techniques, including electrical impedance tomography, magnetic resonance electrical impedance tomography, and magnetic induction tomography.
2. Towe and Islam’s Magneto-Acoustic Imaging of Current
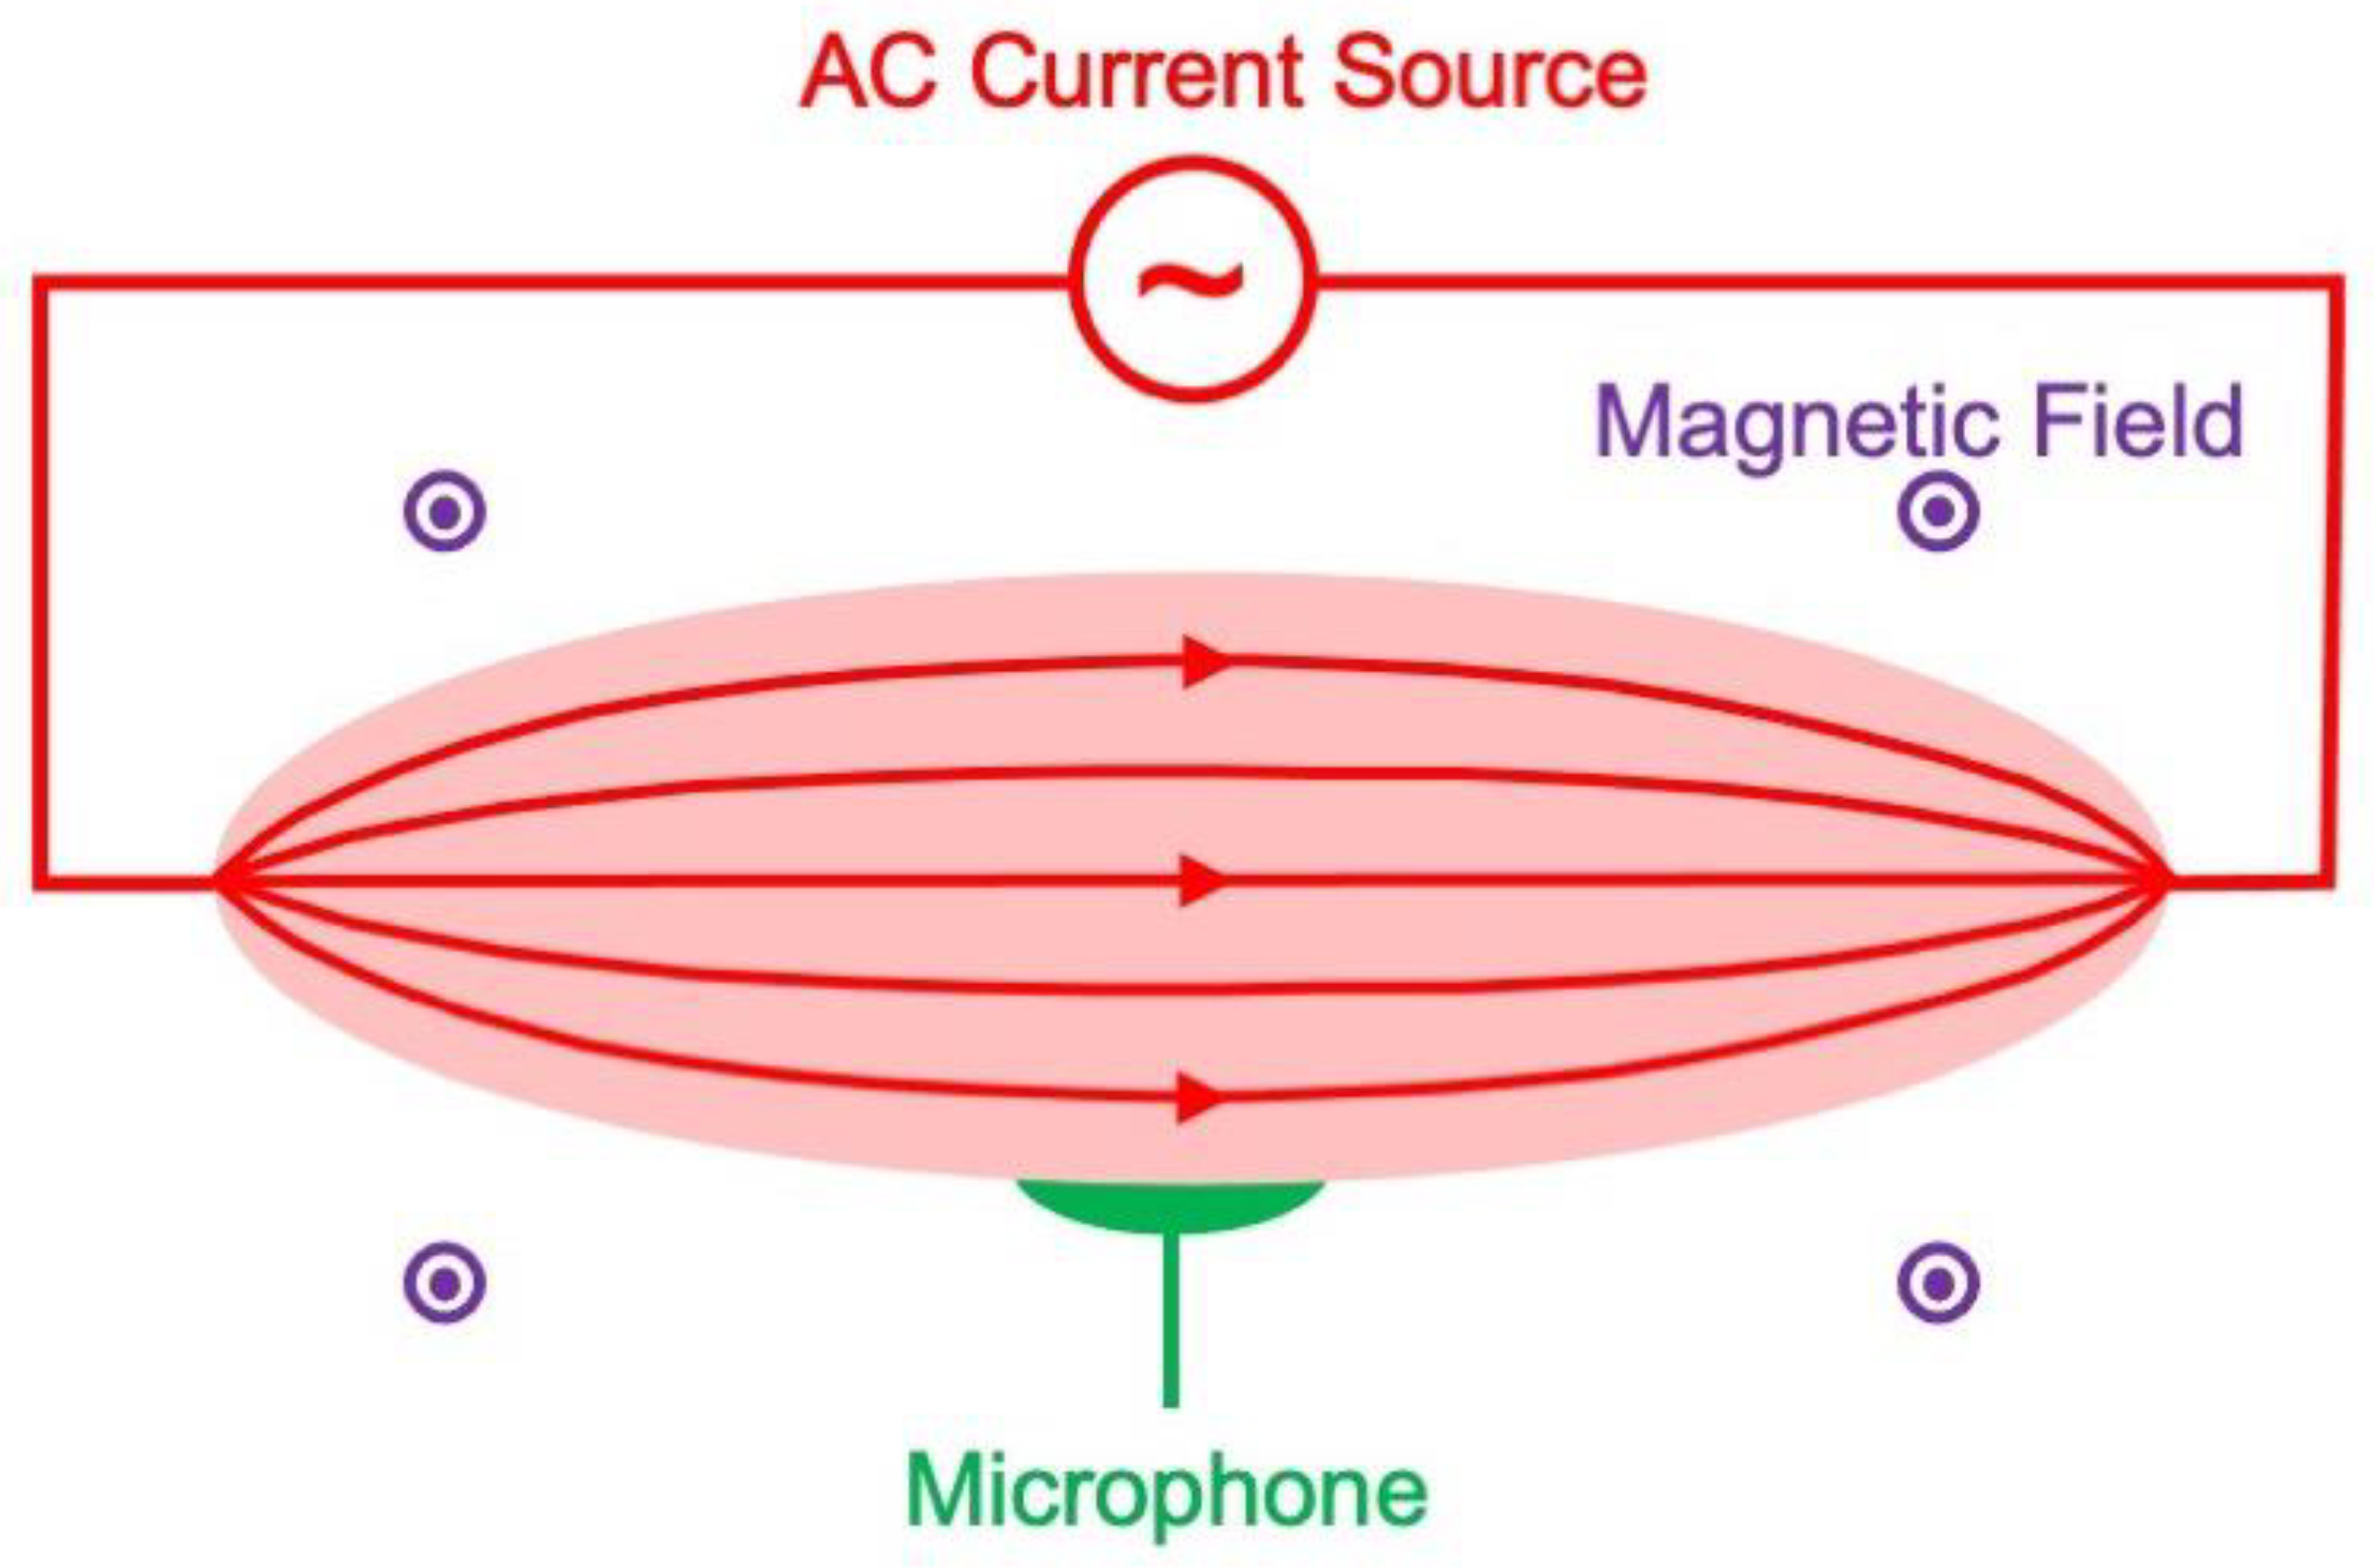
In 1988, Bruce Towe and Mohammed Islam, working at Arizona State University, developed a “novel method for the noninvasive measurement of low-level ionically conducted electric currents flowing in electrolytes and tissue” [1]. Of particular interest for this research are their experiments to detect current in hamsters (Figure 1). A few microamps of current, oscillating at a frequency of 3 kHz, were passed through electrodes placed on the neck and near the rectum. At the same time, the hamster was exposed to a 0.2 T magnetic field.

Figure 1. Magneto-acoustic imaging of current. The hamster is shown schematically in pink, the current in red, the microphone in green, and the magnetic field (directed out of the research) in purple.
An electric current in a magnetic field experiences a Lorentz force that is directed perpendicular to both the current and field. In Towe and Islam’s experiment, this force caused an acoustic oscillation that was detected with a microphone and a lock-in amplifier. They were able to record currents as low as 7 μA, and concluded that the technique was “a possible basis for a new method of noninvasively measuring bioelectric currents in living organisms.” Their subsequent investigations improved their algorithm for imaging the current distribution [2][3]. From this simple beginning arose all of the results described in this research.
3. The Source of the Magneto-Acoustic Signal
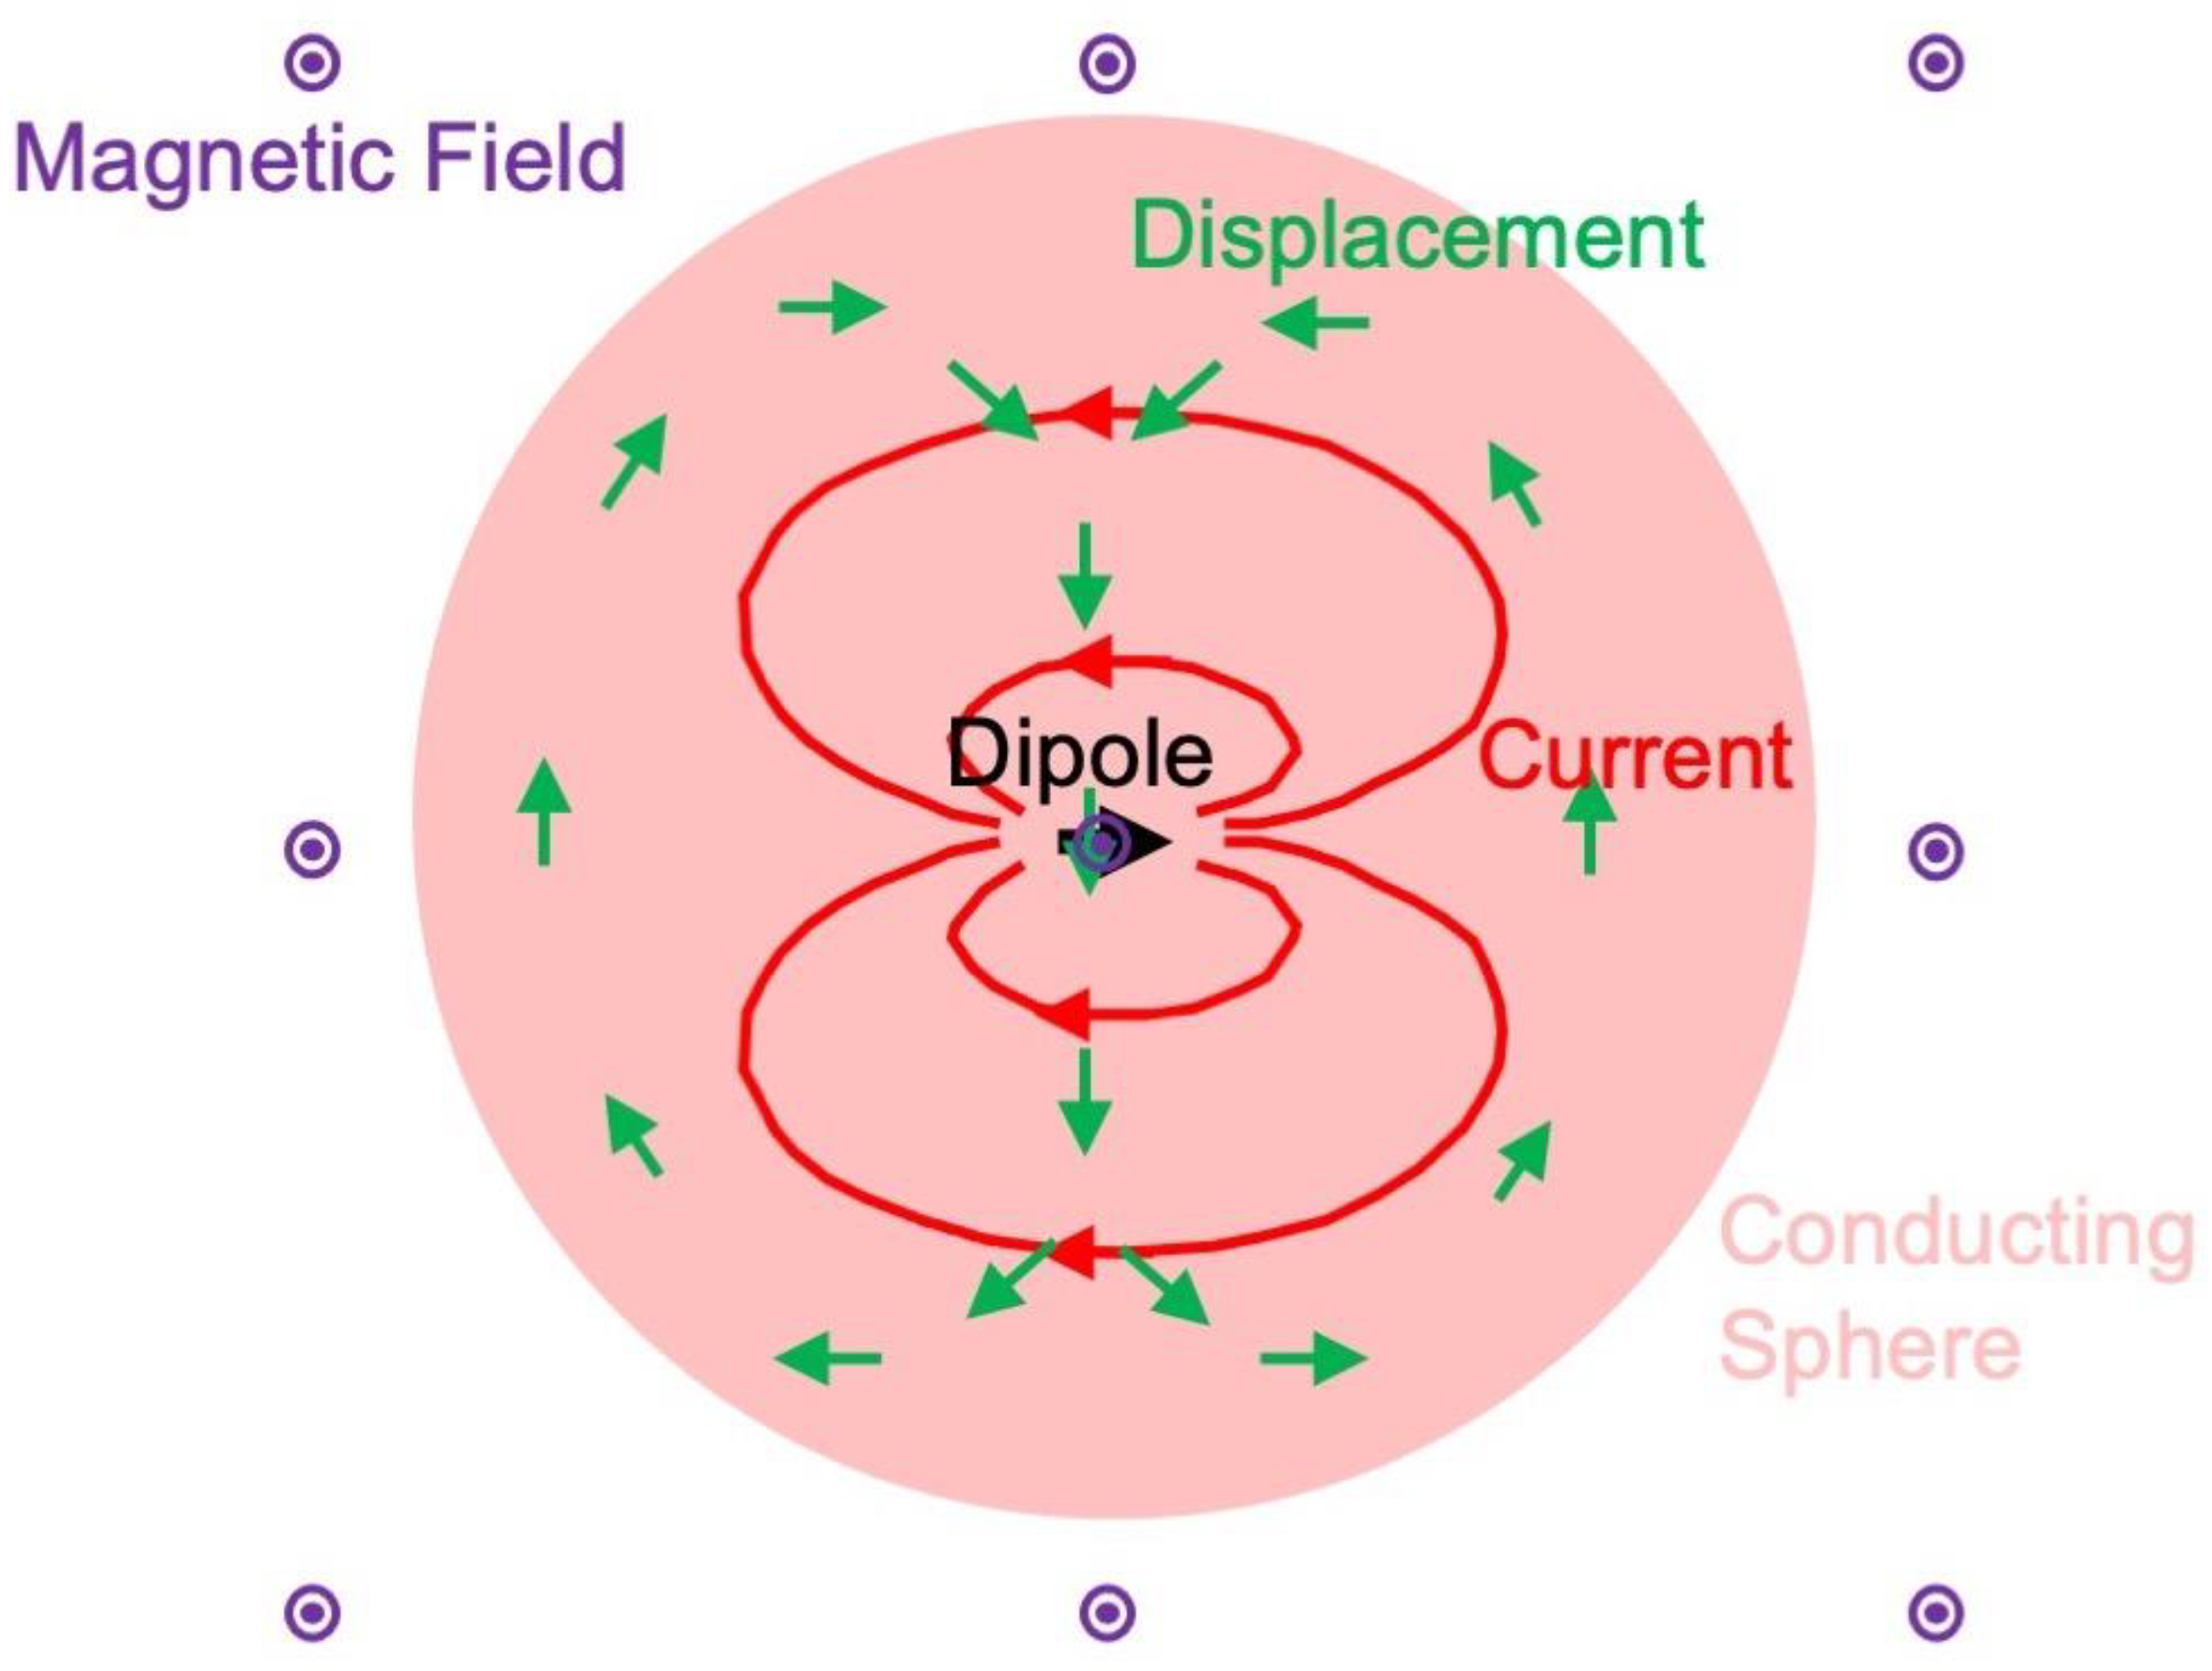
Brad Roth, employed at the National Institutes of Health and collaborating with Peter Basser and John Wikswo, calculated the displacement generated by the Lorentz force acting on a current dipole in a conducting sphere [4] (Figure 2). Their analysis of Navier’s equation governing the mechanical behavior of an elastic medium showed that the pressure distribution obeyed the Poisson equation, with a source term equal to the dot product of the magnetic field and the curl of the current density. They confirmed that the displacement is inversely proportional to the shear modulus of the tissue and is not localized around the dipole but instead is distributed widely throughout the sphere. Furthermore, they noted that magneto-acoustic and biomagnetic measurements image the current density in similar ways.

Figure 2. The current and displacement produced by a dipole in a conducting sphere.
4. Wen and Balaban’s Forward and Reverse Methods to Image Conductivity
In 1998, Han Wen, working in Robert Balaban’s laboratory at the National Institutes of Health, was the first to adopt a Lorentz force approach to image conductivity [5]. Like in Towe’s experiment, he applied current pulses to a tissue sample using two electrodes. The sample was in a static magnetic field and the resulting pressure was detected with an ultrasound transducer. Wen and his collaborators used this technique to image a block of bacon, whose alternating layers of fat and muscle had markedly different conductivities. The axial position of each layer could be determined from the arrival time of the acoustic signal produced by the Lorentz force. A later arrival time corresponded to a deeper layer because the acoustic signal needed more time to propagate to the transducer. They found that the acoustic signal emanated from regions where the conductivity was changing, which in their case meant the boundaries between fat and muscle.
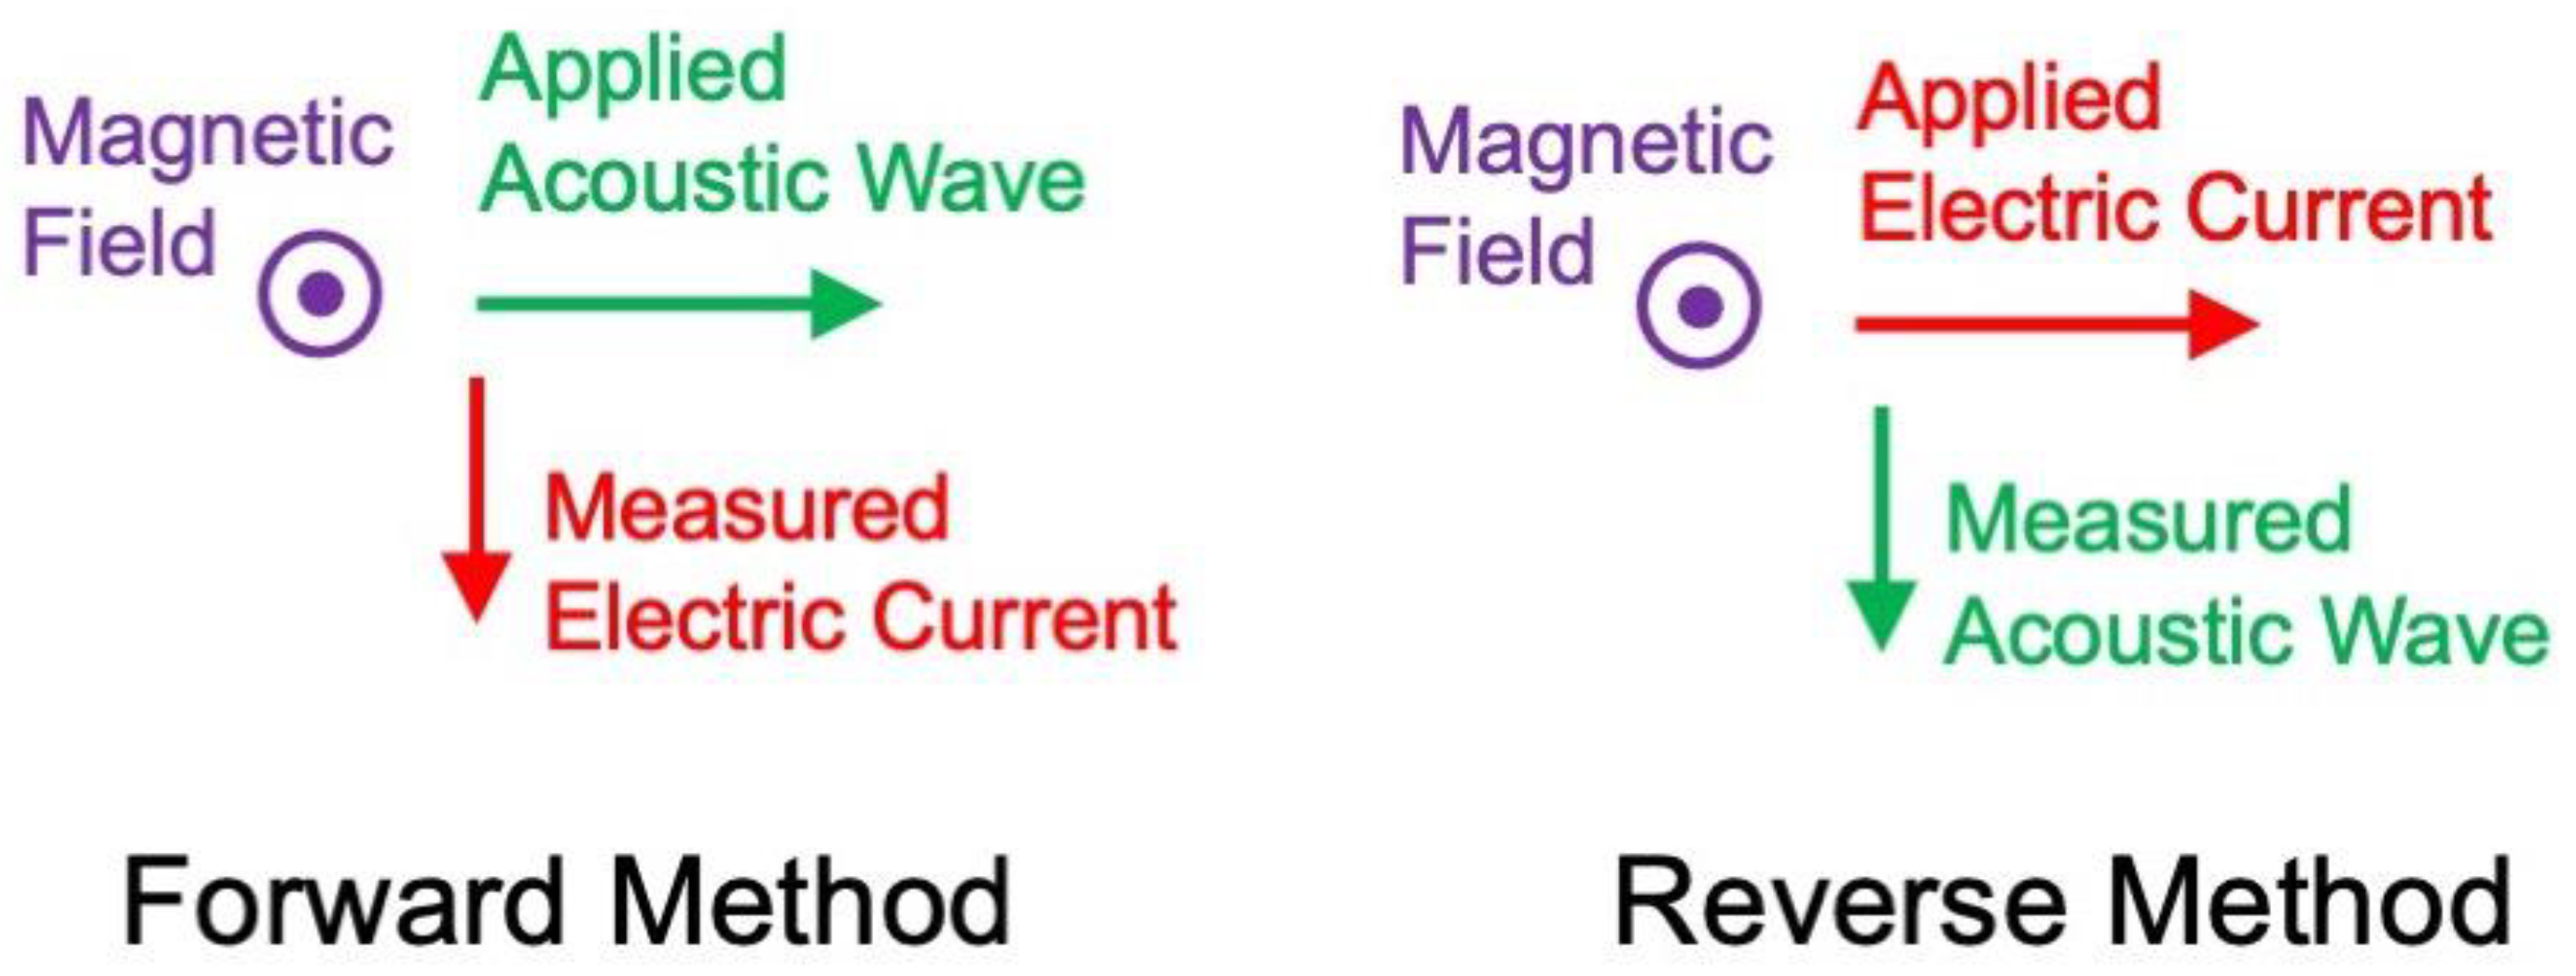
In Wen’s nomenclature, this design—in which current was injected through electrodes and an acoustic signal was recorded with a transducer—was termed the “reverse method” of conductivity imaging. The “forward method” is the opposite process: an acoustic signal is injected through a transducer and the resulting electrical signal is recorded using electrodes [5][6][7] (Figure 3). The forward method also operates through the Lorentz force. The ultrasonic wave causes the tissue to oscillate back and forth. The charged ions in the conducting fluid move with the tissue. If a static magnetic field is present, these moving ions experience a Lorentz force: the cations in one direction and the anions in the opposite direction. This separation of positive and negative charge acts as a source of the electrical potential detected by the electrodes. Wen et al. [5] applied 0.6 MHz ultrasound pulses with a duration of about 150 μs. Again, the origin of the signal was localized to where the conductivity was changing. A typical voltage difference recorded by the electrodes was a few microvolts.

Figure 3. The forward and reverse methods to perform magneto-acoustic imaging.
Wen and his coworkers named their forward method “Hall Effect Imaging.” In a comment on Wen et al.’s paper, Roth and Wikswo pointed out that the term “Hall effect” is misleading [8]. In traditional Hall effect studies, a current makes the positive and negative charge carriers move in opposite directions, so their magnetic deflections are in the same direction. A voltage appears only if the positive and negative charges have different mobilities or concentrations. In Wen et al.’s technique, the acoustic oscillation makes the positive and negative charge carriers move in the same direction, so their magnetic deflections are in opposite directions. A voltage is induced even if the mobilities and concentrations of the positive and negative charges are identical. Thus, this research will not use the term “Hall Effect Imaging.”
In their comment, Roth and Wikswo explained why the ultrasound signal in Wen et al.’s reverse method arises where the conductivity changes [8]. Its source is the curl of the current. In a homogeneous region, the current is proportional to the electric field, and in a static magnetic field the curl of the electric field is zero, so there is no source. The curl of the current is nonzero only in regions where there is a conductivity gradient and is particularly strong where there is a conductivity discontinuity. In addition, Roth and Wikswo mentioned that in anisotropic tissue the curl of the current density does not vanish even if the tissue is homogeneous.
At the start of the twenty-first century, the path leading toward the development of a Lorentz force technique to measure electrical conductivity forked. One branch was based on Wen’s reverse method where an electrical signal was injected and an acoustic signal was detected, and the other was based on Wen’s forward method where an acoustic signal was injected and an electrical signal was detected. The reverse method led to Magnetic Induction (MAT-MI).
This entry is adapted from the peer-reviewed paper 10.3390/app13063877
References
- Towe, B.C.; Islam, M.R. A magneto-acoustic method for the noninvasive measurement of bioelectric currents. IEEE Trans. Biomed. Eng. 1988, 35, 892–894.
- Islam, M.R.; Towe, B.C. Bioelectric current image reconstruction from magneto-acoustic measurements. IEEE Trans. Med. Imaging 1988, 7, 386–391.
- Towe, B.C. Investigation of a Lorentz force biomagnetometer. IEEE Trans. Biomed. Eng. 1997, 44, 455–461.
- Roth, B.J.; Basser, P.J.; Wikswo, J.P., Jr. A theoretical model for magnetoacoustic imaging of bioelectric currents. IEEE Trans. Biomed. Eng. 1994, 41, 723–728.
- Wen, H.; Shah, J.; Balaban, R.S. Hall effect imaging. IEEE Trans. Biomed. Eng. 1998, 45, 119–124.
- Wen, H. Volumetric Hall effect tomography—A feasibility study. Ultrason. Imaging 1999, 21, 186–200.
- Wen, H. Feasibility of biomedical applications of Hall effect imaging. Ultrason. Imaging 2000, 22, 123–136.
- Roth, B.J.; Wikswo, J.P., Jr. Comments on “Hall effect imaging”. IEEE Trans. Biomed. Eng. 1998, 45, 1294–1295.
This entry is offline, you can click here to edit this entry!
