Your browser does not fully support modern features. Please upgrade for a smoother experience.
Please note this is an old version of this entry, which may differ significantly from the current revision.
Cell-to-cell variation exists within a population of the same cell type due to stochastic gene and protein expression and environmental factors. Studying such cellular heterogeneity is the key to understanding the underlying mechanisms of fundamental biology and complex diseases, highly demanding developments in advanced technologies for molecular profiling at the single-cell level.
- mass spectrometry
- single-cell analysis
- proteomics
1. Introduction
The heterogeneity of cells in populations caused by cell-to-cell variation makes it necessary to analyze single cells and this will allow one to discover hidden mechanisms not seen in bulk samples (Figure 1) [1][2]. Recent studies utilizing both antibody-based methods and mass spectrometry-based methods successfully demonstrated the importance of single-cell analysis [3][4]. These single-cell analysis methods have been making rapid progress in terms of higher sensitivity as well as increased identification numbers and specificity. Single-cell analysis is essential for a deeper understanding of cancer, immunology, and other fields requiring precise information on cellular mechanisms. Diverse molecules in cells, such as RNA, proteins, and metabolites, can be analyzed at the single-cell level.
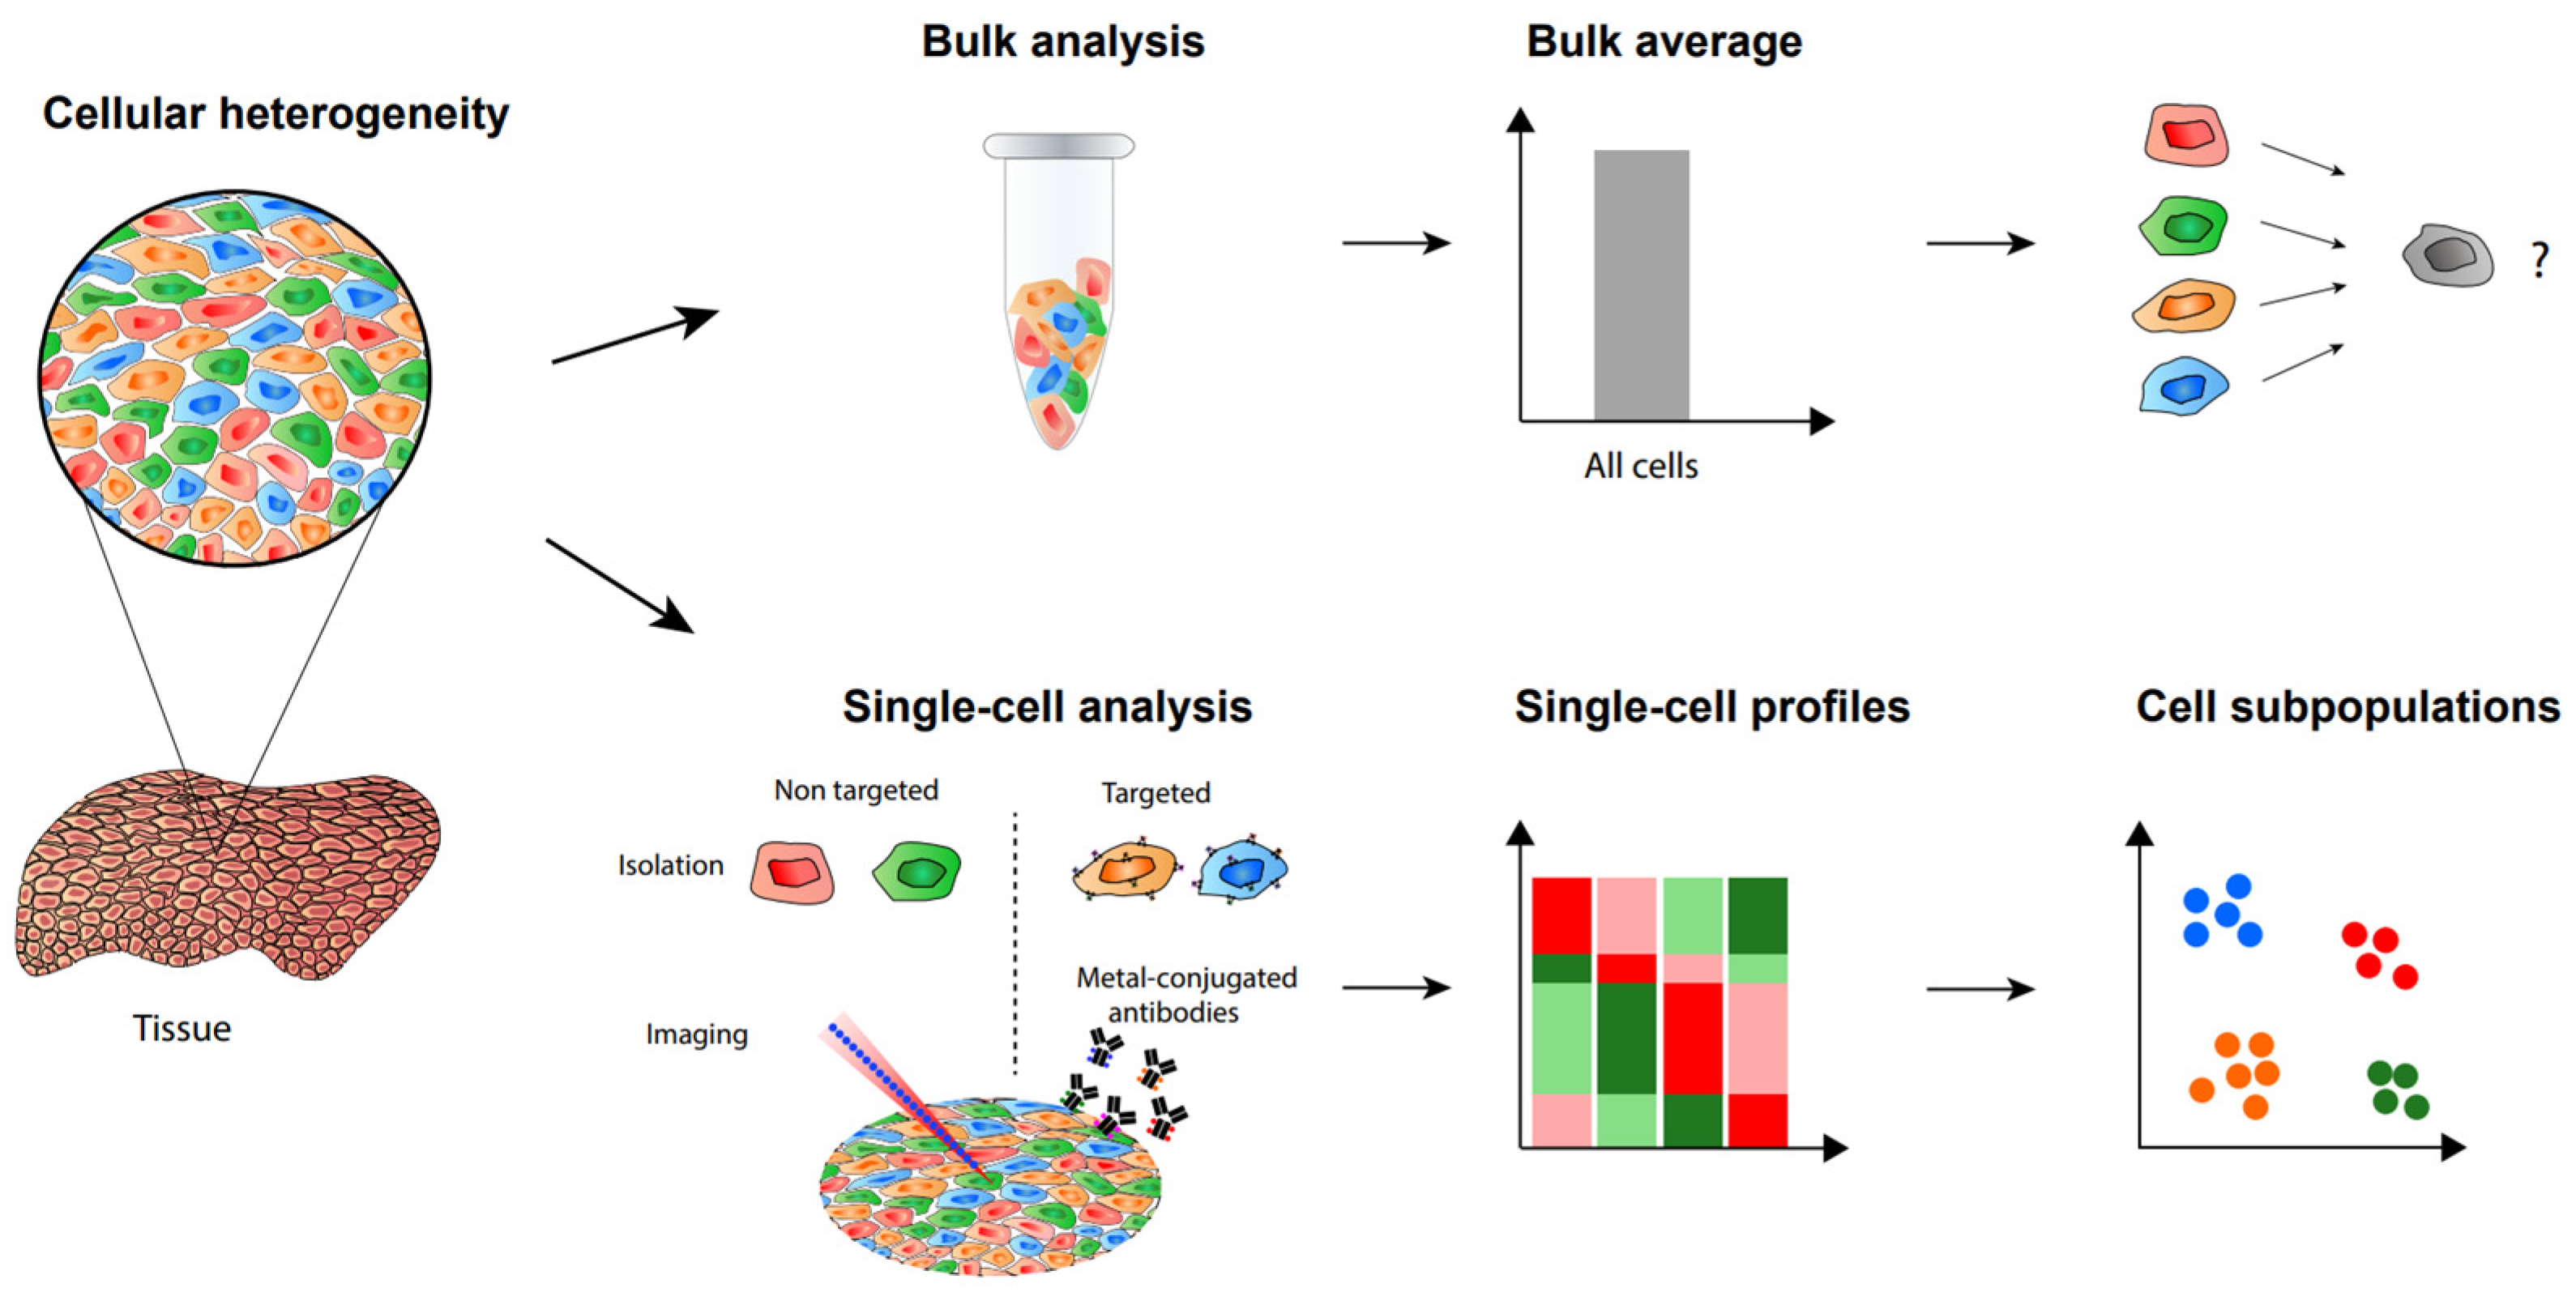
Figure 1. Single-cell analysis and imaging reveal cellular heterogeneity not seen by bulk analysis methods.
Among common approaches for single cell protein analysis are antibody-based methods. They are characterized using specific antibodies that bind to target proteins, which can then be identified through several techniques. Immunocytochemistry (ICC) is one such approach in which cultured cells or individual cells that have been isolated are tagged using an antibody of interest [5][6]. The antibody is linked to a reporter, usually a fluorophore or enzyme, which can then be detected in a microscope after fluorescence or color from an enzymatic reaction occurs. Another immunofluorescence method is immunohistochemistry (IHC), which differs from ICC in the fact that the cell staining is applied to intact tissue sections [7]. With ICC, most of the extracellular matrix and interstitial components are removed, leaving only isolated cells to be analyzed. For the conventional immunofluorescence analysis of single cells, ICC is generally used as it includes a cell isolation procedure. However, a comparison of the results between ICC and IHC may provide some insight into the differences between single cells and bulk tissue samples regarding the distribution of specific antigens. Another widely used method is fluorescence activated cell sorting (FACS). This method utilizes laser-induced fluorophores to count cells of interest based on antibody-antigen interaction. It has been reviewed elsewhere [8][9] and will not be discussed here. One critical limitation of antibody-based methods is that there must be antigen-specific binding between the target protein and antibody, which requires the rigorous testing of specificity [6].
Next-generation sequencing (NGS) has also proven to be a powerful tool in the analysis of single cells [10][11]. Whole genomes can be sequenced within a day and the increased sensitivity can lead to the detection of genetic alterations, such as somatic variants. In addition, RNA sequencing (RNA-Seq) can be used for the discovery of novel RNA variants and splice sites, as well as the quantification of mRNAs for gene expression analysis [12]. Single-cell RNA sequencing (scRNA-seq) allows for new biological discoveries, which otherwise would be unobtainable using traditional methods that analyze pooled bulk RNAs from tissues. These include the identification of rare cell types [13][14], gene regulatory networks inference [15][16][17], and cell type hierarchy reconstruction [18][19].
Mass spectrometry (MS) has been an essential tool for analyzing single cells [20][21]. Although it is the most powerful method for protein analysis, there have been challenges in its application to single cells. However, advances in simple, multiplexed, automated, and scaled-down sample preparation have opened doors for rapid analysis with high sensitivity. Along with single-cell proteomics, MS has also been used to identify and quantify metabolites and lipids at the single-cell level.
2. Label-Free Single-Cell Proteomic Analysis
Liquid chromatography tandem mass spectrometry analysis (LC-MS/MS) is one of the most effective methods in proteome profiling at the single-cell level. The rapid evolution of the LC-MS system over recent years has enabled label-free single-cell proteomic (SCP) analysis capable of identifying and quantifying more than 1000 proteins [22][23][24]. The current platforms for label-free SCP analysis were mainly developed with either Orbitrap or trapped ion mobility spectrometry time of flight (timsTOF) mass spectrometers. Cong et al. recently introduced an ultra-sensitive workflow that combines nanoPOTS (nanodroplet processing in one pot for trace samples), ultra-low flow liquid chromatography, and high field asymmetric ion mobility spectrometry (FAIMS) with an Orbitrap Eclipse Tribrid mass spectrometer [23]. The workflow enhanced the depth of single-cell proteome with 1056 identified proteins on average. Importantly, the employment of FAIMS has tripled the number of identified proteins compared to their previous research, indicating the critical contribution of ion mobility technology to the gas-phase separation [25]. The benefit of FAIMS was further elevated in a new method named transferring identification based on FAIMS filtering (TIFF) [24]. Besides the mass-to-charge ratio value (m/z) and the retention time, TIFF utilized the FAIMS compensation voltage (CV) as a third-dimensional characteristic of precursor ions for the peptide identification of single cells based on the match between run (MBR) algorithm. The efficiency of TIFF was demonstrated with the average of proteome coverage increased to over 1200 proteins. Together with FAIMS-Orbitrap mass spectrometer system, timsTOF mass spectrometer, with its remarkable sensitivity, has been used in several label-free SCP analyses [22][26]. Newly introduced timsTOF for single-cell proteomic analysis showed ten-fold increased sensitivity with the optimal setting, enabling the identification of 843 proteins on average in a single Hela cell [22].
Data dependent acquisition (DDA) is the most common scan mode in LC-MS/MS analysis [27][28][29][30][31]. DDA methods have been initially used for single cell proteomics analysis [23][25][32]. However, the DDA strategy only selects a small percent of precursors ion for tandem mass analysis, leading to low data completeness in numerous samples such as single cells. Data-independent acquisition (DIA) method recently gained attraction in label-free proteomics analysis on account of minimal missing values across replicates [33][34]. A new microfluid chip named SciProChip was developed for SCP analysis in DIA mode by Gebreyesus and his colleagues [35]. Applying SciProChip to DIA analysis resulted in the identification of approximately 1500 proteins on average from single cells with less than 16% missing values. In the timsTOF SCP, diaPASEF (parallel accumulation-serial fragmentation combined with data-independent acquisition) scan mode was established to maximize the number of precursor ions for tandem mass spectrometry [32]. This method has increased the number of quantifiable proteins (up to 2083) per single Hela cell with high completeness [22].
Although the proteome coverage in label-free SCP analysis remains low, several important cellular biological processes were observed. Proteome profiling from single PC9 cells showed several proteins involved in NSCLC pathways, such as EGFR, TP53, NRAS and MAPK [35]. In another research, proteins related to cell cycles were readily quantifiable in SCP data with several differentially expressed proteins upon drug treatment [32]. These results demonstrated the capability of using label-free SCP analysis in biological and clinical applications in the future.
3. TMT-Assisted Single-Cell Proteomics
Tandem mass tags (TMT) are isobaric chemicals used for the accurate and multiplexed quantification of peptides and proteins using tandem MS analysis (Figure 2) [29][36][37][38][39]. All multiple reagents of a typical TMT set have the same nominal mass and an identical chemical structure composed of a mass reporter, a mass normalizer, and an amine-reactive group (Figure 2a). Each mass reporter of the reagents contains stable isotopes distinctly configured in the chemical structure, thus having different masses from one another. For TMT-based multiplexed proteomics, digested peptides from different samples are labeled with TMT reagents (10, 16, or 18-plex [40]) and analyzed simultaneously by a single run of LC-MS/MS. The mass reporters are cleaved from the TMT-labeled peptides after fragmentation and distinguished based on their distinct masses specific to the samples. Their ion intensities measured in MS2 spectrum and corresponding peptide sequencing enables relative quantification of the peptides. Multiplexed analysis using TMT alleviates the variability of separate measurements, and the enhanced intensity of precursor ions, which are accumulated from identical TMT-labeled peptides of all samples, improves the quantification of proteins [41]. The labeling method with TMT detected changes in the number of low-abundance proteins available for hypothesis testing, showing higher precision and fewer missing values compared to a label-free quantitation method [42]. It should be noted that the accurate interpretation of TMT-based quantitative proteomic data requires minimizing false positives, batch effects, and missing values [43][44].
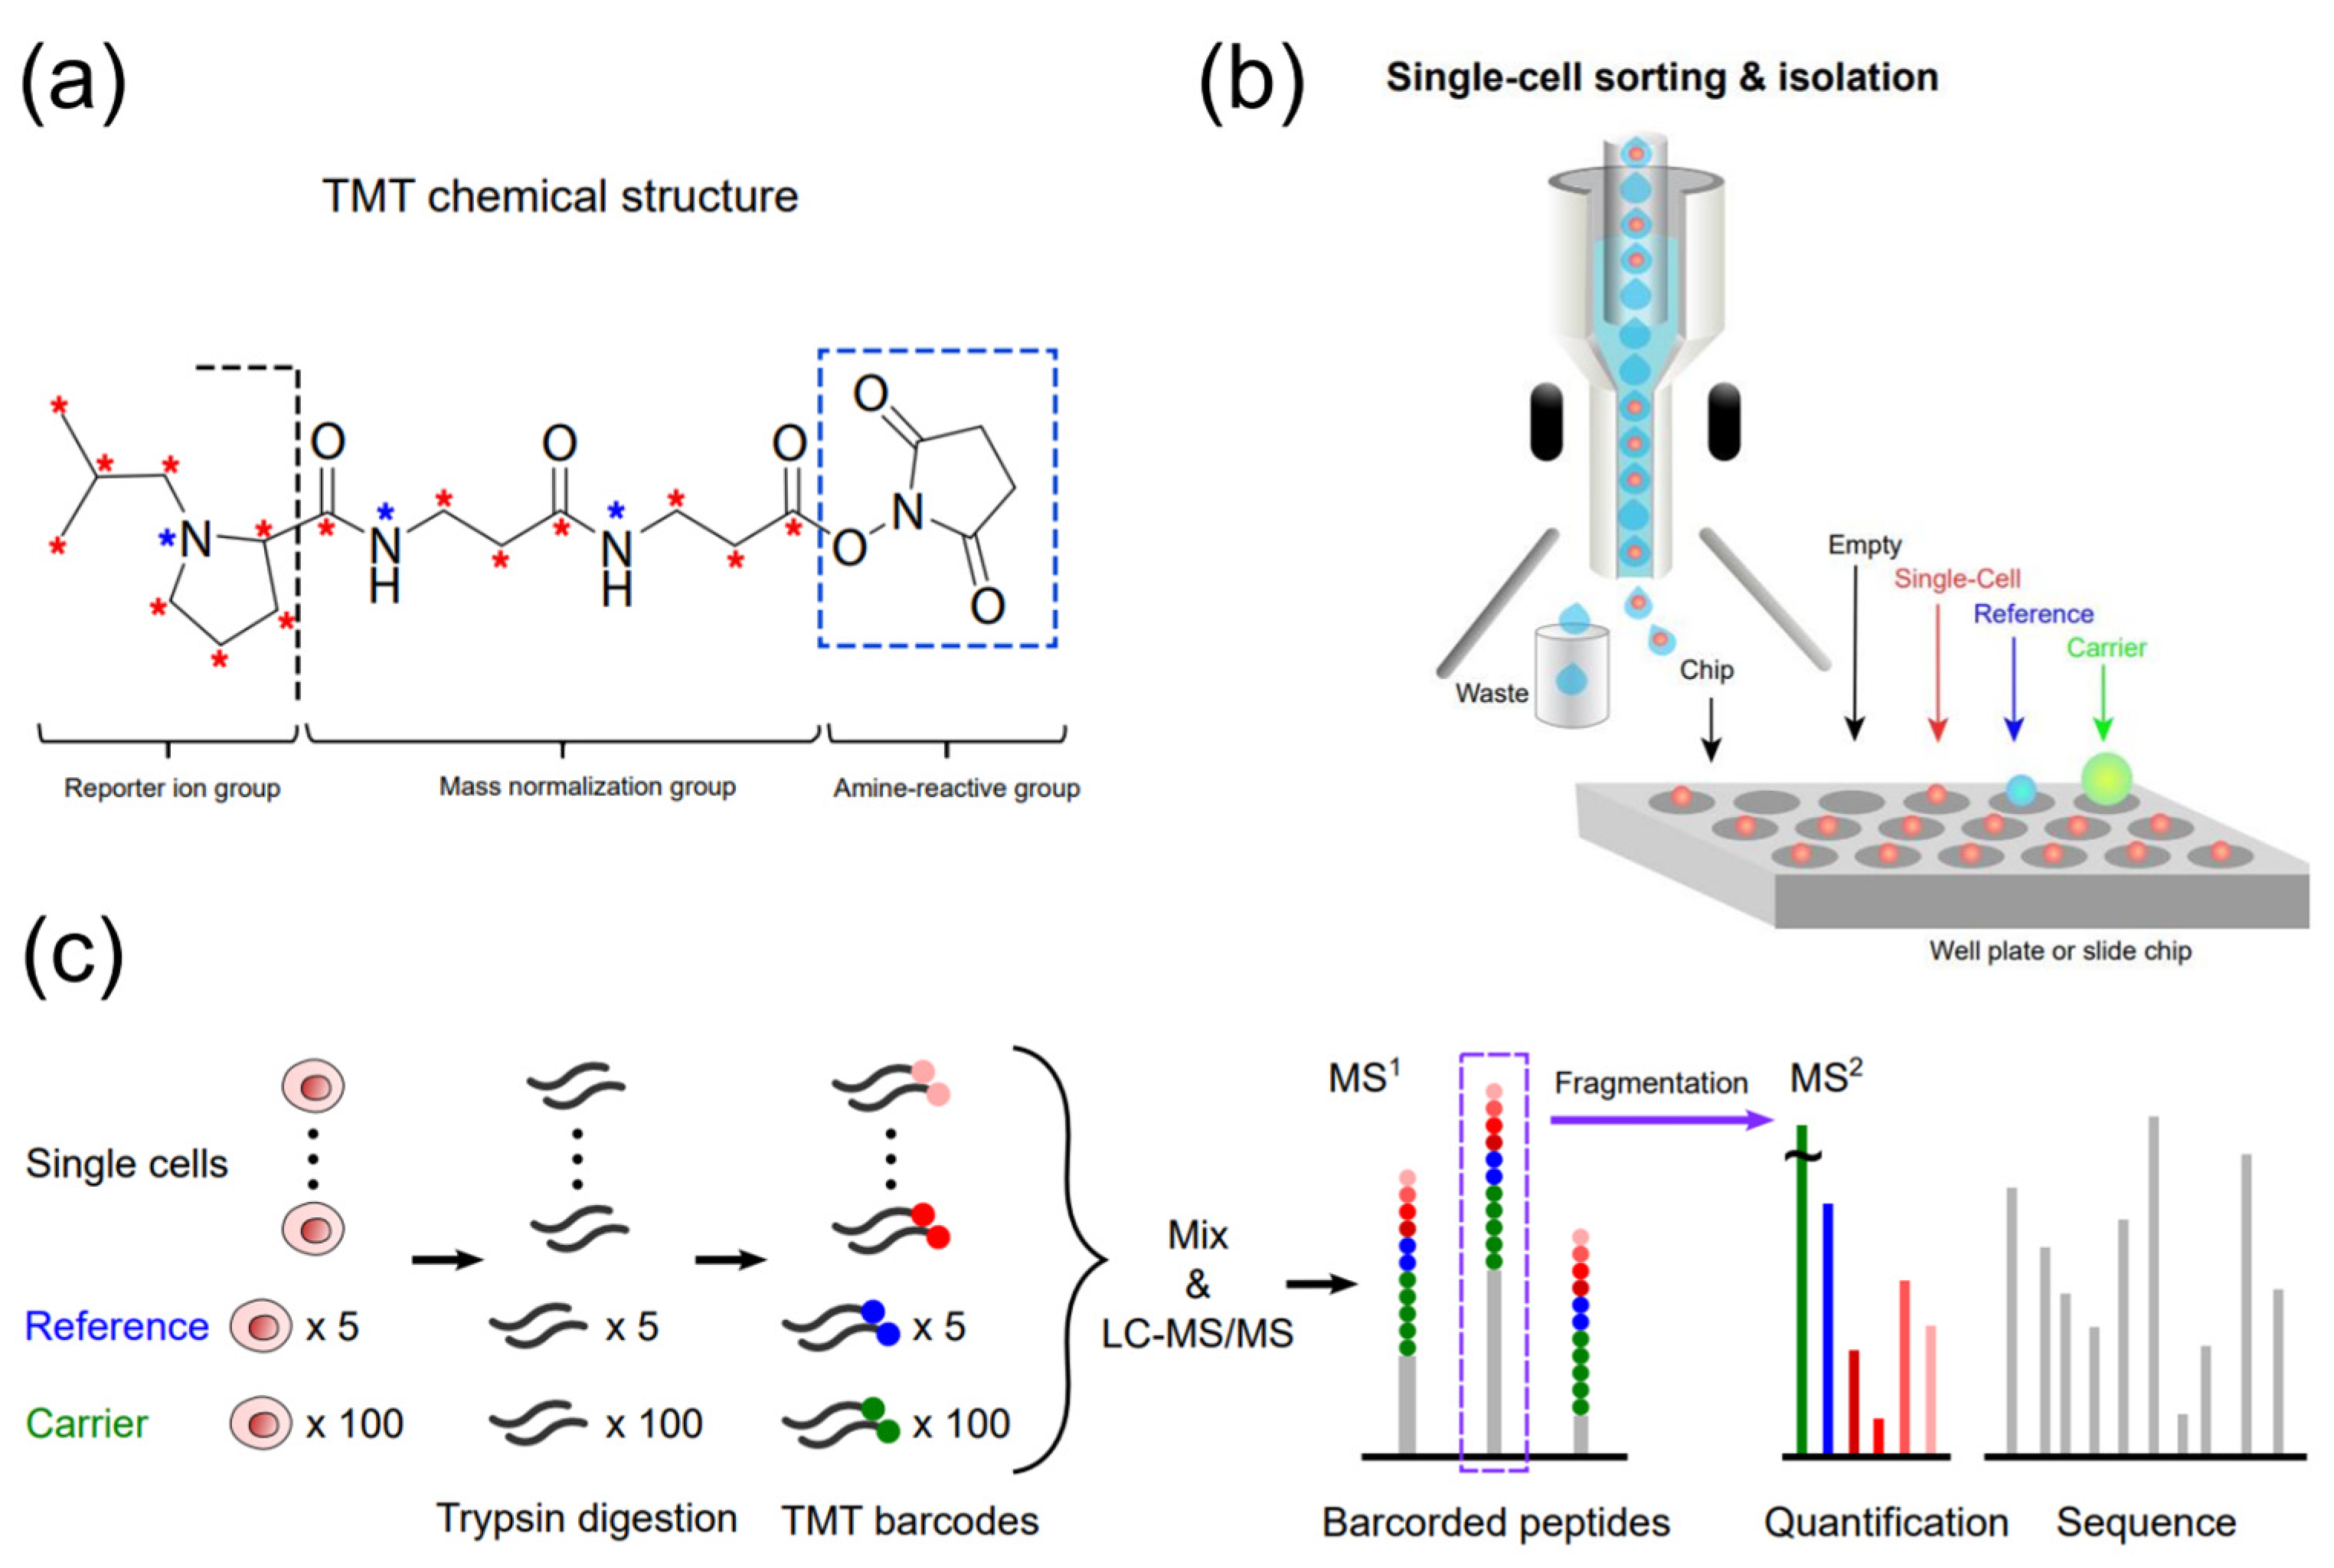
Figure 2. TMT-assisted single-cell proteomics. (a) The chemical structure of TMT (e.g., 18-plex), (b) Single-cell sorting and isolation onto a well plate or slide chip by FACS or a robotic system. (c) A typical workflow of single-cell proteomic analysis using TMT.
TMT-based multiplexing technologies are especially useful in large-scale proteomics at the single-cell level demanding high sensitivity and high throughput [45]. However, to confidently identify and quantify thousands of proteins in an individual cell, a limited amount of the samples should be delivered to LC-MS/MS instruments to the fullest. In efforts to minimize sample loss and increase sensitivity, various sample preparation methods have been suggested for reproducible proteomic analysis of low quantities [46][47][48]. Sample loss could be minimized by using organic cosolvents as alternatives to detergents, which circumvents cleaning and tube transferring steps [46], or by minimizing sample handling on a simplified nanoproteomics platform [47].
For TMT-assisted single-cell proteomics, Slavov’s group developed single cell proteomics by mass spectrometry (SCoPE-MS), where a set of hundreds of cells as a carrier is assigned to one TMT channel for labeling and analyzed together with the TMT-labeled proteomes of single cells (Figure 2b,c) [49][50]. The carrier sample with an ample number of proteins increases the signal of low-input samples such as single cells. This combination of samples reduces missing values during chromatographic separation and improves quantification. Cells were mechanically lysed by sonication in glass microtubes to minimize protein losses instead of using chemicals that may cause significant losses. A thousand proteins were quantified in single cells using SCoPE-MS, demonstrating the ability of ScoPE-MS to identify distinct cell types and study the relationship between mRNA and protein levels in single cell [49]. Their updated version of ScoPE-MS, ScoPE2, optimizes automated sample preparation and MS data analysis to further improve quantification and throughput with lower cost and hands-on time [51][52]. In ScoPE2, the minimal proteomic sample preparation (mPOP) method was introduced to lyse cells, which utilizes a freeze-heat cycle to extract proteins efficiently in pure water without a cleaning step [53]. mPOP preparing samples in multiwell plates enables parallel processing with reduced lysis volumes, thereby increasing sample throughput and reducing cost. They also developed methods for MS data acquisition optimization and data interpretation for peptide identification enhancement, improving quantification and proteome coverage. With such advances, SCoPE2 successfully quantified over 3042 proteins in 1490 single monocytes and macrophages, and the proteomic data analysis showed a gradient of heterogeneous proteome state of macrophages [51]. The workflow of SCoPE2 for multiplexed single-cell proteomics is described in detail elsewhere, enabling the analysis of ~200 single cells per 24 h with standard commercial equipment [52].
A nanoPOTS approach has been reported and combined with TMT labeling to boost processing efficiency and throughput for single-cell samples [54][55][56]. nanoPOTS is a chip-based processing platform for preparing small cell populations and utilizes a robotic system that performs picoliter-liquid dispensing and cell isolations (Figure 2b). The total processing volumes of a single droplet reactor decreased to less than 200 nanoliters. The sample then goes through evaluation, extraction/reduction, alkylation, Lys C digestion, trypsin digestion, surfactant cleavage, peptide collection, and TMT labeling, all within the same nanodroplet. This sample processing method could be performed in much smaller droplets and inside wall-less glass reactor of 1mm diameter (a total surface area of 0.8 mm2), corresponding to a ~99.5% reduction compared to a typical 0.5 mL sample tube (~130 mm2). nanoLC measurements of cultured Hela cells on the nanoPOTS platform with the match between runs (MBR) algorithm of MaxQuant [57] identified 3092 proteins from as little as ten cells [54]. Additionally, nanoPOTS outperformed vial-based preparation in peptide identifications by a 25-fold increase for ~10 cells, confirming its suitability with ultrasmall samples. Given the results from previous research showing that thousands of cells were needed for a proteome coverage of over 3000, high sensitivity MS measurement with a sample size of 10 cells is a noteworthy capability of nanoPOTS. Compared to the previous research showing that a proteome coverage of over 3000 required thousands of cells, high-sensitive MS measurement with a sample size of 10 cells by nanoPOTS made a significant breakthrough [58][59].
It has been further developed into a nested nanoPOTS (N2) for isobaric-labeling-based scProteomics with high sensitivity, successfully demonstrating reduced reaction volume, an increase in quantified proteins, and an increased number of single cells analyzed [60]. N2 chip consists of cluster arrays of nanowells to digest and label cells with TMT. Sample processing on the N2 chip facilitated TMT pooling and retrieval by adding a microliter droplet on clustered samples in one TMT set. Reducing the nanowell diameters from 1.2 mm to 0.5 mm, compared to the nanoPOTS chips, decreased total processing volume by 85% and facilitated the digestion kinetics of trypsin, augmenting the sensitivity and reproducibility of proteomics and resulting in 230% improved protein/peptide sample recovery. Another related innovation is an integrated proteomics chip (iProChip) that provides all-in-one functionality from cell input to complete proteomic sample processing [35].
One limitation of nanoPOTS is that it involves a specialized platform. The nanowells had to be fabricated by a photolithography-based microfabrication technique. In the experiment, a nanoliter-scale liquid handling system was home-built as well. In addition, most commercial LC autosamplers are incapable of sampling nanoPOTS-generated samples. As a result, the LC-MS measurements require procedures involving depressurizing/repressurizing the LC system and disconnecting/reconnecting high-pressure fittings. This manual operation is highly labor-intensive and requires extensive expertise to avoid leaks and achieve reproducible sample loading.
Currently, many single cell studies are utilizing nanoliter dispensers to isolate and prepare single cells [52][61]. There has been an increasing demand for a high-sensitive single-cell analysis platform, and such a tendency will continue. To maximize data acquisition from a set number of unicellular samples, an efficient sample processing platform is necessary to minimize sample loss and boost sensitivity [62]. nanoPOTS can provide such a high-performance platform for single-cell proteomics analysis with a limited number of cells. In addition, the open-space architecture of the nanowells opens opportunities for the additional incorporation of LC-MS platforms and isolation technologies, such as fluorescence-activated cell sorting (FACS) [35] and laser capture microdissection (LCM) [63]. Innovations are being made to address the drawbacks of nanoPOTS. In one case, an approach that involved prepopulating the nanowells with DMSO and integrating nanoPOTS with LCM increased spatial resolution, resolving some of the procedural issues of microsampling [64]. Other relevant examples could be the N2 chip and iProchip implementing an autosampler. With additional developments to make it commercially available, nanoPOTS may become the platform of choice for single cell omics.
The nanodroplet platform can be efficiently applied to various single-cell studies although quantities of sample material are limited. Thus, the methods could be applied to proteomic studies of circulating tumor cells [65], stem cell development [66], high-level cellular heterogeneity [67], and biomarkers of disease [68].
4. CyTOF for Single-Cell Proteomics
Cytometry by time-of-flight (CyTOF) (Figure 3), or mass cytometry, is a variation of flow cytometry. Flow cytometry is a widely used immune profiling method in which a sample of cells is labeled with fluorescent markers and examined using a laser beam [69][70][71]. Each cell from the sample flows in a row through the laser excitation region, where multiple fluorescent markers of the single cells are measured simultaneously, and the fluorescence intensities represent a proxy of the expression level of the targeted antigens. Despite a high-throughput method used to analyze or quantify multiple cellular features at the single-cell level, there are limitations with flow cytometry. Fluorescence measurements often create spectral overlap and require compensation, limiting the number of parameters that can be measured together [72].
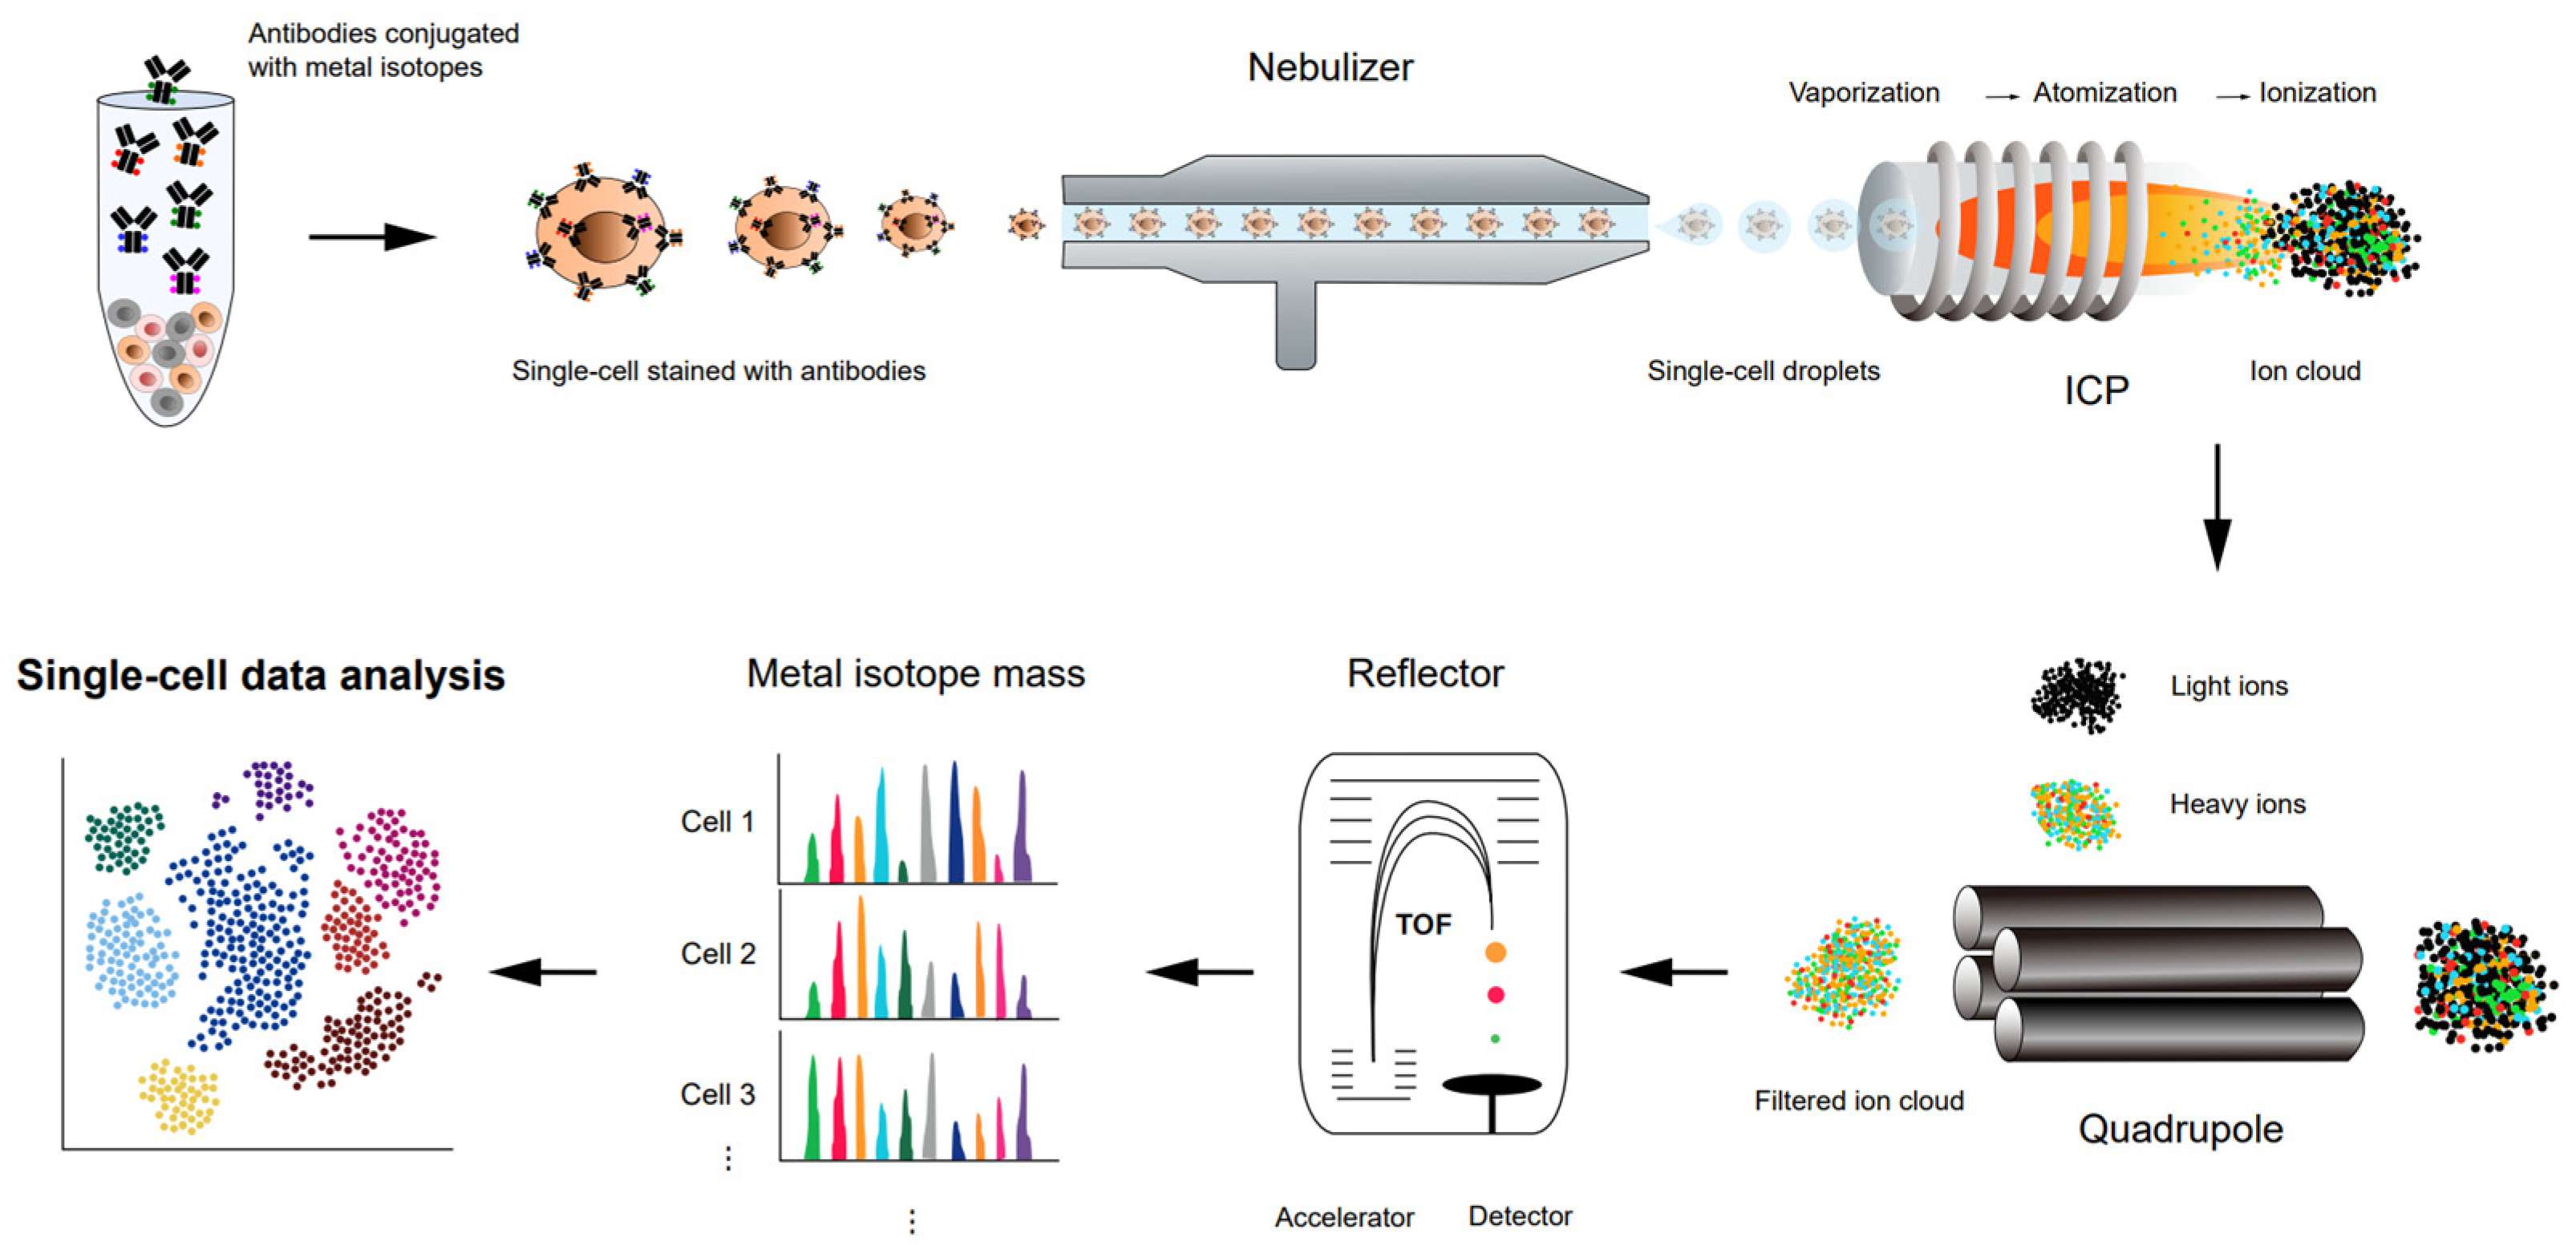
Figure 3. Schematic representation of a workflow of high-throughput single-cell proteomics analysis using CyTOF.
CyTOF resolves the overlapping spectral issue by replacing fluorescent probes with stable heavy-metal isotopes and combining flow cytometry with high-precision mass spectrometry to increase the number of cellular parameters to be quantified simultaneously. Such advances in mass cytometry provide insight into the cell subpopulations of complex cellular systems and their distinct functions [73]. The principles, workflow, and data processing of a novel CyTOF instrument are explained in detail elsewhere [73][74]. In CyTOF, single cells are isolated from a biological system and pooled in one tube. Target proteins are labeled with antibodies, each of which is conjugated with distinct heavy-metal isotopes from the lanthanide series not found in biological samples [75]. The labeled cells are nebulized into droplets and then directed into an inductively coupled plasma, which breaks the covalent bonds, producing heavy metal ions and small mass ions with masses below 75 Da. By filtering these small biological ions through a quadrupole, only the heavy metal ions will be introduced to a time-of-flight (TOF) mass spectrometry. With TOF analysis, the mass-to-charge ratio (m/z) of an ion is determined by the time it takes the ion to travel through and reach the end of the flight tube. Compared to fluorescent-based flow cytometry, the high mass resolution of CyTOF reduces spectral overlap between different metal ions, enabling high dimensional analysis of over 40 simultaneous cellular parameters for millions of single cells from a sample. Automated data analysis algorithms have been developed for CyTOF to aid in cell-subset clustering and phenotyping to provide biological insights [76][77][78]. Recently, CyTOF has been expanded into high-dimensional imaging techniques, imaging mass cytometry (IMC) (Figure 4a), with subcellular resolution by combining laser ablation to gain spatial information in tissues or cells stained with metal-tagged antibodies [79]. Basic principles, experimental workflows, and applications of IMC are explained in detail elsewhere [80][81]. One of the limitations of CyTOF as an antibody-based method is that it heavily relies on the availability and specificity of antibodies that bind to proteins of interest, which demands thorough validation of antibodies for a reliable analysis [82]. High-throughput analysis for single cells with high-dimensional information, including viability, cell morphologies, proteins, and even mRNA transcripts [83], makes CyTOF a powerful analytical technique to address biological questions in many applications, such as broad-scale immune profiling [84][85][86], T and NK cell subtyping [87][88][89], therapeutic responses [75][90], antiviral T cell response [91][92][93], biomarker discovery for diseases [94][95][96][97], and patient profiling involving COVID-19 [98][99]. CyTOF can also help to analyze the cellular heterogeneity related to clinical trials [100][101][102], autoimmune disorders [103][104][105], and cancers [106][107][108]. Researchers will further discuss the current applications of CyTOF in the section on the application of single-cell proteomics.
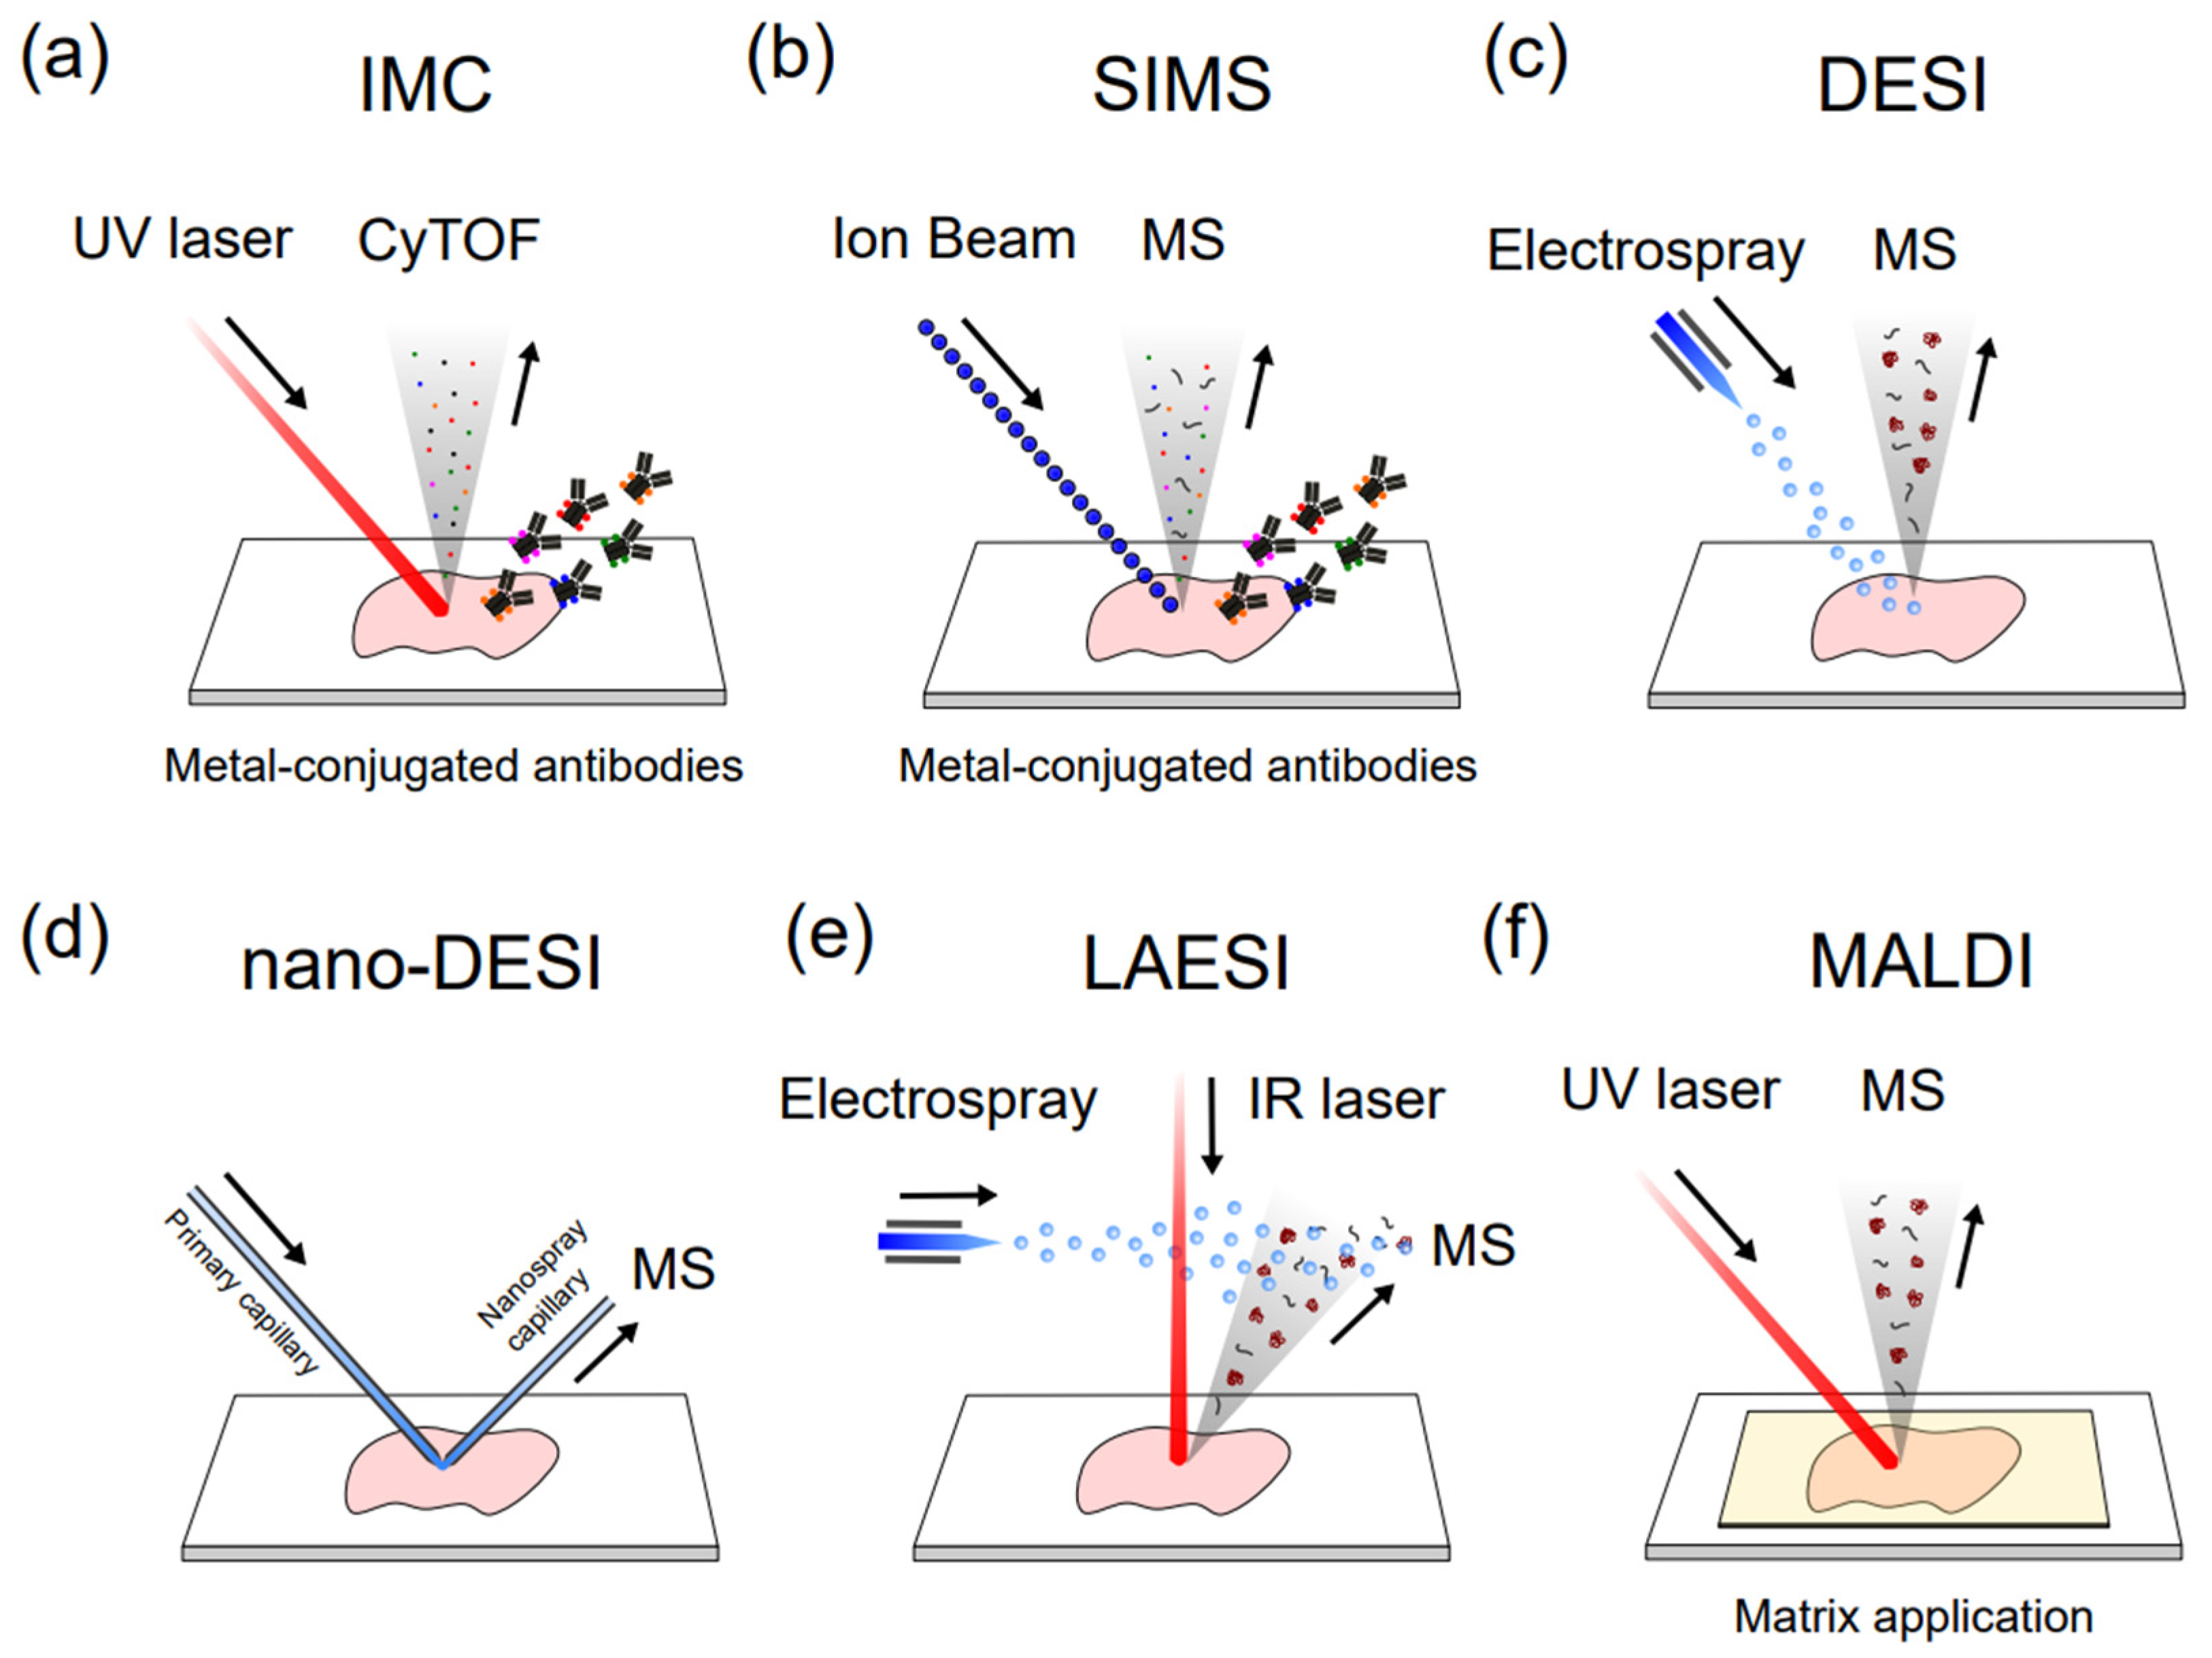
Figure 4. Different single-cell MSI methods. (a) Imaging mass cytometry (IMC); (b) Secondary ion mass spectrometry (SIMS); (c) Desorption electrospray ionization (DESI); (d) nanospray-DESI (nano-DESI); (e) Laser ablation electrospray ionization (LAESI); (f) Matrix-assisted laser desorption/ionization.
This entry is adapted from the peer-reviewed paper 10.3390/biology12030395
References
- Elsasser, W.M. Outline of a theory of cellular heterogeneity. Proc. Natl. Acad. Sci. USA 1984, 81, 5126–5129.
- Buettner, F.; Natarajan, K.N.; Casale, F.P.; Proserpio, V.; Scialdone, A.; Theis, F.J.; Teichmann, S.A.; Marioni, J.C.; Stegle, O. Computational analysis of cell-to-cell heterogeneity in single-cell RNA-sequencing data reveals hidden subpopulations of cells. Nat. Biotechnol. 2015, 33, 155–160.
- Slavov, N. Unpicking the proteome in single cells. Science 2020, 367, 512–513.
- Xie, H.; Ding, X. The Intriguing Landscape of Single-Cell Protein Analysis. Adv. Sci. 2022, 9, 2105932.
- Larsson, L.-I. Immunocytochemistry: Theory and Practice; CRC Press: Boca Raton, FL, USA, 1988.
- Burry, R.W. Controls for Immunocytochemistry. J. Histochem. Cytochem. 2011, 59, 6–12.
- Ramos-Vara, J.A. Technical Aspects of Immunohistochemistry. Vet. Pathol. 2005, 42, 405–426.
- Herzenberg, L.A.; De Rosa, S.C.; Herzenberg, L.A. Monoclonal antibodies and the FACS: Complementary tools for immunobiology and medicine. Immunol. Today 2000, 21, 383–390.
- Herzenberg, L.A.; Parks, D.; Sahaf, B.; Perez, O.; Roederer, M.; Herzenberg, L.A. The history and future of the fluorescence activated cell sorter and flow cytometry: A view from Stanford. Clin. Chem. 2002, 48, 1819–1827.
- Kolodziejczyk, A.A.; Kim, J.K.; Svensson, V.; Marioni, J.C.; Teichmann, S.A. The technology and biology of single-cell RNA sequencing. Mol. Cell 2015, 58, 610–620.
- Hwang, B.; Lee, J.H.; Bang, D. Single-cell RNA sequencing technologies and bioinformatics pipelines. Exp. Mol. Med. 2018, 50, 1–14.
- Conesa, A.; Madrigal, P.; Tarazona, S.; Gomez-Cabrero, D.; Cervera, A.; McPherson, A.; Szcześniak, M.W.; Gaffney, D.J.; Elo, L.L.; Zhang, X.; et al. A survey of best practices for RNA-seq data analysis. Genome Biol. 2016, 17, 13.
- Jindal, A.; Gupta, P.; Jayadeva; Sengupta, D. Discovery of rare cells from voluminous single cell expression data. Nat. Commun. 2018, 9, 4719.
- Wegmann, R.; Neri, M.; Schuierer, S.; Bilican, B.; Hartkopf, H.; Nigsch, F.; Mapa, F.; Waldt, A.; Cuttat, R.; Salick, M.R.; et al. CellSIUS provides sensitive and specific detection of rare cell populations from complex single-cell RNA-seq data. Genome Biol. 2019, 20, 142.
- Pratapa, A.; Jalihal, A.P.; Law, J.N.; Bharadwaj, A.; Murali, T.M. Benchmarking algorithms for gene regulatory network inference from single-cell transcriptomic data. Nat. Methods 2020, 17, 147–154.
- Jackson, C.A.; Castro, D.M.; Saldi, G.-A.; Bonneau, R.; Gresham, D. Gene regulatory network reconstruction using single-cell RNA sequencing of barcoded genotypes in diverse environments. eLife 2020, 9, e51254.
- Iacono, G.; Massoni-Badosa, R.; Heyn, H. Single-cell transcriptomics unveils gene regulatory network plasticity. Genome Biol. 2019, 20, 110.
- Tirosh, I.; Venteicher, A.S.; Hebert, C.; Escalante, L.E.; Patel, A.P.; Yizhak, K.; Fisher, J.M.; Rodman, C.; Mount, C.; Filbin, M.G.; et al. Single-cell RNA-seq supports a developmental hierarchy in human oligodendroglioma. Nature 2016, 539, 309–313.
- Wu, Z.; Wu, H. Accounting for cell type hierarchy in evaluating single cell RNA-seq clustering. Genome Biol. 2020, 21, 123.
- Tajik, M.; Baharfar, M.; Donald, W.A. Single-cell mass spectrometry. Trends Biotechnol. 2022, 40, 1374–1392.
- Yin, L.; Zhang, Z.; Liu, Y.; Gao, Y.; Gu, J. Recent advances in single-cell analysis by mass spectrometry. Analyst 2019, 144, 824–845.
- Brunner, A.D.; Thielert, M.; Vasilopoulou, C.; Ammar, C.; Coscia, F.; Mund, A.; Hoerning, O.B.; Bache, N.; Apalategui, A.; Lubeck, M.; et al. Ultra-high sensitivity mass spectrometry quantifies single-cell proteome changes upon perturbation. Mol. Syst. Biol. 2022, 18, e10798.
- Cong, Y.; Motamedchaboki, K.; Misal, S.A.; Liang, Y.; Guise, A.J.; Truong, T.; Huguet, R.; Plowey, E.D.; Zhu, Y.; Lopez-Ferrer, D.; et al. Ultrasensitive single-cell proteomics workflow identifies >1000 protein groups per mammalian cell. Chem. Sci. 2020, 12, 1001–1006.
- Woo, J.; Clair, G.C.; Williams, S.M.; Feng, S.; Tsai, C.F.; Moore, R.J.; Chrisler, W.B.; Smith, R.D.; Kelly, R.T.; Paša-Tolić, L.; et al. Three-dimensional feature matching improves coverage for single-cell proteomics based on ion mobility filtering. Cell Syst. 2022, 13, 426–434.e424.
- Cong, Y.; Liang, Y.; Motamedchaboki, K.; Huguet, R.; Truong, T.; Zhao, R.; Shen, Y.; Lopez-Ferrer, D.; Zhu, Y.; Kelly, R.T. Improved Single-Cell Proteome Coverage Using Narrow-Bore Packed NanoLC Columns and Ultrasensitive Mass Spectrometry. Anal. Chem. 2020, 92, 2665–2671.
- Kalxdorf, M.; Müller, T.; Stegle, O.; Krijgsveld, J. IceR improves proteome coverage and data completeness in global and single-cell proteomics. Nat. Commun. 2021, 12, 4787.
- Michalski, A.; Cox, J.; Mann, M. More than 100,000 detectable peptide species elute in single shotgun proteomics runs but the majority is inaccessible to data-dependent LC-MS/MS. J. Proteome Res. 2011, 10, 1785–1793.
- Kim, M.S.; Pinto, S.M.; Getnet, D.; Nirujogi, R.S.; Manda, S.S.; Chaerkady, R.; Madugundu, A.K.; Kelkar, D.S.; Isserlin, R.; Jain, S.; et al. A draft map of the human proteome. Nature 2014, 509, 575–581.
- Jang, W.E.; Park, J.H.; Park, G.; Bang, G.; Na, C.H.; Kim, J.Y.; Kim, K.Y.; Kim, K.P.; Shin, C.Y.; An, J.Y.; et al. Cntnap2-dependent molecular networks in autism spectrum disorder revealed through an integrative multi-omics analysis. Mol. Psychiatry 2023, 28, 810–821.
- Mohammad, H.B.; Park, J.H.; Lee, J.H.; Vu, M.H.; Lee, J.-Y.; Jeong, W.-H.; Kim, M.-S. Comprehensive identification of VX-adducted plasma proteins using high-resolution mass spectrometry. Bull. Korean Chem. Soc. 2022, 43, 1217–1222.
- Lee, J.H.; Jang, W.E.; Park, J.H.; Mohammad, H.B.; Lee, J.-Y.; Jeong, W.-H.; Kim, M.-S. Identification of organophosphate modifications by high-resolution mass spectrometry. Bull. Korean Chem. Soc. 2022, 43, 444–449.
- Meier, F.; Brunner, A.-D.; Frank, M.; Ha, A.; Bludau, I.; Voytik, E.; Kaspar-Schoenefeld, S.; Lubeck, M.; Raether, O.; Bache, N.; et al. diaPASEF: Parallel accumulation–serial fragmentation combined with data-independent acquisition. Nat. Methods 2020, 17, 1229–1236.
- Gillet, L.C.; Navarro, P.; Tate, S.; Röst, H.; Selevsek, N.; Reiter, L.; Bonner, R.; Aebersold, R. Targeted data extraction of the MS/MS spectra generated by data-independent acquisition: A new concept for consistent and accurate proteome analysis. Mol. Cell. Proteom. 2012, 11, O111.016717.
- Röst, H.L.; Malmström, L.; Aebersold, R. Reproducible quantitative proteotype data matrices for systems biology. Mol. Biol. Cell 2015, 26, 3926–3931.
- Gebreyesus, S.T.; Siyal, A.A.; Kitata, R.B.; Chen, E.S.; Enkhbayar, B.; Angata, T.; Lin, K.I.; Chen, Y.J.; Tu, H.L. Streamlined single-cell proteomics by an integrated microfluidic chip and data-independent acquisition mass spectrometry. Nat. Commun. 2022, 13, 37.
- Thompson, A.; Schäfer, J.; Kuhn, K.; Kienle, S.; Schwarz, J.; Schmidt, G.; Neumann, T.; Hamon, C. Tandem mass tags: A novel quantification strategy for comparative analysis of complex protein mixtures by MS/MS. Anal. Chem. 2003, 75, 1895–1904.
- Ross, P.L.; Huang, Y.N.; Marchese, J.N.; Williamson, B.; Parker, K.; Hattan, S.; Khainovski, N.; Pillai, S.; Dey, S.; Daniels, S. Multiplexed protein quantitation in Saccharomyces cerevisiae using amine-reactive isobaric tagging reagents. Mol. Cell. Proteom. 2004, 3, 1154–1169.
- Park, J.H.; Ryu, S.J.; Kim, B.J.; Cho, H.J.; Park, C.H.; Choi, H.J.C.; Jang, E.J.; Yang, E.J.; Hwang, J.A.; Woo, S.H.; et al. Disruption of nucleocytoplasmic trafficking as a cellular senescence driver. Exp. Mol. Med. 2021, 53, 1092–1108.
- Hyeon, D.Y.; Nam, D.; Han, Y.; Kim, D.K.; Kim, G.; Kim, D.; Bae, J.; Back, S.; Mun, D.G.; Madar, I.H.; et al. Proteogenomic landscape of human pancreatic ductal adenocarcinoma in an Asian population reveals tumor cell-enriched and immune-rich subtypes. Nat. Cancer 2022, 4, 290–307.
- Li, J.; Cai, Z.; Bomgarden, R.D.; Pike, I.; Kuhn, K.; Rogers, J.C.; Roberts, T.M.; Gygi, S.P.; Paulo, J.A. TMTpro-18plex: The expanded and complete set of TMTpro reagents for sample multiplexing. J. Proteome Res. 2021, 20, 2964–2972.
- Isasa, M.; Rose, C.M.; Elsasser, S.; Navarrete-Perea, J.; Paulo, J.A.; Finley, D.J.; Gygi, S.P. Multiplexed, proteome-wide protein expression profiling: Yeast deubiquitylating enzyme knockout strains. J. Proteome Res. 2015, 14, 5306–5317.
- O’Connell, J.D.; Paulo, J.A.; O’Brien, J.J.; Gygi, S.P. Proteome-Wide Evaluation of Two Common Protein Quantification Methods. J. Proteome Res. 2018, 17, 1934–1942.
- Brenes, A.; Hukelmann, J.; Bensaddek, D.; Lamond, A.I. Multibatch TMT Reveals False Positives, Batch Effects and Missing Values. Mol. Cell. Proteom. 2019, 18, 1967–1980.
- Hamood, F.; Bayer, F.P.; Wilhelm, M.; Kuster, B.; The, M. SIMSI-Transfer: Software-assisted reduction of missing values in phosphoproteomic and proteomic isobaric labeling data using tandem mass spectrum clustering. Mol. Cell. Proteom. 2022, 21, 100238.
- Kelly, R.T. Single-cell Proteomics: Progress and Prospects. Mol. Cell. Proteom. 2020, 19, 1739–1748.
- Wang, H.; Qian, W.-J.; Mottaz, H.M.; Clauss, T.R.W.; Anderson, D.J.; Moore, R.J.; Camp, D.G.; Khan, A.H.; Sforza, D.M.; Pallavicini, M.; et al. Development and Evaluation of a Micro- and Nanoscale Proteomic Sample Preparation Method. J. Proteome Res. 2005, 4, 2397–2403.
- Huang, E.L.; Piehowski, P.D.; Orton, D.J.; Moore, R.J.; Qian, W.-J.; Casey, C.P.; Sun, X.; Dey, S.K.; Burnum-Johnson, K.E.; Smith, R.D. SNaPP: Simplified Nanoproteomics Platform for Reproducible Global Proteomic Analysis of Nanogram Protein Quantities. Endocrinology 2016, 157, 1307–1314.
- Chen, Q.; Yan, G.; Gao, M.; Zhang, X. Ultrasensitive Proteome Profiling for 100 Living Cells by Direct Cell Injection, Online Digestion and Nano-LC-MS/MS Analysis. Anal. Chem. 2015, 87, 6674–6680.
- Budnik, B.; Levy, E.; Harmange, G.; Slavov, N. SCoPE-MS: Mass spectrometry of single mammalian cells quantifies proteome heterogeneity during cell differentiation. Genome Biol. 2018, 19, 161.
- Slavov, N. Single-cell protein analysis by mass spectrometry. Curr. Opin. Chem. Biol. 2021, 60, 1–9.
- Specht, H.; Emmott, E.; Petelski, A.A.; Huffman, R.G.; Perlman, D.H.; Serra, M.; Kharchenko, P.; Koller, A.; Slavov, N. Single-cell proteomic and transcriptomic analysis of macrophage heterogeneity using SCoPE2. Genome Biol. 2021, 22, 50.
- Petelski, A.A.; Emmott, E.; Leduc, A.; Huffman, R.G.; Specht, H.; Perlman, D.H.; Slavov, N. Multiplexed single-cell proteomics using SCoPE2. Nat. Protoc. 2021, 16, 5398–5425.
- Specht, H.; Harmange, G.; Perlman, D.H.; Emmott, E.; Niziolek, Z.; Budnik, B.; Slavov, N. Automated sample preparation for high-throughput single-cell proteomics. bioRxiv 2018, 399774.
- Zhu, Y.; Piehowski, P.D.; Zhao, R.; Chen, J.; Shen, Y.; Moore, R.J.; Shukla, A.K.; Petyuk, V.A.; Campbell-Thompson, M.; Mathews, C.E.; et al. Nanodroplet processing platform for deep and quantitative proteome profiling of 10–100 mammalian cells. Nat. Commun. 2018, 9, 882.
- Dou, M.; Clair, G.; Tsai, C.F.; Xu, K.; Chrisler, W.B.; Sontag, R.L.; Zhao, R.; Moore, R.J.; Liu, T.; Pasa-Tolic, L.; et al. High-Throughput Single Cell Proteomics Enabled by Multiplex Isobaric Labeling in a Nanodroplet Sample Preparation Platform. Anal. Chem. 2019, 91, 13119–13127.
- Williams, S.M.; Liyu, A.V.; Tsai, C.-F.; Moore, R.J.; Orton, D.J.; Chrisler, W.B.; Gaffrey, M.J.; Liu, T.; Smith, R.D.; Kelly, R.T.; et al. Automated Coupling of Nanodroplet Sample Preparation with Liquid Chromatography–Mass Spectrometry for High-Throughput Single-Cell Proteomics. Anal. Chem. 2020, 92, 10588–10596.
- Tyanova, S.; Temu, T.; Cox, J. The MaxQuant computational platform for mass spectrometry-based shotgun proteomics. Nat. Protoc. 2016, 11, 2301–2319.
- Waanders, L.F.; Chwalek, K.; Monetti, M.; Kumar, C.; Lammert, E.; Mann, M. Quantitative proteomic analysis of single pancreatic islets. Proc. Natl. Acad. Sci. USA 2009, 106, 18902–18907.
- Wiśniewski, J.R.; Ostasiewicz, P.; Mann, M. High Recovery FASP Applied to the Proteomic Analysis of Microdissected Formalin Fixed Paraffin Embedded Cancer Tissues Retrieves Known Colon Cancer Markers. J. Proteome Res. 2011, 10, 3040–3049.
- Woo, J.; Williams, S.M.; Markillie, L.M.; Feng, S.; Tsai, C.F.; Aguilera-Vazquez, V.; Sontag, R.L.; Moore, R.J.; Hu, D.; Mehta, H.S.; et al. High-throughput and high-efficiency sample preparation for single-cell proteomics using a nested nanowell chip. Nat. Commun. 2021, 12, 6246.
- Gross, A.; Schoendube, J.; Zimmermann, S.; Steeb, M.; Zengerle, R.; Koltay, P. Technologies for Single-Cell Isolation. Int. J. Mol. Sci. 2015, 16, 16897–16919.
- Kassem, S.; van der Pan, K.; de Jager, A.L.; Naber, B.A.E.; de Laat, I.F.; Louis, A.; van Dongen, J.J.M.; Teodosio, C.; Díez, P. Proteomics for Low Cell Numbers: How to Optimize the Sample Preparation Workflow for Mass Spectrometry Analysis. J. Proteome Res. 2021, 20, 4217–4230.
- Swensen, A.C.; Veličković, D.; Williams, S.M.; Moore, R.J.; Day, L.Z.; Niessen, S.; Hennessy, S.; Posso, C.; Monetti, M.; Qian, W.-J.; et al. Proteomic Profiling of Intra-Islet Features Reveals Substructure-Specific Protein Signatures. Mol. Cell. Proteom. 2022, 21, 100426.
- Zhu, Y.; Dou, M.; Piehowski, P.D.; Liang, Y.; Wang, F.; Chu, R.K.; Chrisler, W.B.; Smith, J.N.; Schwarz, K.C.; Shen, Y.; et al. Spatially Resolved Proteome Mapping of Laser Capture Microdissected Tissue with Automated Sample Transfer to Nanodroplets. Mol. Cell. Proteom. 2018, 17, 1864–1874.
- Song, Y.; Tian, T.; Shi, Y.; Liu, W.; Zou, Y.; Khajvand, T.; Wang, S.; Zhu, Z.; Yang, C. Enrichment and single-cell analysis of circulating tumor cells. Chem. Sci. 2017, 8, 1736–1751.
- Schoof, E.M.; Furtwängler, B.; Üresin, N.; Rapin, N.; Savickas, S.; Gentil, C.; Lechman, E.; Dick, J.E.; Porse, B.T. Quantitative single-cell proteomics as a tool to characterize cellular hierarchies. Nat. Commun. 2021, 12, 3341.
- Zhang, L.; Vertes, A. Single-Cell Mass Spectrometry Approaches to Explore Cellular Heterogeneity. Angew. Chem. Int. Ed. 2018, 57, 4466–4477.
- Russell, C.L.; Heslegrave, A.; Mitra, V.; Zetterberg, H.; Pocock, J.M.; Ward, M.A.; Pike, I. Combined tissue and fluid proteomics with Tandem Mass Tags to identify low-abundance protein biomarkers of disease in peripheral body fluid: An Alzheimer’s Disease case study. Rapid Commun. Mass Spectrom. 2017, 31, 153–159.
- McKinnon, K.M. Flow Cytometry: An Overview. Curr. Protoc. Immunol. 2018, 120, 5.1.1–5.1.11.
- Adan, A.; Alizada, G.; Kiraz, Y.; Baran, Y.; Nalbant, A. Flow cytometry: Basic principles and applications. Crit. Rev. Biotechnol. 2017, 37, 163–176.
- Hoffman, R.A. Flow Cytometry: Instrumentation, Applications, Future Trends and Limitations; Springer: Berlin/Heidelberg, Germany, 2008; Volume 6, pp. 307–342.
- Roederer, M. Spectral compensation for flow cytometry: Visualization artifacts, limitations, and caveats. Cytometry 2001, 45, 194–205.
- Garry, M. Mass Cytometry: Single Cells, Many Features. Cell 2016, 165, 780–791.
- Nowicka, M.; Krieg, C.; Weber, L.M.; Hartmann, F.J.; Guglietta, S.; Becher, B.; Levesque, M.P.; Robinson, M.D. CyTOF workflow: Differential discovery in high-throughput high-dimensional cytometry datasets. F1000Research 2017, 6, 748.
- Bendall, S.C.; Simonds, E.F.; Qiu, P.; Amir el, A.D.; Krutzik, P.O.; Finck, R.; Bruggner, R.V.; Melamed, R.; Trejo, A.; Ornatsky, O.I.; et al. Single-cell mass cytometry of differential immune and drug responses across a human hematopoietic continuum. Science 2011, 332, 687–696.
- Samusik, N.; Good, Z.; Spitzer, M.H.; Davis, K.L.; Nolan, G.P. Automated mapping of phenotype space with single-cell data. Nat. Methods 2016, 13, 493–496.
- Zhang, Z.; Luo, D.; Zhong, X.; Choi, J.H.; Ma, Y.; Wang, S.; Mahrt, E.; Guo, W.; Stawiski, E.W.; Modrusan, Z.; et al. SCINA: A Semi-Supervised Subtyping Algorithm of Single Cells and Bulk Samples. Genes 2019, 10, 531.
- Li, S.K.H.; Majonis, D.; Bagwell, C.B.; Hunsberger, B.C.; Baranov, V.; Ornatsky, O. A robust human immunophenotyping workflow using CyTOF technology coupled with Maxpar Pathsetter, an automated data analysis software. J. Immunol. 2019, 202, 131.2.
- Giesen, C.; Wang, H.A.; Schapiro, D.; Zivanovic, N.; Jacobs, A.; Hattendorf, B.; Schüffler, P.J.; Grolimund, D.; Buhmann, J.M.; Brandt, S. Highly multiplexed imaging of tumor tissues with subcellular resolution by mass cytometry. Nat. Methods 2014, 11, 417–422.
- Chang, Q.; Ornatsky, O.I.; Siddiqui, I.; Loboda, A.; Baranov, V.I.; Hedley, D.W. Imaging mass cytometry. Cytom. Part A 2017, 91, 160–169.
- Baharlou, H.; Canete, N.P.; Cunningham, A.L.; Harman, A.N.; Patrick, E. Mass Cytometry Imaging for the Study of Human Diseases—Applications and Data Analysis Strategies. Front. Immunol. 2019, 10, 2657.
- Olsen, L.R.; Leipold, M.D.; Pedersen, C.B.; Maecker, H.T. The anatomy of single cell mass cytometry data. Cytom. Part A 2019, 95, 156–172.
- Frei, A.P.; Bava, F.-A.; Zunder, E.R.; Hsieh, E.W.; Chen, S.-Y.; Nolan, G.P.; Gherardini, P.F. Highly multiplexed simultaneous detection of RNAs and proteins in single cells. Nat. Methods 2016, 13, 269–275.
- Bandura, D.R.; Baranov, V.I.; Ornatsky, O.I.; Antonov, A.; Kinach, R.; Lou, X.; Pavlov, S.; Vorobiev, S.; Dick, J.E.; Tanner, S.D. Mass Cytometry: Technique for Real Time Single Cell Multitarget Immunoassay Based on Inductively Coupled Plasma Time-of-Flight Mass Spectrometry. Anal. Chem. 2009, 81, 6813–6822.
- Sahaf, B.; Rahman, A.; Maecker, H.T.; Bendall, S.C. High-Parameter Immune Profiling with CyTOF. In Biomarkers for Immunotherapy of Cancer. Methods in Molecular Biology; Humana: New York, NY, USA, 2020; Volume 2055, pp. 351–368.
- Bjornson, Z.B.; Nolan, G.P.; Fantl, W.J. Single-cell mass cytometry for analysis of immune system functional states. Curr. Opin. Immunol. 2013, 25, 484–494.
- Horowitz, A.; Strauss-Albee, D.M.; Leipold, M.; Kubo, J.; Nemat-Gorgani, N.; Dogan, O.C.; Dekker, C.L.; Mackey, S.; Maecker, H.; Swan, G.E.; et al. Genetic and environmental determinants of human NK cell diversity revealed by mass cytometry. Sci. Transl. Med. 2013, 5, 208ra145.
- Mason, G.M.; Lowe, K.; Melchiotti, R.; Ellis, R.; De Rinaldis, E.; Peakman, M.; Heck, S.; Lombardi, G.; Tree, T.I.M. Phenotypic Complexity of the Human Regulatory T Cell Compartment Revealed by Mass Cytometry. J. Immunol. 2015, 195, 2030–2037.
- Kay, A.W.; Strauss-Albee, D.M.; Blish, C.A. Application of Mass Cytometry (CyTOF) for Functional and Phenotypic Analysis of Natural Killer Cells. Methods Mol. Biol. 2016, 1441, 13–26.
- Bouzekri, A.; Esch, A.; Ornatsky, O. Multidimensional profiling of drug-treated cells by Imaging Mass Cytometry. FEBS Open Bio 2019, 9, 1652–1669.
- Lingblom, C.M.D.; Kowli, S.; Swaminathan, N.; Maecker, H.T.; Lambert, S.L. Baseline immune profile by CyTOF can predict response to an investigational adjuvanted vaccine in elderly adults. J. Transl. Med. 2018, 16, 153.
- Sen, N.; Mukherjee, G.; Arvin, A.M. Single cell mass cytometry reveals remodeling of human T cell phenotypes by varicella zoster virus. Methods 2015, 90, 85–94.
- Cavrois, M.; Banerjee, T.; Mukherjee, G.; Raman, N.; Hussien, R.; Rodriguez, B.A.; Vasquez, J.; Spitzer, M.H.; Lazarus, N.H.; Jones, J.J.; et al. Mass Cytometric Analysis of HIV Entry, Replication, and Remodeling in Tissue CD4+ T Cells. Cell Rep. 2017, 20, 984–998.
- Nair, N.; Mei, H.E.; Chen, S.-Y.; Hale, M.; Nolan, G.P.; Maecker, H.T.; Genovese, M.; Fathman, C.G.; Whiting, C.C. Mass cytometry as a platform for the discovery of cellular biomarkers to guide effective rheumatic disease therapy. Arthritis Res. Ther. 2015, 17, 127.
- Martinez-Morilla, S.; Villarroel-Espindola, F.; Wong, P.F.; Toki, M.I.; Aung, T.N.; Pelekanou, V.; Bourke-Martin, B.; Schalper, K.A.; Kluger, H.M.; Rimm, D.L. Biomarker Discovery in Patients with Immunotherapy-Treated Melanoma with Imaging Mass Cytometry. Clin. Cancer Res. 2021, 27, 1987–1996.
- Hamlin, R.E.; Rahman, A.; Pak, T.R.; Maringer, K.; Mena, I.; Bernal-Rubio, D.; Potla, U.; Maestre, A.M.; Fredericks, A.C.; Amir, E.-A.D.; et al. High-dimensional CyTOF analysis of dengue virus–infected human DCs reveals distinct viral signatures. JCI Insight 2017, 2, e92424.
- van Unen, V.; Li, N.; Molendijk, I.; Temurhan, M.; Höllt, T.; van der Meulen-de, A.E.; Verspaget, H.W.; Mearin, M.L.; Mulder, C.J.; van Bergen, J.; et al. Mass Cytometry of the Human Mucosal Immune System Identifies Tissue- and Disease-Associated Immune Subsets. Immunity 2016, 44, 1227–1239.
- Geanon, D.; Lee, B.; Kelly, G.; Handler, D.; Upadhyaya, B.; Leech, J.; Herbinet, M.; Valle, D.D.; Gnjatic, S.; Kim-Schulze, S.; et al. A Streamlined CyTOF Workflow To Facilitate Standardized Multi-Site Immune Profiling of COVID-19 Patients. medRxiv 2020.
- Wang, W.; Su, B.; Pang, L.; Qiao, L.; Feng, Y.; Ouyang, Y.; Guo, X.; Shi, H.; Wei, F.; Su, X.; et al. High-dimensional immune profiling by mass cytometry revealed immunosuppression and dysfunction of immunity in COVID-19 patients. Cell. Mol. Immunol. 2020, 17, 650–652.
- Stewart, E.; Wang, X.; Chupp, G.L.; Montgomery, R.R. Profiling cellular heterogeneity in asthma with single cell multiparameter CyTOF. J. Leukoc. Biol. 2020, 108, 1555–1564.
- Levine, J.H.; Simonds, E.F.; Bendall, S.C.; Davis, K.L.; Amir el, A.D.; Tadmor, M.D.; Litvin, O.; Fienberg, H.G.; Jager, A.; Zunder, E.R.; et al. Data-Driven Phenotypic Dissection of AML Reveals Progenitor-like Cells that Correlate with Prognosis. Cell 2015, 162, 184–197.
- Gadalla, R.; Noamani, B.; MacLeod, B.L.; Dickson, R.J.; Guo, M.; Xu, W.; Lukhele, S.; Elsaesser, H.J.; Razak, A.R.A.; Hirano, N.; et al. Validation of CyTOF Against Flow Cytometry for Immunological Studies and Monitoring of Human Cancer Clinical Trials. Front. Oncol. 2019, 9, 415.
- Wiedeman, A.E.; Muir, V.S.; Rosasco, M.G.; Deberg, H.A.; Presnell, S.; Haas, B.; Dufort, M.J.; Speake, C.; Greenbaum, C.J.; Serti, E.; et al. Autoreactive CD8+ T cell exhaustion distinguishes subjects with slow type 1 diabetes progression. J. Clin. Investig. 2019, 130, 480–490.
- Galli, E.; Hartmann, F.J.; Schreiner, B.; Ingelfinger, F.; Arvaniti, E.; Diebold, M.; Mrdjen, D.; Van Der Meer, F.; Krieg, C.; Nimer, F.A.; et al. GM-CSF and CXCR4 define a T helper cell signature in multiple sclerosis. Nat. Med. 2019, 25, 1290–1300.
- Böttcher, C.; Van Der Poel, M.; Fernández-Zapata, C.; Schlickeiser, S.; Leman, J.K.H.; Hsiao, C.-C.; Mizee, M.R.; Adelia; Vincenten, M.C.J.; Kunkel, D.; et al. Single-cell mass cytometry reveals complex myeloid cell composition in active lesions of progressive multiple sclerosis. Acta Neuropathol. Commun. 2020, 8, 136.
- Zhu, Y.P.; Eggert, T.; Araujo, D.J.; Vijayanand, P.; Ottensmeier, C.H.; Hedrick, C.C. CyTOF mass cytometry reveals phenotypically distinct human blood neutrophil populations differentially correlated with melanoma stage. J. Immunother. Cancer 2020, 8, e000473.
- Zhang, Q.; Lou, Y.; Yang, J.; Wang, J.; Feng, J.; Zhao, Y.; Wang, L.; Huang, X.; Fu, Q.; Ye, M.; et al. Integrated multiomic analysis reveals comprehensive tumour heterogeneity and novel immunophenotypic classification in hepatocellular carcinomas. Gut 2019, 68, 2019–2031.
- Neuperger, P.; Balog, J.Á.; Tiszlavicz, L.; Furák, J.; Gémes, N.; Kotogány, E.; Szalontai, K.; Puskás, L.G.; Szebeni, G.J. Analysis of the Single-Cell Heterogeneity of Adenocarcinoma Cell Lines and the Investigation of Intratumor Heterogeneity Reveals the Expression of Transmembrane Protein 45A (TMEM45A) in Lung Adenocarcinoma Cancer Patients. Cancers 2021, 14, 144.
This entry is offline, you can click here to edit this entry!