Ports significantly impact the economic activity in coastal areas. Future climate change projections indicate that the frequency and intensity of extreme sea levels (ESL) will increase, putting several port facilities at risk of flooding with impacts on the port’s reliability and operability. The northwest Iberian Peninsula (NWIP) coast is crossed by one of the most important and busiest shipping lanes in the Atlantic Ocean and features several ports that provide an essential gateway to Europe. Some of the NWIP ports can be considered representative of the different geomorphological environments that characterise the NWIP coast: the ports of Aveiro (lagoon), Lisbon (estuary), Vigo (Ria) and A Coruña Outer Port (marine).
- climate change
- NWIP ports
- coastal environments
1. Introduction
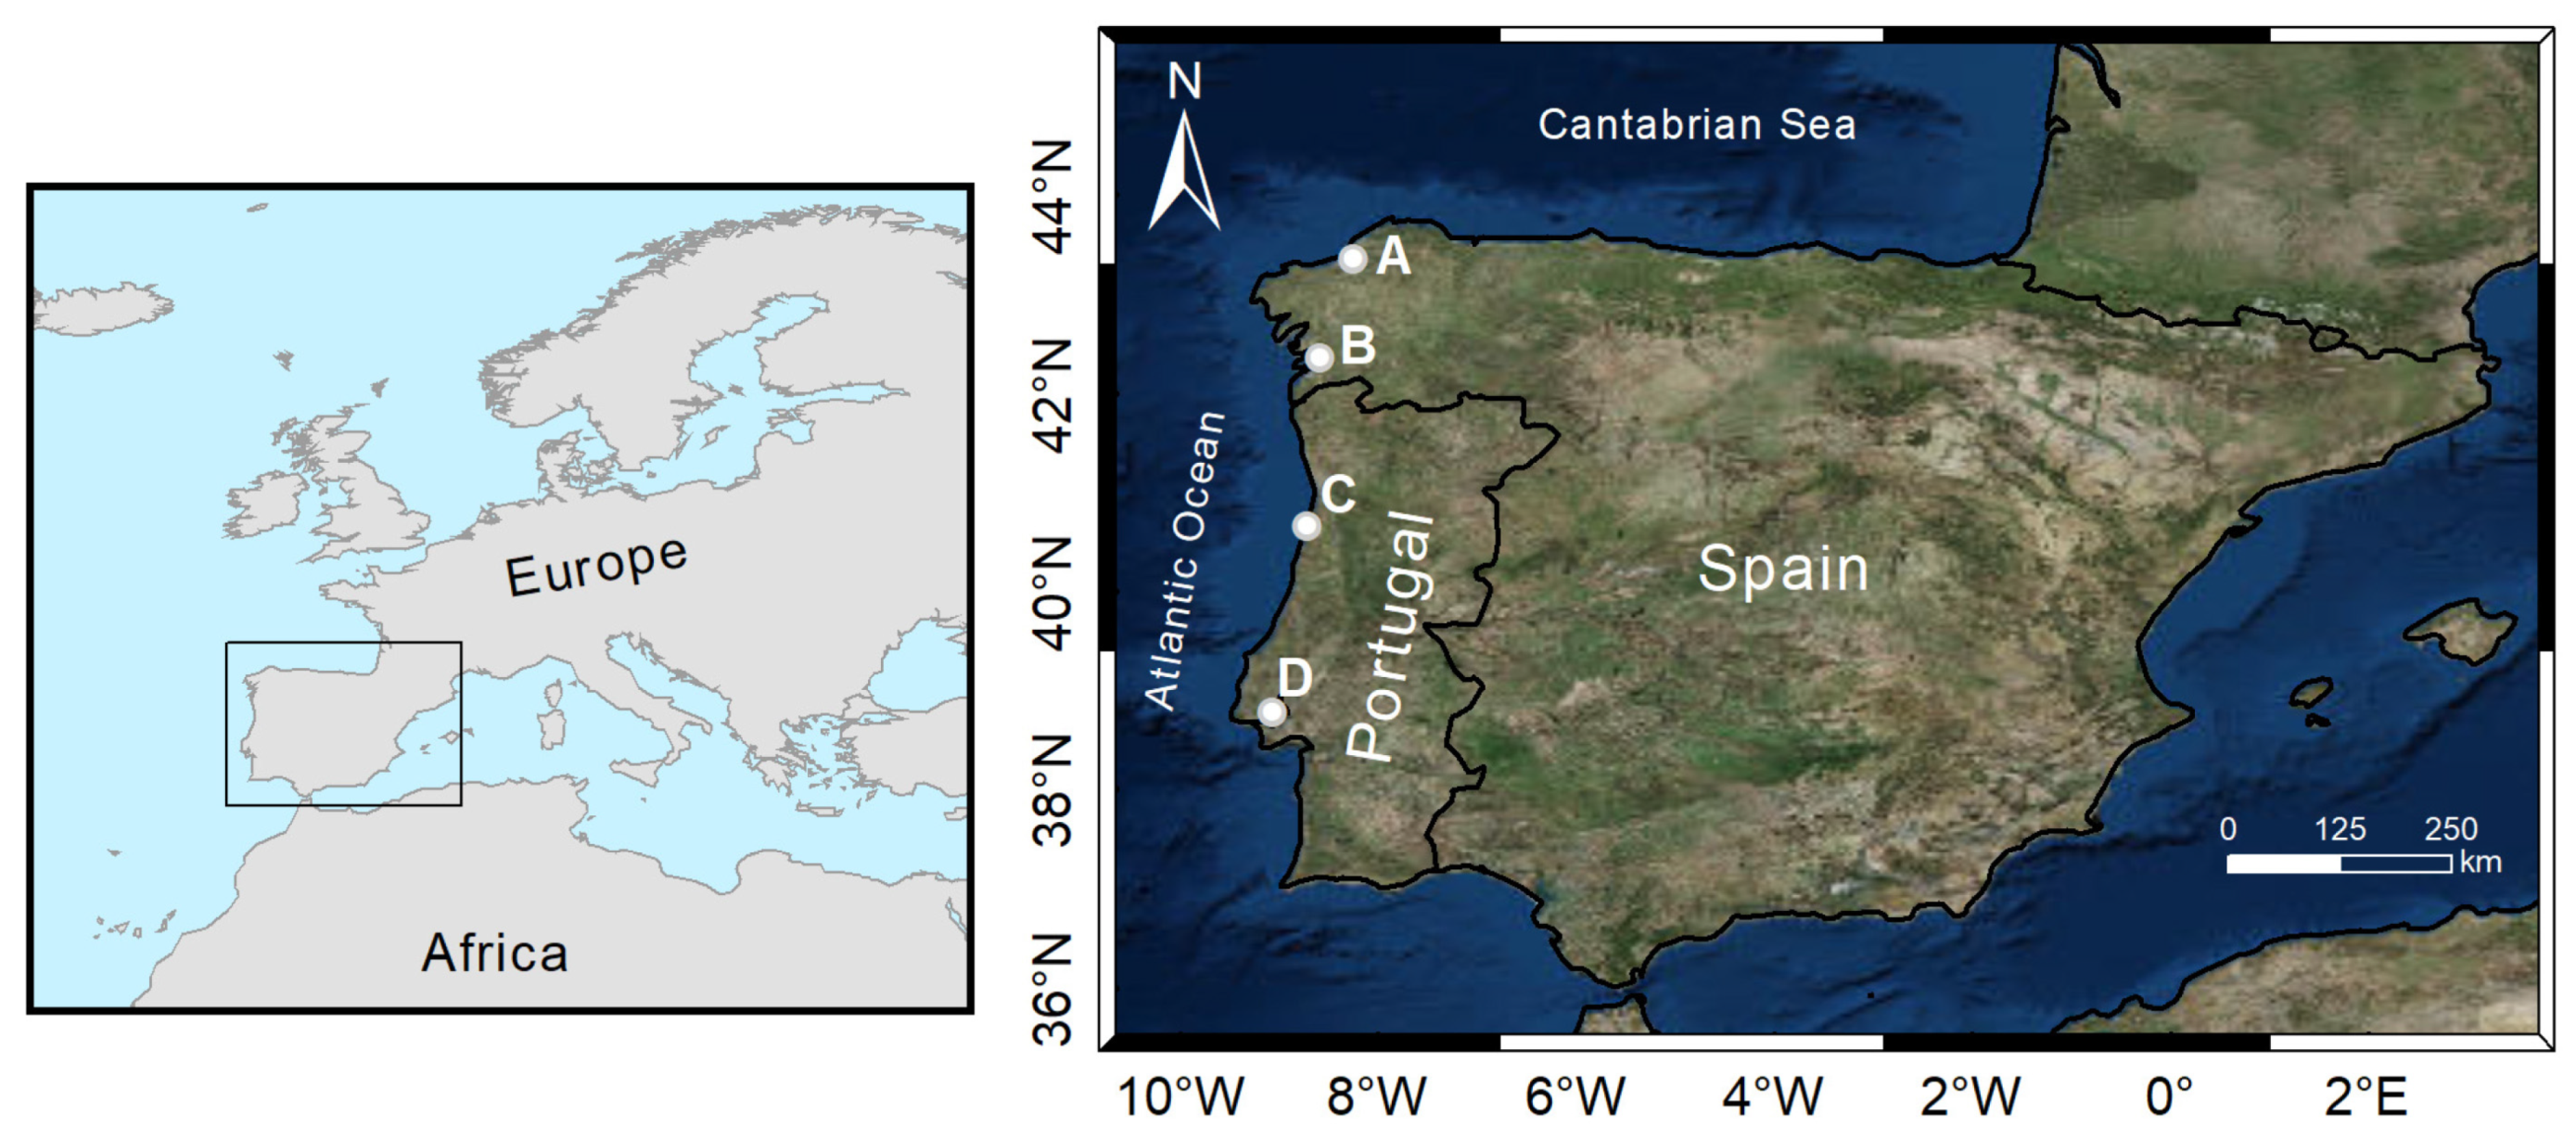
2. Coastal Environments and Representative Ports
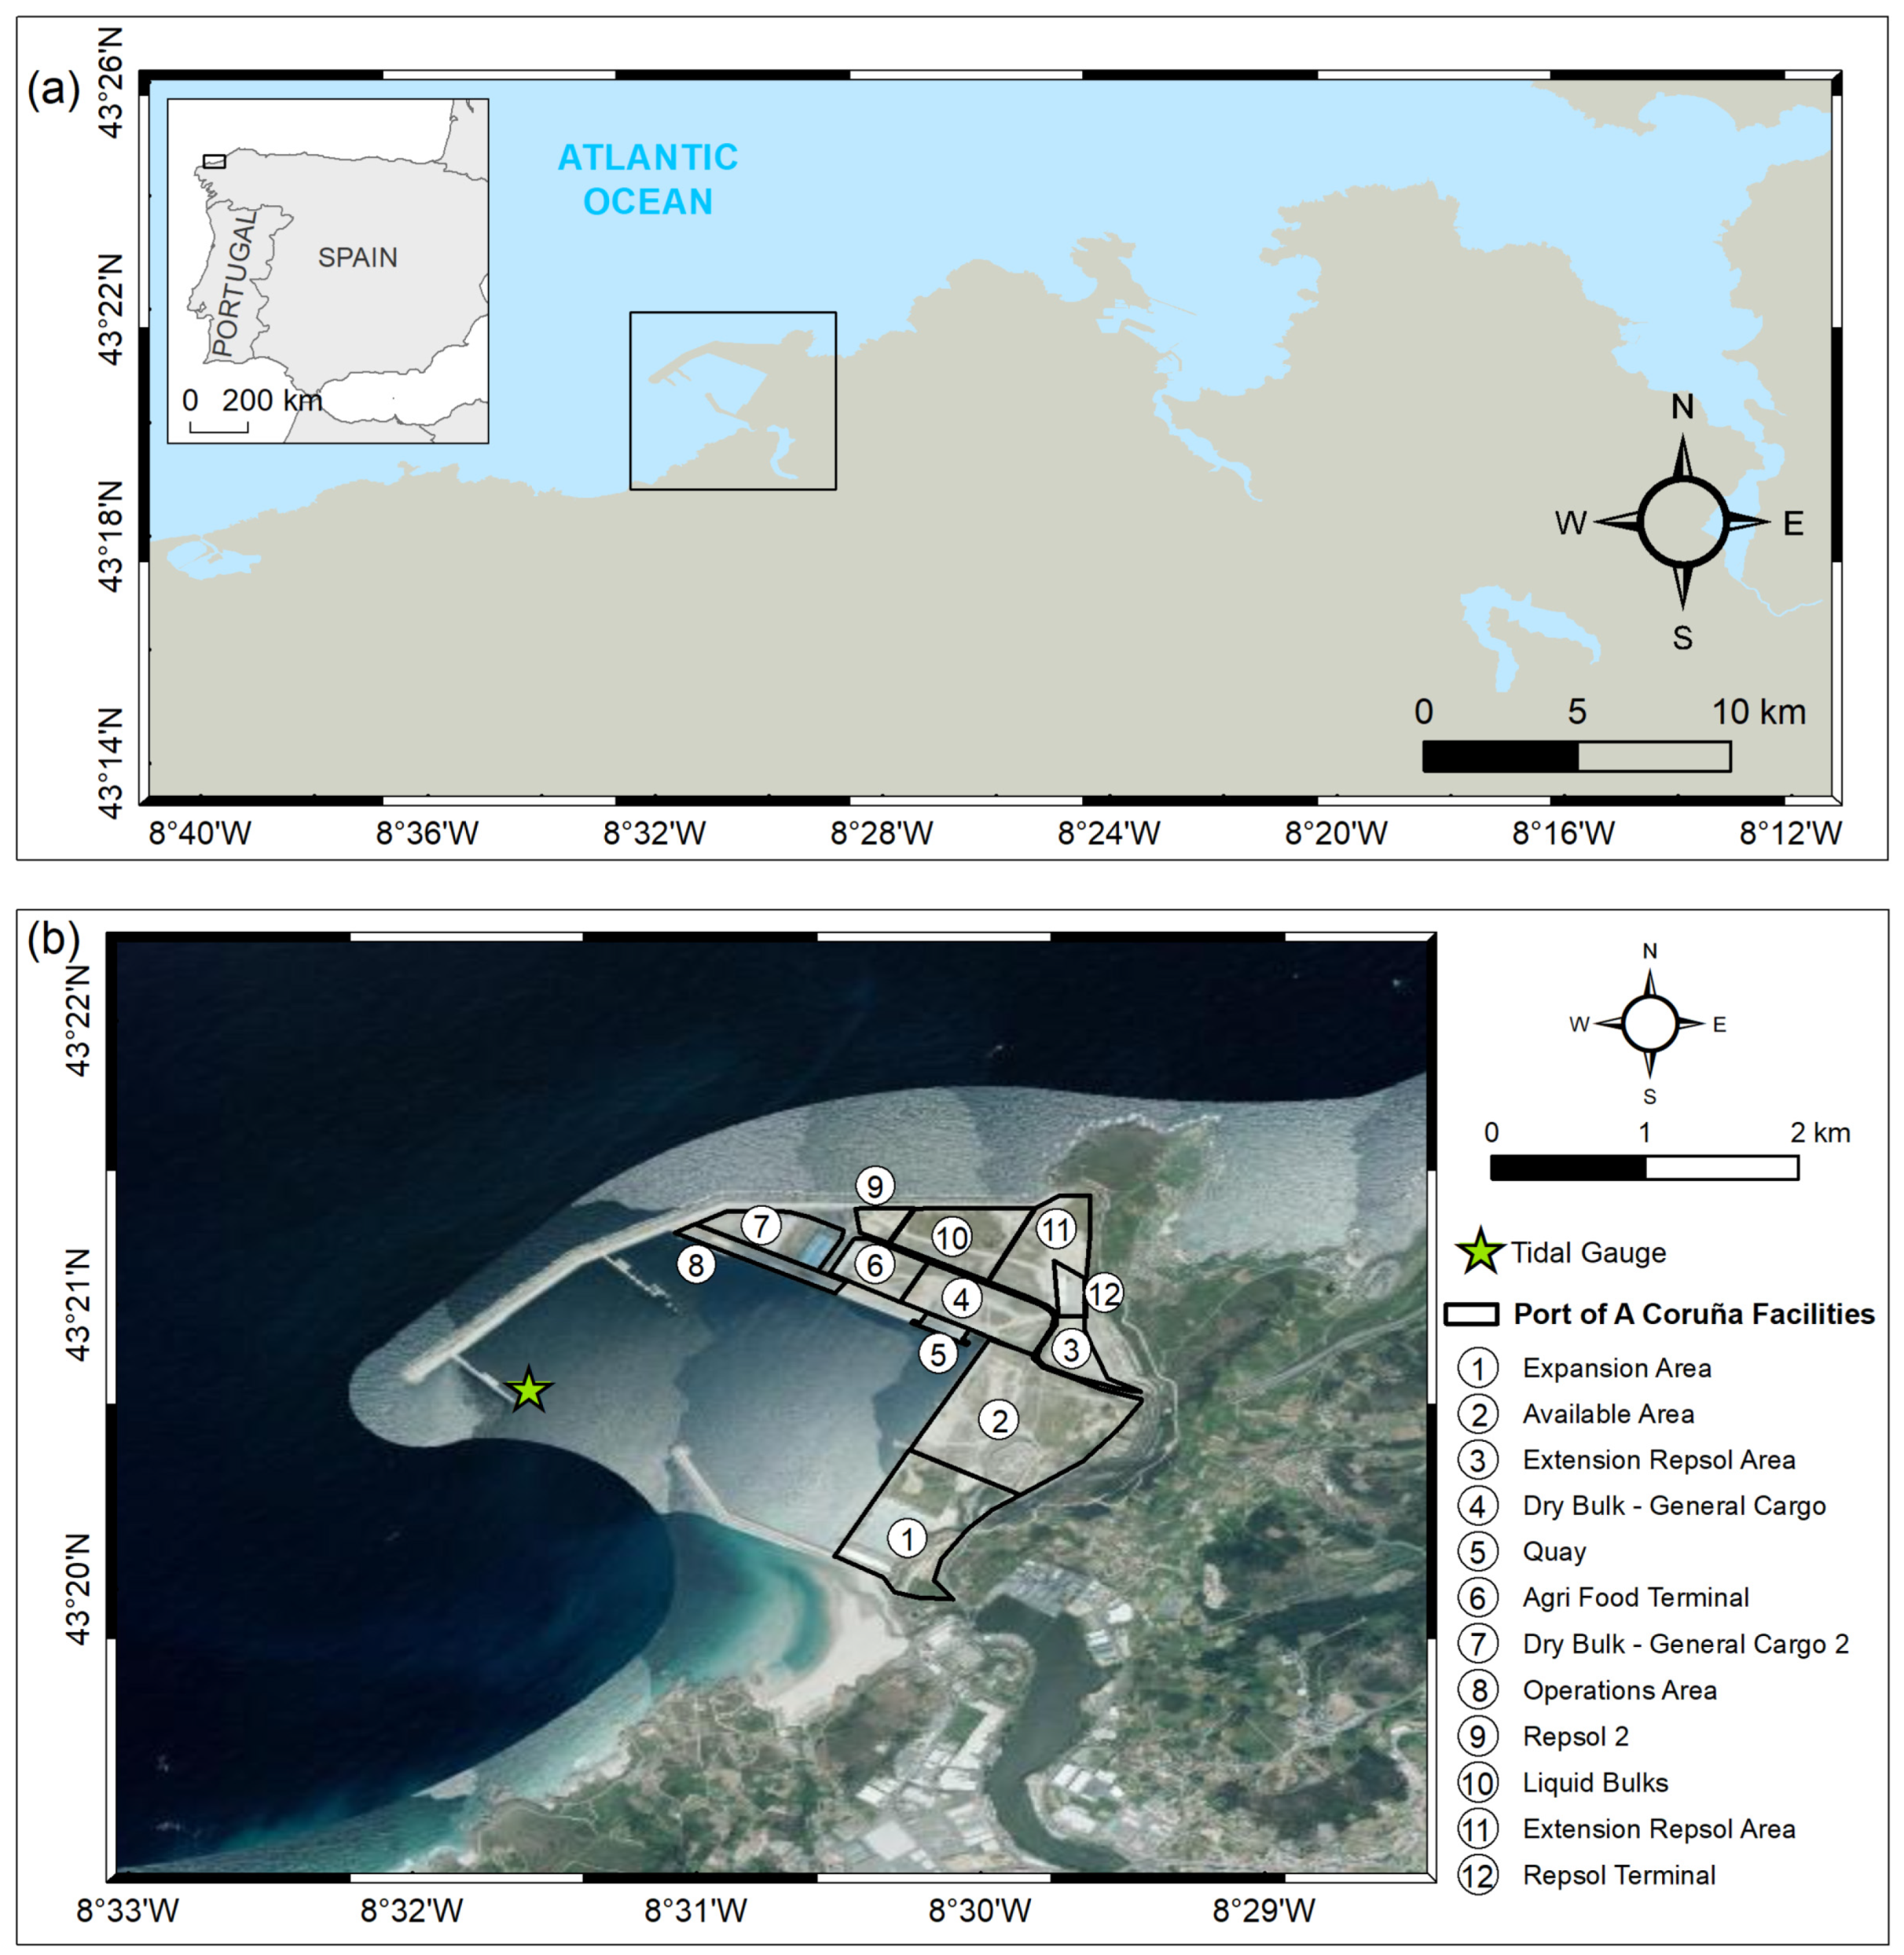
2.1. Marine: A Coruña Outer Port
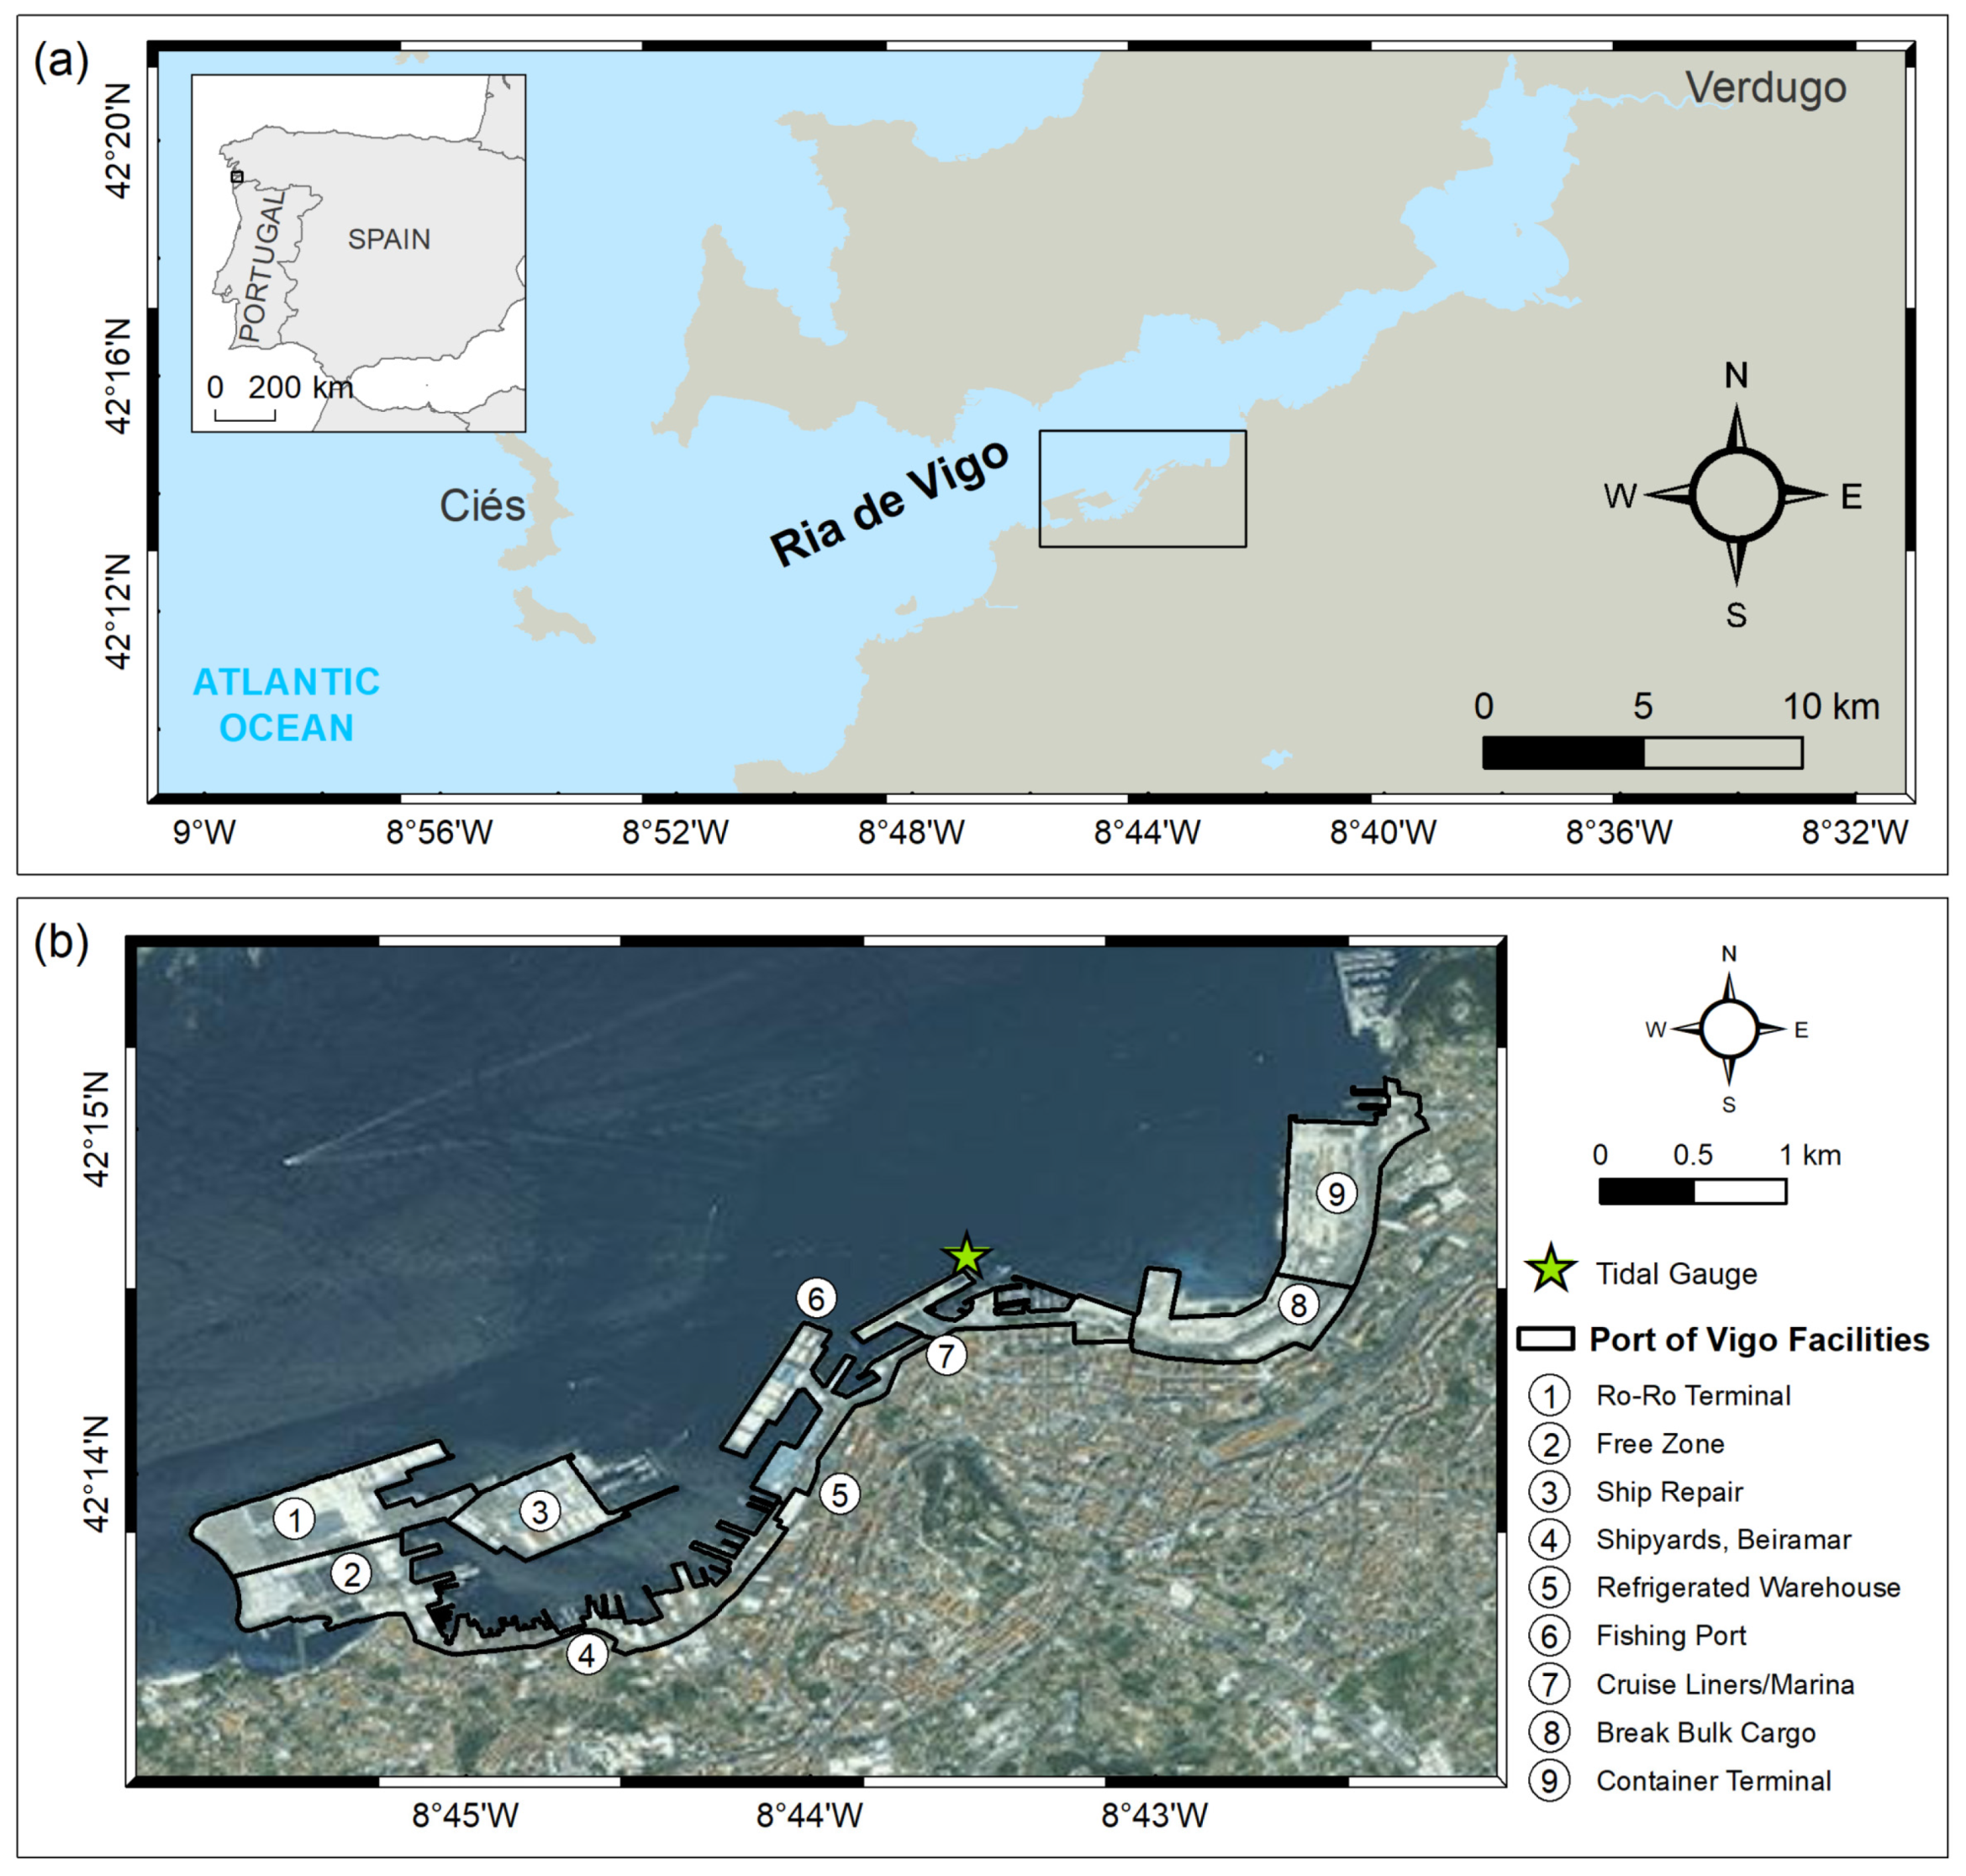
2.2. Ria: Vigo Port
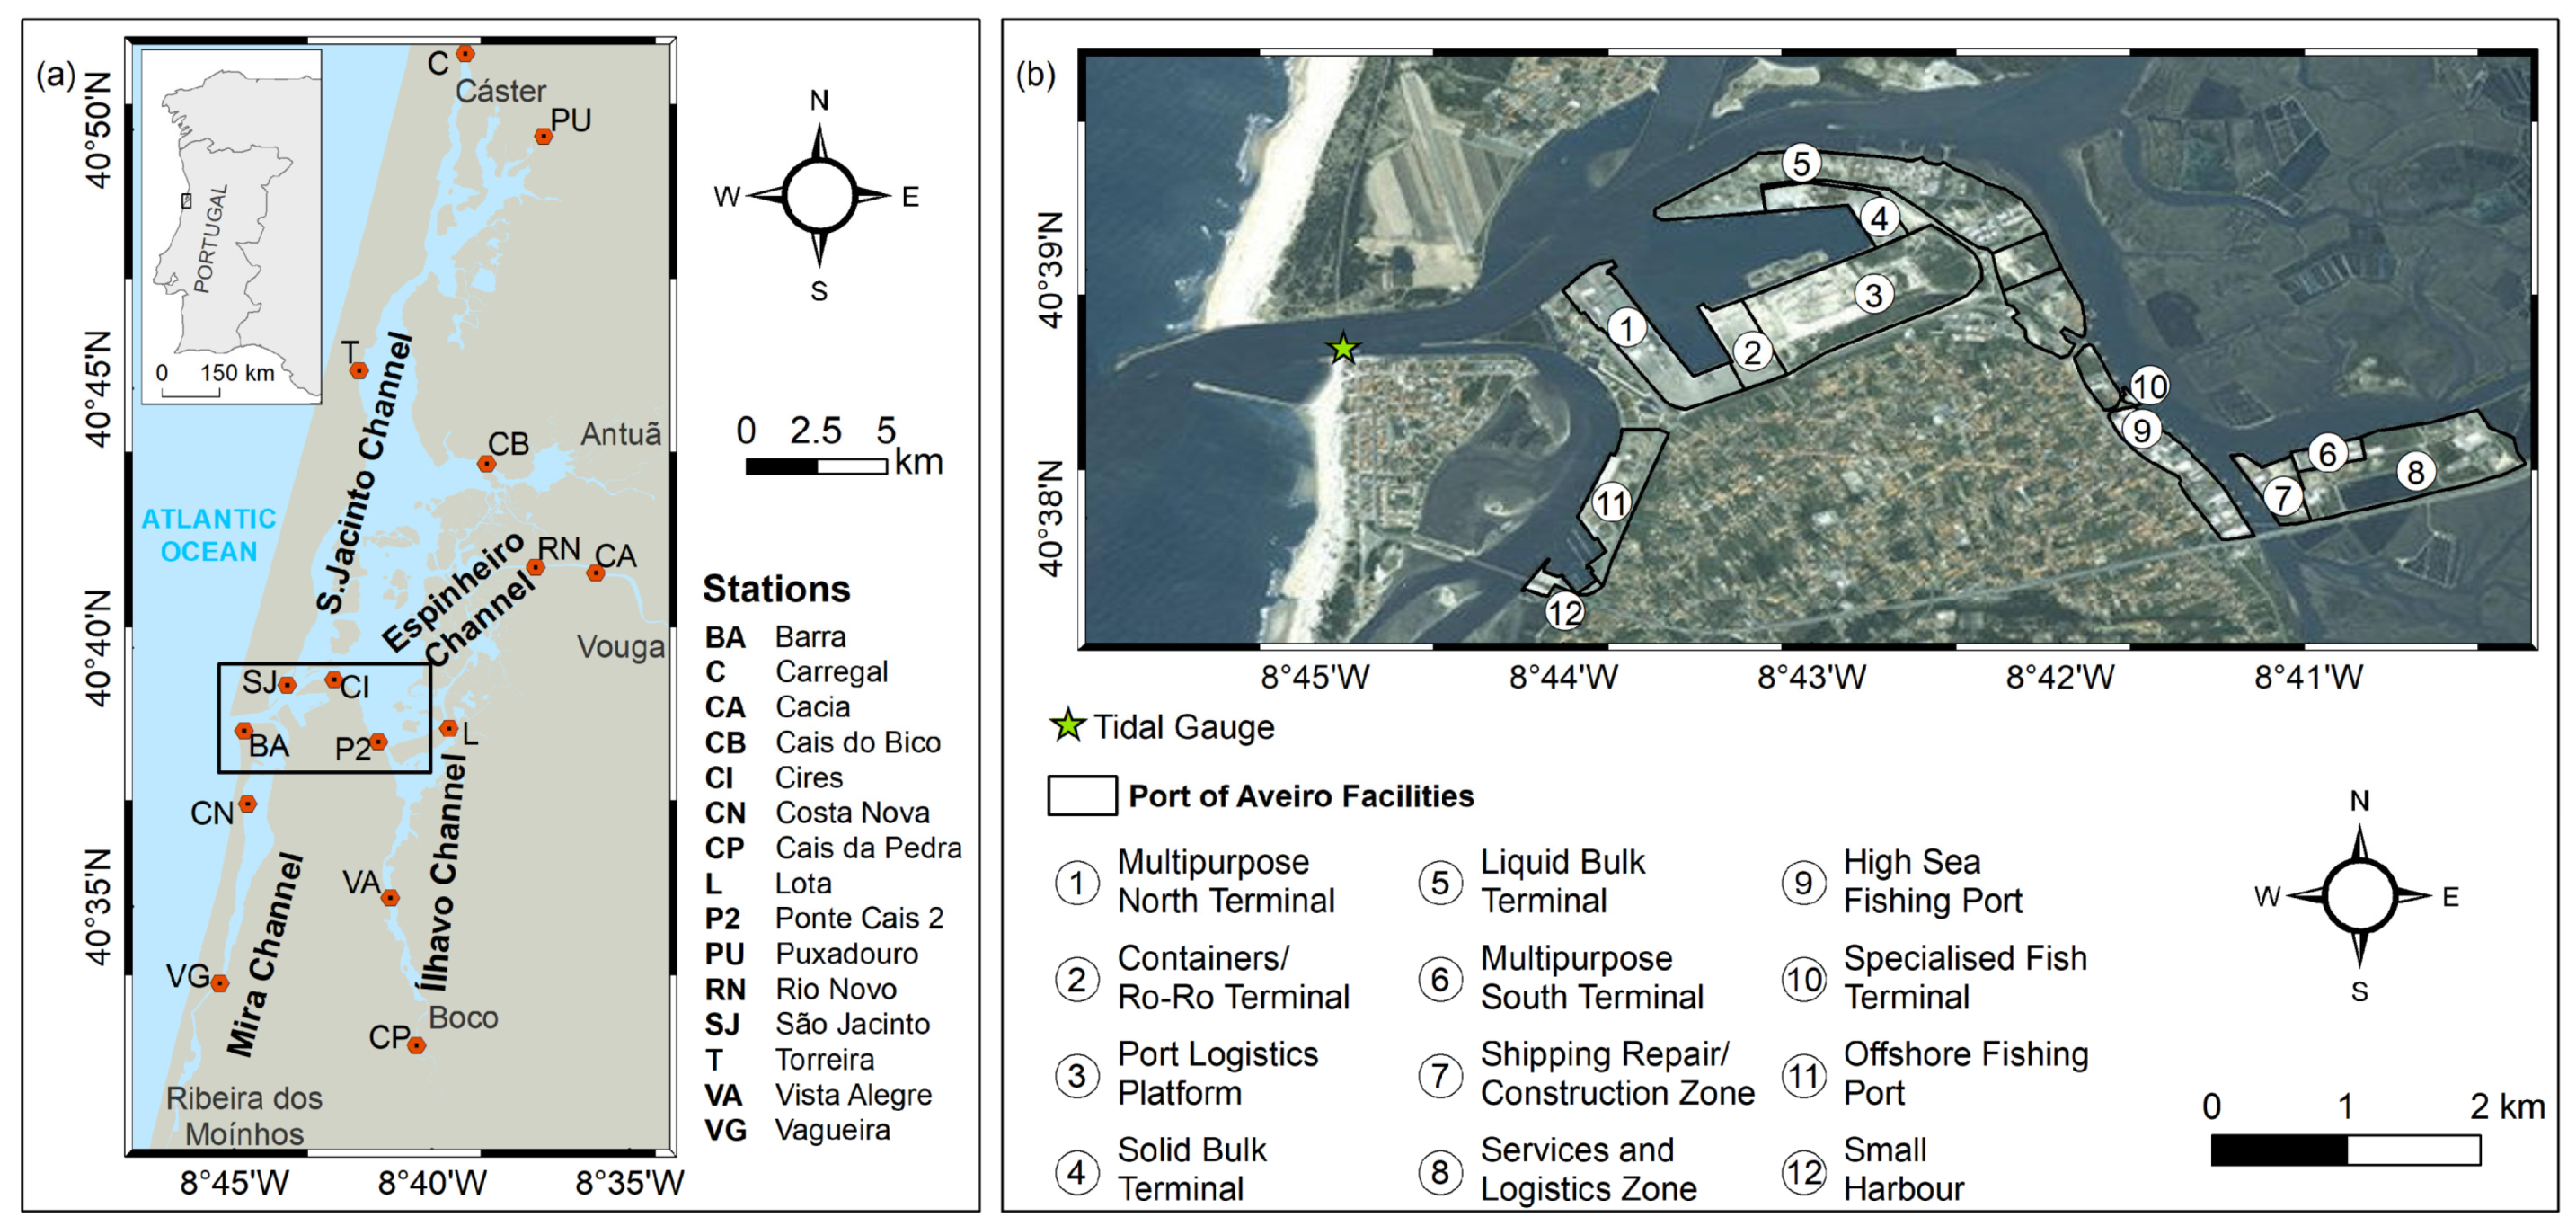
2.3. Lagoon: Aveiro Port
2.4. Estuary: Lisbon Port
This entry is adapted from the peer-reviewed paper 10.3390/jmse11030477
References
- IMO. IMO’s Contribution to Sustainable Maritime Development. In Capacity-Building for Safe, Secure and Efficient Shipping on Clean Oceans through the Integrated Technical Co-Operation Programme; International Maritime Organization—United Nations: London, UK, 1999; 12p.
- Grenzeback, L.R.; Lukmann, A.T. Case Study of the Transportation Sector’s Response to and Recovery from Hurricanes Katrina and Rita; Cambridge Systematics, Inc.: San Francisco, CA, USA, 2007; pp. 1–44.
- Rodrigue, J.-P.; Comtois, C.; Slack, B. The Geography of Transport Systems, 4th ed.; Routledge: London, UK, 2016; ISBN 9781315618159.
- Strauss, B.H.; Orton, P.M.; Bittermann, K.; Buchanan, M.K.; Gilford, D.M.; Kopp, R.E.; Kulp, S.; Massey, C.; de Moel, H.; Vinogradov, S. Economic Damages from Hurricane Sandy Attributable to Sea Level Rise Caused by Anthropogenic Climate Change. Nat. Commun. 2021, 12, 2720.
- Almar, R.; Ranasinghe, R.; Bergsma, E.W.J.; Diaz, H.; Melet, A.; Papa, F.; Vousdoukas, M.; Athanasiou, P.; Dada, O.; Almeida, L.P.; et al. A Global Analysis of Extreme Coastal Water Levels with Implications for Potential Coastal Overtopping. Nat. Commun. 2021, 12, 3775.
- Dangendorf, S.; Hay, C.; Calafat, F.M.; Marcos, M.; Piecuch, C.G.; Berk, K.; Jensen, J. Persistent Acceleration in Global Sea-Level Rise since the 1960s. Nat. Clim. Chang. 2019, 9, 705–710.
- Grinsted, A.; Christensen, J.H. The Transient Sensitivity of Sea Level Rise. Ocean. Sci. 2021, 17, 181–186.
- Bamber, J.L.; Oppenheimer, M.; Kopp, R.E.; Aspinall, W.P.; Cooke, R.M. Ice Sheet Contributions to Future Sea-Level Rise from Structured Expert Judgment. Proc. Natl. Acad. Sci. USA 2019, 116, 11195–11200.
- Harrison, G.P.; Wallace, A.R. Sensitivity of Wave Energy to Climate Change. IEEE Trans. Energy Convers. 2005, 20, 870–877.
- Coumou, D.; Di Capua, G.; Vavrus, S.; Wang, L.; Wang, S. The Influence of Arctic Amplification on Mid-Latitude Summer Circulation. Nat. Commun. 2018, 9, 2959.
- Fraile-Jurado, P.; Guisado-Pintado, E.; Álvarez-Francoso, J.I.; Díaz-Cuevas, P.; Ojeda-Zújar, J. Wave Energy Patterns under Different Sea Level Rise (SLR) Probabilities in the Andalusian Atlantic Coast. J. Coast. Res. 2020, 95, 1088.
- Core Writing Team; Pachauri, R.; Meyer, L. (Eds.) IPCC Climate Change 2014: Synthesis Report. In Contribution of Working Groups I, II and III to the Fifth Assessment Report of the Intergovernmental Panel on Climate Change; IPCC: Geneva, Switzerland, 2014; ISBN 9789291691432.
- Swain, D.L.; Singh, D.; Touma, D.; Diffenbaugh, N.S. Attributing Extreme Events to Climate Change: A New Frontier in a Warming World. One Earth 2020, 2, 522–527.
- Diffenbaugh, N.S.; Singh, D.; Mankin, J.S.; Horton, D.E.; Swain, D.L.; Touma, D.; Charland, A.; Liu, Y.; Haugen, M.; Tsiang, M.; et al. Quantifying the Influence of Global Warming on Unprecedented Extreme Climate Events. Proc. Natl. Acad. Sci. USA 2017, 114, 4881–4886.
- Wunderling, N.; Donges, J.F.; Kurths, J.; Winkelmann, R. Interacting Tipping Elements Increase Risk of Climate Domino Effects under Global Warming. Earth Syst. Dyn. 2021, 12, 601–619.
- Cid, A.; Menéndez, M.; Castanedo, S.; Abascal, A.J.; Méndez, F.J.; Medina, R. Long-Term Changes in the Frequency, Intensity and Duration of Extreme Storm Surge Events in Southern Europe. Clim. Dyn. 2016, 46, 1503–1516.
- Flor-Blanco, G.; Alcántara-Carrió, J.; Jackson, D.W.T.; Flor, G.; Flores-Soriano, C. Coastal Erosion in NW Spain: Recent Patterns under Extreme Storm Wave Events. Geomorphology 2021, 387, 107767.
- Bruneau, N.; Fortunato, A.B.; Dodet, G.; Freire, P.; Oliveira, A.; Bertin, X. Future Evolution of a Tidal Inlet Due to Changes in Wave Climate, Sea Level and Lagoon Morphology (Óbidos Lagoon, Portugal). Cont. Shelf Res. 2011, 31, 1915–1930.
- Christodoulou, A.; Christidis, P.; Demirel, H. Sea-Level Rise in Ports: A Wider Focus on Impacts. Marit. Econ. Logist. 2019, 21, 482–496.
- Vitousek, S.; Barnard, P.L.; Fletcher, C.H.; Frazer, N.; Erikson, L.; Storlazzi, C.D. Doubling of Coastal Flooding Frequency within Decades Due to Sea-Level Rise. Sci. Rep. 2017, 7, 1399.
- Vousdoukas, M.I.; Mentaschi, L.; Voukouvalas, E.; Verlaan, M.; Jevrejeva, S.; Jackson, L.P.; Feyen, L. Global Probabilistic Projections of Extreme Sea Levels Show Intensification of Coastal Flood Hazard. Nat. Commun. 2018, 9, 2360.
- Lambert, E.; Rohmer, J.; Le Cozannet, G.; van de Wal, R.S.W. Adaptation Time to Magnified Flood Hazards Underestimated When Derived from Tide Gauge Records. Environ. Res. Lett. 2020, 15, 074015.
- USCCSP. Impacts of Climate Change and Variability on Transportation Systems and Infrastructure: Gulf Coast Study, Phase I. A Report by the U.S.; Systematics; Climate Change Science Program and the Subcommittee on Global Change Research: Washington, DC, USA, 2008; 445p.
- Gaythwaite, J.W. Design of Marine Facilities for the Berthing, Mooring, and Repair of Vessels; American Society of Civil Engineers: Reston, VA, USA, 2004; ISBN 978-0-7844-0726-4.
- Stenek, V.; Amado, J.; Connell, R.; Palin, O.; Wright, S.; Pope, B.; Hunter, J.; Mcgregor, J.; Morgan, W.; Stanley, B.; et al. Climate Risks and Business Ports: Terminal Marítimo Muelles El Bosque (Cartagena, Colombia); International Finance Corporation: Washington DC, USA, 2011; 190p.
- Nicholls, R.J.; Hanson, S.; Herweijer, C.; Patmore, N.; Hallegatte, S.; Corfee-Morlot, J.; Château, J.; Muir-Wood, R. Ranking Port Cities With High Exposure and Vulnerability to Climate Extremes: Exposure Estimates; Environment Working Papers No. 1; Organisation for Economic Co-Operation and Development: Paris, France, 2008; 61p.
- Hennessy, K.; Bathols, C.P.J.; Mcinnes, K.; Pittock, B.; Suppiah, R.; Walsh, K.; Hennessy, K. Climate Change in the Northern Territory. In Consultancy report for the Northern Territory Department of Infrastructure, Planning and Environment; CSIRO (Commomwealth Scientific and Industrial Research Organisation): Canberra, Australia, 2004; Volume 64, pp. 1–64.
- Lopes, C.L.; Alves, F.L.; Dias, J.M. Flood Risk Assessment in a Coastal Lagoon under Present and Future Scenarios: Ria de Aveiro Case Study. Nat. Hazards 2017, 89, 1307–1325.
- Lopes, C.L.; Dias, J.M. Assessment of Flood Hazard during Extreme Sea Levels in a Tidally Dominated Lagoon. Nat. Hazards 2015, 77, 1345–1364.
- Lopes, C.L.; Silva, P.A.; Dias, J.M.; Rocha, A.; Picado, A.; Plecha, S.; Fortunato, A.B. Local Sea Level Change Scenarios for the End of the 21st Century and Potential Physical Impacts in the Lower Ria de Aveiro (Portugal). Cont. Shelf Res. 2011, 31, 1515–1526.
- Kirezci, E.; Young, I.R.; Ranasinghe, R.; Muis, S.; Nicholls, R.J.; Lincke, D.; Hinkel, J. Projections of Global-Scale Extreme Sea Levels and Resulting Episodic Coastal Flooding over the 21st Century. Sci. Rep. 2020, 10, 11629.
- Kulp, S.A.; Strauss, B.H. New Elevation Data Triple Estimates of Global Vulnerability to Sea-Level Rise and Coastal Flooding. Nat. Commun. 2019, 10, 4844.
- Vousdoukas, M.I.; Mentaschi, L.; Voukouvalas, E.; Verlaan, M.; Feyen, L. Extreme Sea Levels on the Rise along Europe’s Coasts. Earths Future 2017, 5, 304–323.
- Ribeiro, A.S.; Lopes, C.L.; Sousa, M.C.; Gomez-Gesteira, M.; Dias, J.M. Flooding Conditions at Aveiro Port (Portugal) within the Framework of Projected Climate Change. J. Mar. Sci. Eng. 2021, 9, 595.
- Tawn, J.A. Estimating Probabilities of Extreme Sea-Levels. Appl. Stat. 1992, 41, 77.
- Caruso, M.F.; Marani, M. Extreme-Coastal-Water-Level Estimation and Projection: A Comparison of Statistical Methods. Nat. Hazards Earth Syst. Sci. 2022, 22, 1109–1128.
- ben Daoued, A.; Hamdi, Y.; Mouhous-Voyneau, N.; Sergent, P. Modeling Dependence and Coincidence of Storm Surges and High Tide: Methodology, Discussion and Recommendations Based on a Simplified Case Study in Le Havre (France). Nat. Hazards Earth Syst. Sci. 2020, 20, 3387–3398.
- Haigh, I.D.; Nicholls, R.; Wells, N. A Comparison of the Main Methods for Estimating Probabilities of Extreme Still Water Levels. Coast. Eng. 2010, 57, 838–849.
- UNCLOS. United Nations Convention on the Law of the Sea Act 1996. Int. J. Mar. Coast. Law 1997, 12, 202.
- MSP-Portugal Country Report: Portugal. Study on the Economic Effects of Maritime Spatial Planning. Case Studies: Portugal; European Comission-DG Maritime Affairs: Brussels, Belgium, 2010; 51p.
- MSP-Spain Country Report: Spain. Study on the Economic Effects of Maritime Spatial Planning. Case Studies: Spain; European Comission-DG Maritime Affairs: Brussels, Belgium, 2011; 18p.
- Otero, P.; Ruiz-Villarreal, M.; Allen-Perkins, S.; Vila, B.; Cabanas, J.M. Coastal Exposure to Oil Spill Impacts from the Finisterre Traffic Separation Scheme. Mar. Pollut. Bull. 2014, 85, 67–77.
- Woolf, D.K. Variability and Predictability of the North Atlantic Wave Climate. J. Geophys. Res. 2002, 107, 3145.
- Martínez-Asensio, A.; Tsimplis, M.N.; Marcos, M.; Feng, X.; Gomis, D.; Jordà, G.; Josey, S.A. Response of the North Atlantic Wave Climate to Atmospheric Modes of Variability. Int. J. Climatol. 2016, 36, 1210–1225.
- Chen, G.; Chapron, B.; Ezraty, R.; Vandemark, D. A Global View of Swell and Wind Sea Climate in the Ocean by Satellite Altimeter and Scatterometer. J. Atmos. Ocean. Technol. 2002, 19, 1849–1859.
- Ribeiro, A.S.; DeCastro, M.; Costoya, X.; Rusu, L.; Dias, J.M.; Gomez-Gesteira, M. A Delphi Method to Classify Wave Energy Resource for the 21st Century: Application to the NW Iberian Peninsula. Energy 2021, 235, 121396.
- Ribeiro, A.; Costoya, X.; de Castro, M.; Carvalho, D.; Dias, J.M.; Rocha, A.; Gomez-Gesteira, M. Assessment of Hybrid Wind-Wave Energy Resource for the NW Coast of Iberian Peninsula in a Climate Change Context. Appl. Sci. 2020, 10, 7395.
- Uzaki, K.; Matsunaga, N.; Nishii, Y.; Ikehata, Y. Cause and Countermeasure of Long-Period Oscillations of Moored Ships and the Quantification of Surge and Heave Amplitudes. Ocean. Eng. 2010, 37, 155–163.
- Iglesias, G.; López, M.; Carballo, R.; Castro, A.; Fraguela, J.A.; Frigaard, P. Wave Energy Potential in Galicia (NW Spain). Renew Energy 2009, 34, 2323–2333.
- Lorente, P.; Sotillo, M.; Aouf, L.; Amo-Baladrón, A.; Barrera, E.; Dalphinet, A.; Toledano, C.; Rainaud, R.; De Alfonso, M.; Piedracoba, S.; et al. Extreme Wave Height Events in NW Spain: A Combined Multi-Sensor and Model Approach. Remote Sens. 2017, 10, 1.
- Ríos, A.F.; Pérez, F.F.; Fraga, F. Water Masses in the Upper and Middle North Atlantic Ocean East of the Azores. Deep Sea Res. Part A. Oceanogr. Res. Pap. 1992, 39, 645–658.
- Alvarez, I. Inter- and Intra-Annual Analysis of the Salinity and Temperature Evolution in the Galician Rías Baixas–Ocean Boundary (Northwest Spain). J. Geophys. Res. 2005, 110, C04008.
- deCastro, M.; Gómez-Gesteira, M.; Prego, R.; Taboada, J.J.; Montero, P.; Herbello, P.; Pérez-Villar, V. Wind and Tidal Influence on Water Circulation in a Galician Ria (NW Spain). Estuar. Coast. Shelf Sci. 2000, 51, 161–176.
- Oberle, F.K.J.; Storlazzi, C.D.; Hanebuth, T.J.J. Wave-Driven Sediment Mobilization on a Storm-Controlled Continental Shelf (Northwest Iberia). J. Mar. Syst. 2014, 139, 362–372.
- Pérez-Fernández, B.; Viñas, L.; Besada, V. Concentrations of Organic and Inorganic Pollutants in Four Iberian Estuaries, North Eastern Atlantic. Study of Benchmark Values Estimation. Mar. Chem. 2020, 224, 103828.
- Sousa, M.C.; DeCastro, M.; Gago, J.; Ribeiro, A.S.; Des, M.; Gómez-Gesteira, J.L.; Dias, J.M.; Gomez-Gesteira, M. Modelling the Distribution of Microplastics Released by Wastewater Treatment Plants in Ria de Vigo (NW Iberian Peninsula). Mar. Pollut. Bull. 2021, 166, 112227.
- Autoridad Portuaria de Vigo. Strategic Plan, 2018–2028; Autoridad Portuaria de Vigo: Vigo, Spain, 2019.
- Moreira, M.H.; Queiroga, H.; Machado, M.M.; Cunha, M.R. Environmental Gradients in a Southern Europe Estuarine System: Ria de Aveiro, Portugal Implications for Soft Bottom Macrofauna Colonization. Neth. J. Aquat. Ecol. 1993, 27, 465–482.
- Plecha, S.; Silva, P.A.; Vaz, N.; Bertin, X.; Oliveira, A.; Fortunato, A.B.; Dias, J.M. Sensitivity Analysis of a Morphodynamic Modelling System Applied to a Coastal Lagoon Inlet. Ocean Dyn. 2010, 60, 275–284.
- Pereira, C.; Coelho, C. Mapping Erosion Risk under Different Scenarios of Climate Change for Aveiro Coast, Portugal. Nat. Hazards 2013, 69, 1033–1050.
- Picado, A.; Lopes, C.L.; Mendes, R.; Vaz, N.; Dias, J.M. Storm Surge Impact in the Hydrodynamics of a Tidal Lagoon: The Case of Ria de Aveiro. J. Coast. Res. 2013, 65, 796–801.
- Fortunato, A.B.; Rodrigues, M.; Dias, J.M.; Lopes, C.; Oliveira, A. Generating Inundation Maps for a Coastal Lagoon: A Case Study in the Ria de Aveiro (Portugal). Ocean. Eng. 2013, 64, 60–71.
- Pinheiro, J.P.; Lopes, C.L.; Ribeiro, A.S.; Sousa, M.C.; Dias, J.M. Tide-Surge Interaction in Ria de Aveiro Lagoon and Its Influence in Local Inundation Patterns. Cont. Shelf Res. 2020, 200, 104132.
- Lopes, C.L.; Plecha, S.; Silva, P.A.; Dias, J.M. Influence of Morphological Changes in a Lagoon Flooding Extension: Case Study of Ria de Aveiro (Portugal). J. Coast. Res. 2013, 165, 1158–1163.
- Lopes, C.L.; Azevedo, A.; Dias, J.M. Flooding Assessment under Sea Level Rise Scenarios: Ria de Aveiro Case Study. J. Coast. Res. 2013, 65, 766–771.
- Valente, A.S.; da Silva, J.C.B. On the Observability of the Fortnightly Cycle of the Tagus Estuary Turbid Plume Using MODIS Ocean Colour Images. J. Mar. Syst. 2009, 75, 131–137.
- Fortunato, A.B.; Baptista, A.M.; Luettich, R.A. A Three-Dimensional Model of Tidal Currents in the Mouth of the Tagus Estuary. Cont. Shelf Res. 1997, 17, 1689–1714.
- Fortunato, A.B.; Oliveira, A.; Baptista, A.M. On the Effect of Tidal Flats on the Hydrodynamics of the Tagus Estuary. Oceanol. Acta 1999, 22, 31–44.
- Fortunato, A.B.; Oliveira, A. Influence of Intertidal Flats on Tidal Asymmetry. J. Coast. Res. 2005, 215, 1062–1067.
- Rusu, L.; Bernardino, M.; Soares, C.G. Influence of Wind Resolution on the Prediction of Waves Generated in an Estuary. J. Coast. Res. 2009, 56, 1419–1423.
- Lopes, C.L.; Sousa, M.C.; Ribeiro, A.; Pereira, H.; Pinheiro, J.P.; Vaz, L.; Dias, J.M. Evaluation of Future Estuarine Floods in a Sea Level Rise Context. Sci. Rep. 2022, 12, 8083.
- Vaz, N.; Fernandes, L.; Leitão, P.C.; Dias, J.M.; Neves, R. The Tagus Estuarine Plume Induced by Wind and River Runoff: Winter 2007 Case Study. J. Coast. Res. 2009, II, 1090–1094.
- Neves, F.J. Dynamics and Hydrology of the Tagus Estuary: Results from In Situ Observations. Ph.D. Thesis, University of Lisbon, Lisboa, Portugal, 2010.
- Martins, M.; Calvão, T.; Figueiredo, H. Estudo Ambiental Do Estuário Do Tagus, Estudo de Qualidade de Água. Resultados Referentes a Observações Sinópticas Em 1982, CAN/Tagus 30-REL 27; Ministério Da Qualidade de Vida: Lisboa, Portugal, 1983.
- Fortunato, A.B.; Freire, P.; Bertin, X.; Rodrigues, M.; Ferreira, J.; Liberato, M.L.R. A Numerical Study of the February 15, 1941 Storm in the Tagus Estuary. Cont. Shelf Res. 2017, 144, 50–64.
- Portela, L.I.; Neves, R. Numerical Modelling of Suspended Sediment Transport in Tidal Estuaries: A Comparison between the Tagus (Portugal) and the Scheldt (Belgium-the Netherlands). Neth. J. Aquat. Ecol. 1994, 28, 329–335.
- Rilo, A.; Freire, P.; Guerreiro, M.; Fortunato, A.B.; Taborda, R. Estuarine Margins Vulnerability to Floods for Different Sea Level Rise and Human Occupation Scenarios. J. Coast. Res. 2013, 65, 820–825.
- Guerreiro, M.; Fortunato, A.B.; Freire, P.; Rilo, A.; Taborda, R.; Freitas, M.C.; Andrade, C.; Silva, T.; Rodrigues, M.; Bertin, X.; et al. Evolution of the Hydrodynamics of the Tagus Estuary (Portugal) in the 21st Century. Rev. Gestão Costeira Integr. 2015, 15, 65–80.
- Rilo, A.; Freire, P.; Santos, P.; Tavares, A.; Sá, L. Historical Flood Events in the Tagus Estuary: Contribution to Risk Assessment and Management Tools. In Safety and Reliability of Complex Engineered Systems; CRC Press: Boca Raton, FL, USA, 2015; pp. 4281–4286.
- Tavares, A.O.; dos Santos, P.P.; Freire, P.; Fortunato, A.B.; Rilo, A.; Sá, L. Flooding Hazard in the Tagus Estuarine Area: The Challenge of Scale in Vulnerability Assessments. Environ. Sci. Policy 2015, 51, 238–255.
- Rilo, A.; Freire, P.; Ceia, R.; Mendes, R.N.; Catalão, J.; Taborda, R. Human Effects on Estuarine Shoreline Decadal Evolution. In Proceedings of the EGU General Assembly Conference Abstracts, Vienna, Austria, 22–27 April 2012; p. 10863.
- Antunes, C.; Rocha, C.; Catita, C. Coastal Flood Assessment Due to Sea Level Rise and Extreme Storm Events: A Case Study of the Atlantic Coast of Portugal’s Mainland. Geosciences 2019, 9, 239.