Your browser does not fully support modern features. Please upgrade for a smoother experience.
Please note this is an old version of this entry, which may differ significantly from the current revision.
Subjects:
Transportation
Urban street networks are a vital part of urban areas and have a remarkable influence over quality of life and the use of sustainable modes. They make up about 80% of public space and shape urban activities and identity.
- urban street
- indicator framework
- street functions
1. Introduction
An urban area is usually composed of a number of interrelated infrastructures developed to accommodate the basic needs of urban dwellers. Among these various infrastructures, the transportation system plays a unique role because of its effects on developing and structuring the built environment. Urban roads and streets—as the main part of the urban transportation systems—comprise about 80% of public spaces in cities [1,2].
Over the past 100 years or so, the main functions of streets have been considered to be transit and access, while the place function has been gaining consideration for more than a decade [3]. The transit function relates to the ability of streets to provide road users (pedestrians, cyclists, public transit passengers, drivers, etc.) safe and efficient movement on their path from origin to destination with minimum disruption [4]; this function is also known as movement [5,6], mobility, and link [7].
Except for some kinds of movements (e.g., jogging), in which movement is an end in its own right, access is the main goal of transportation (e.g., [8]). So, providing direct access to the adjoining buildings, facilities, and open spaces for all street users, including pedestrians [9], cyclists, emergency services (e.g., fire services and ambulances) and waste collection [3], is another function of streets that typically distinguishes urban streets from other roads and highways [3].
Although accommodating movement along a street might be considered its primary function from a transportation point of view, many streets (or their abutting public spaces) are also destinations in their own rights. This characteristic of streets—known as the place function—is related to their propensity to encourage social activities [3]. It means that people not only use streets to reach their destinations but also do some activities such as shopping, talking with others, resting, trading, eating, observing, strolling, and playing [10]. The place function of streets could be as important as or even more critical than their movement function [3].
The importance of place is underscored by the multidisciplinary efforts to create and manage public spaces to encourage this function, called placemaking. In a review of studies on street design, Hassen and Kaufman [11] examined how it relates to community engagement. Their review found that Aesthetics and Upkeep, Access to Resources/Facilities, Security and Safety, and Walkability were the most common impacts studied. Other relevant topics included Traffic Flow and Calming as well as Placemaking. These impacts are directly related to the three street functions. That review highlighted a number of relevant research needs: the need for a framework to help better understand the impacts of interventions, that a range of methods and measures makes comparison difficult, and the need for metrics to include impacts on all members of society.
There is a natural tension [5] between the three street functions. The trade-off between transit and access functions is well-known and is found as a fundamental theory in many road design manuals. For example, a highway has high transit, but no access; a residential road has low transit and high access [12].
Similar trade-offs between the place and other functions can be found; for example, developing the place function in a street may require implementing traffic calming measures that are likely to affect the transit function. In this regard, Figure 1 illustrates how we can expect some types of roads or urban streets to be located along the three dimensions of the street functions, namely transit, access, and place. This schematic diagram is a hypothetical example, so there is no specific reason for the mentioned street types to follow this pattern exactly (e.g., having equal access and place functions). Yet, how the functions are measured and where various types of streets may be located is largely unknown.
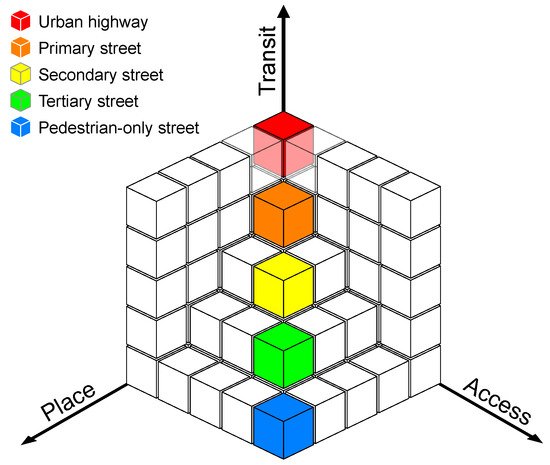
Figure 1. Hypothetical functions of different types of streets.
In addition, there is some fundamental confusion between measures about street characteristics, such as the space allocated to each function [1], and measures of the actual use of streets. It is often stated, “build it and they will come”, but it is not always the case, and the impacts of changes need to be measured objectively. To take a typical example, it is not necessarily true that because a street is made more walkable by widening the sidewalk that pedestrian traffic will increase or that more activities will occur in that space because a new square is built.
Given the vast spatial extent of streets and their importance for the quality of life in urban areas [13], it is therefore crucial to observe directly how they are used, i.e., how well they perform their functions. Developing indicators, methods, and tools to that end makes it possible to design, develop, and maintain streets in such a way as to make the most of this large space in urban areas where the space is usually limited. In order to achieve this goal, it is necessary to identify trends, predict potential problems, evaluate interventions, and measure progress toward predefined objectives [14].
2. Transportation Indicators
In order to improve transportation systems, it is necessary to evaluate and measure different aspects of them [15,16] using appropriate qualitative or quantitative variables (indicators) to identify trends, evaluate solutions, and appraise progress toward the predetermined objectives [14]. In this regard, the selected (or developed) indicators should be relevant, measurable, sensitive, and interpretable [17]. When measuring the street functions, the indicators can relate to either:
-
the characteristics of the transportation system and the built environment, or
-
the movements and the activities of the street users.
The former are expected to influence the latter, although many changes to those can occur and how (or even whether) those changes affect the different functions of a street is not always known until implemented and studied.
Furthermore, the existing indicators to evaluate the streets can be classified into two broad categories, namely subjective and objective [18]. Subjective indicators are based on questions asked to street users and their answers, while objective indicators are based on the direct observation of street users, transportation facilities, or the built environment.
Subjective indicators usually quantify the self-reported usage (i.e., the frequency of visits) and the perception of people about the available transportation facilities and their shortcomings [18]. These indicators can come through qualitative methods such as interviews and focus groups but can also be quantified through questionnaires to sample larger populations. As people experience things differently, these measures capture personal attitudes, tastes, preferences, and feelings of the respondents. However, they may be biased or affected by various sources of error including social desirability, social approval, and recall bias [19]. As a result of such biases, certain behaviors or uses of the space may not be correctly reported, such as the adherence to speed limits or the frequency of stopping to chat.
On the other hand, objective indicators measure things that are observable such as street users (e.g., their attributes, movement, volume, density, type of activity, etc.), transportation facilities (e.g., sidewalk, cycling path, etc.), and also built environment characteristics (e.g., block size, land use mix, etc.). The objective measures usually rely on systematic observations for the street users (e.g., pneumatic tubes to measure the passage of vehicles) or audit tools for quantifying the features of built environment [18]. Objective indicators about the transportation facilities and built environment features are related to potential use, while the user observations reflect the actual use of streets. User observations can be obtained manually by trained observers with clear guidelines to improve consistency or automatically through sensors. The choice of the data collection method depends on the performance of sensors (with appropriate automated processing) and observers, which, in turn, depends on the task, the type of observations, and the context.
These categories of street function indicators are summarized in Table 1 in terms of what the indicators measure and how they measure. It also includes examples of tools that are used to obtain the data for each category of indicators (the tools are discussed in more details in the next section). These distinctions are important as transport agencies and cities often lack the time and resources to conduct studies of actual use for their facilities and rely instead on their characteristics as a proxy of expected use.
Table 1. Main characteristics of indicators in measuring streets with example tools.
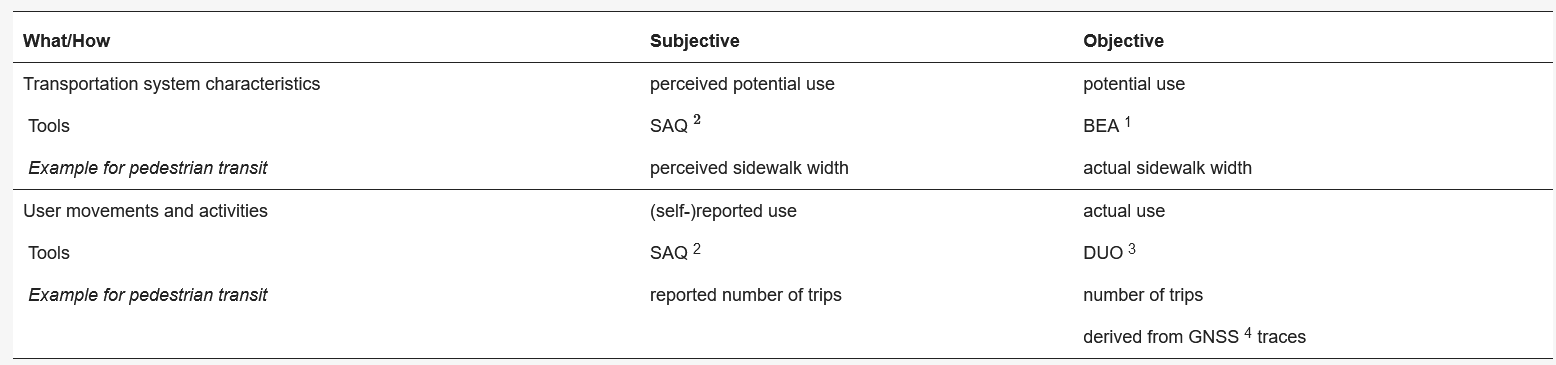
1 Built Environment Audit; 2 Subjective Assessment/Questionnaire; 3 Direct User Observation; 4 Global Navigation Satellite Systems.
However, a review of the studies in this field showed that the relationships between street characteristics and their actual use are not straightforward. For example, it is questionable whether providing walking or cycling facilities will increase the number of people walking or cycling. The study carried out by Brownson et al. [20] showed that the construction and promotion of walking trails may encourage leisure walking, particularly among women and low-income people. On the other hand, some studies reported that the presence of a large number of walking and cycling facilities does not necessarily lead to a higher share of trips by foot or bike [21]. Other parameters such as people’s perception about their physical environment as well as the social and psychological factors likely influence use [22,23,24].
Although the built environment has been found to influence active travel (e.g., [25]), there is, for instance, no agreement on the effect of street connectivity, aesthetic properties, and block size on walking. While Gómez et al. [26] showed that there is a negative association between street connectivity and walking, Badland et al. [27] identified street connectivity as a factor that has a positive effect on adults walking. Regarding neighborhood aesthetic attributes, some studies [21,28,29] find that aesthetic properties are an effective parameter to encourage people to use streets. Contrary to such findings, Hoehner et al. [30] concluded that this parameter is negatively associated with walking and cycling for transportation. Furthermore, as for block size and density of the built environment, Saelens et al. [31] reported that people living in dense districts with short block length are more likely to walk, while the study conducted in [32] showed that the effect of this factor is “modest to non-existent”, if not negative.
Consequently, it seems that relying solely on the potential factors or on user perception, as done in many studies, cannot yield reliable and uniform results about the use of streets in different contexts. In many cases, transport planners and engineers likely want to know whether the change in street design has the desired outcome, whether that be facilitating the transit function or promoting the place function. Thus, in addition to measuring the potential or subjective factors, it is necessary to observe street users directly employing a set of unbiased, robust, and independent indicators to adjust the results of these measurements.
3. Existing Tools for the Assessment of Street Use
In the past decades, there have been many studies about street functions, in particular to identify factors affecting the use of streets. An overview of the conducted studies in this field shows that there is a wide range of variables affecting how people use streets. Wang et al. [33] identified four major categories of factors affecting street use in their literature review:
-
physical environment (i.e., transportation facilities and built environment characteristics)
-
natural environment (e.g., inclement weather, topography, etc.)
-
personal factors (e.g., age, gender, health condition, etc.)
-
social factors (i.e., social cohesion, crime rate, etc.)
In order to evaluate how these factors are related to the street functions, several researchers and institutes have developed various methods and indicators. This section provides a comprehensive review of existing protocols, audit tools and frameworks in terms of their method, target users, and the street functions they cover, as summarized in Table 2.
3.1. Primary Focus Is Motor Vehicle Traffic
The Traffic Data Computation Method Pocket Guide, developed by Federal Highway Administration [34], is a reference of indicators used to evaluate vehicular traffic and is commonly taught and applied by traffic engineers. This guide provides forty-eight indicators for the operational assessment of roads and streets. Such a guide is a traditional engineering guidebook on measuring the transit of motorized vehicles. It includes indicators such as the 85th centile spot speed, the annual average daily traffic, and headways, which are all motor-vehicle-based measures. Although in common use, it essentially ignores other street functions and other street users such as pedestrians and cyclists. Given the historical focus of traffic engineering on measuring the transit function of streets almost exclusively for motor vehicles, other users and groups of interest have aimed to develop frameworks to better capture other street users and street uses. The remainder of the section will discuss a number of such efforts.
3.2. Primary Focus Is Non-Private Motor Vehicle Users
The Global Street Design Guide is a set of baselines for designing urban streets in favor of pedestrians, cyclists, and transit riders [35]. This guide provides a methodology and an indicator framework to evaluate the performance of streets in terms of physical and operational changes, shifts in use and function, and resulting impacts [36]. Although the framework covers all street users, it is a group of microscopic and macroscopic level indicators that makes it difficult to pick suitable indicators at different scales.
3.3. Primary Focus Is Non-Motorized
The open Public Life Data Protocol (PLDP) [37] developed by the Gehl Institute is likely one of the most famous standardized tools to measure the social activities in public spaces including streets, parks, plazas, etc. The PLDP has been applied in many studies and projects all around the world. This protocol is a data specification and a set of indicators developed to provide a common format to collect, store, and share the data on public life gathered through manual observation or by using sensors. Eight survey components (i.e., gender, age, mode, groups, posture, activities, objects, and geotag (i.e., spatial coordinates)) are defined in this protocol and can be adopted to study stationary activities or moving people. This protocol provides a survey worksheet to conduct interviews with people who use public spaces. Although the PLDP is a complete framework for counting passing pedestrians and cyclists and their activities (thus, the place function of a street), it is not designed to capture motorized vehicle use (e.g., cars, trucks, etc.), despite the large share of public space allocated to them.
The National Transport Authority [38], as a noncommercial body of the Department of Transport in Ireland, developed the Universal Design Walkability Audit Tool to measure the degree to which streets are friendly for people to do activities such as walking and spending time through socializing, shopping, etc. This audit tool is designed to record the attributes of street users (i.e., age, gender, and ability range), evaluate the condition of sidewalks, and also survey the local facilities and services. Furthermore, this audit tool evaluates the behavior of drivers (e.g., speeding, failing to yield to pedestrians on crosswalk, etc.) and also cyclists and scooters (e.g., cycling or scooting on sidewalk, failing to stop at red lights, etc.). It also identifies safety issues in the streets. Although the audit tool considers vehicle behavior, it does not keep count of motorized vehicles, people’s activities, nor access.
The Federal Highway Administration in the United States provides two Road Safety Audit (RSA) tools for pedestrians [39] and cyclists [40] as a formal safety examination of in-service or future roads and streets. These audit tools evaluate the safety of pedestrians and cyclists in terms of presence/availability of accommodations, design, operation, quality, obstruction, roadside, continuity/connectivity, lighting, visibility, signs, signals, and human factors/behavior.
The Systematic Pedestrian and Cycling Environmental Scan (SPACES) is an audit tool developed to measure built environment features correlated with walking and cycling [41]. This framework does not cover all street users and is thus lacking measures related to motorized vehicles. Furthermore, it just provides some measures to evaluate the physical factors that potentially affect street use and does not assess the (vehicular) transit, access, and place functions.
The National Bicycle and Pedestrian Documentation (NBPD) is a guide to count and survey pedestrians and cyclists in street segments and intersections [42]. The objectives of this guide are to establish a standard survey methodology and also a national database for pedestrians and cyclist data to study the trends and explore the correlation between activities and potential affecting factors. This guide also provides some standard count worksheets and survey forms for pedestrians and cyclists in street segments and intersections.
The American Association of Retired Persons [43] developed a walk audit tool kit to evaluate the walkability of streets in terms of built environment features, driver behavior, street safety, comfort, and appeal. This audit tool provides a worksheet to keep count of pedestrians, cyclists, and skateboarders. However, this audit tool does not keep count of motorized vehicles, activities, nor of access to adjoining buildings; thus, it does not cover the vehicular transit, place, and or access functions.
The Open Streets Initiatives: Measuring Success toolkit [44] is a framework to evaluate the success of pedestrianized (open) streets in terms of participant counts and activities. This framework provides some protocols to count the participants by gender, age, race, and transport mode (i.e., pedestrian, cyclist, skateboarder), as well as to observe how people spend their time in the open streets.
In addition, there is a long list of frameworks developed to assess the walking and cycling environment by evaluating the available facilities and built environment features: Walking and Bicycling Suitability Assessment (WABSA) [45], Active Neighborhood Checklist [46], Microscale Audit of Pedestrian Streetscapes (MAPS) [47], Framework for measuring urban qualities related to walkability [25], Neighborhood Environment Walkability Scale (NEWS) [48], Pedestrian Environmental Data Scan (PEDS) [49], Pedestrian Environment Review System (PERS) [50], Cycling Environment Review System (CERS) [50], Walkability audit tool [51], Walking route audit tool for seniors (WRATS) [52], Walkability Compass [53], Milano Walkability Measurement [54], and Path Environment Audit Tool (PEAT) [55], to name but a few.
Another example audit tool is the “Audit de potentiel piétonnier actif sécuritaire” (PPAS) developed by the public health department of the City of Montreal [56]. It proposes 80 indicators to evaluate the physical characteristics of sidewalks, roadways, and cycling paths and has been applied in several boroughs of Montreal to assess the walkability of streets [57]. Its primary focus is to assess the built environment with respect to its likely support of pedestrians and is not a direct tool to measure street use.
In addition, the “Espace public: méthodes pour observer et écouter les usagers”, is another observation protocol developed by CEREMA in France to study public space users (i.e., pedestrians, cyclists and people using skate, scooter and roller) in terms of their characteristics (i.e., gender and age), location, direction of movement, and activity type [58]. This method also employs questionnaires to collect more data concerning the users’ attitudes, feelings, and perceptions. This framework is designed to evaluate the place function of public spaces (e.g., parks and plazas), so it does not consider motorized vehicles. All of these walkability and bikeability frameworks are developed based on measurement of potential factors affecting street use and by definition only cover pedestrians or cyclists.
This entry is adapted from the peer-reviewed paper 10.3390/su14127184
This entry is offline, you can click here to edit this entry!