2. Coastal Environments and Representative Ports
2.1. Marine: A Coruña Outer Port
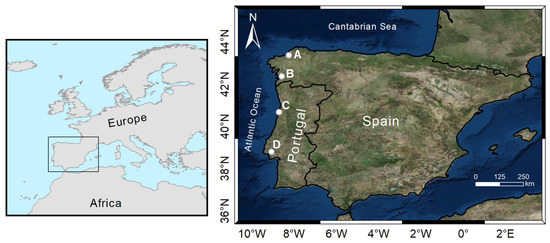
The A Coruña Outer Port is located on the northwest coast of the Iberian Peninsula (
Figure 2a) and is one of Galicia’s most significant construction projects. The wind–wave climate in this region is highly seasonal and strongly influenced by the North Atlantic Oscillation, being the greatest source of inter-annual variability [
47,
48] in the wave climate [
49], making it one of the most energetic areas in Europe [
50,
51]. As a consequence, periodic storms occur during the winter months causing energetic waves [
52,
53,
54] for long periods and significant waves (
Hs) exceeding 7.2 m and prevailing incoming NW waves [
54]. The wave climate is a key factor for the new port’s built-in marine environments, such as the Outer Port. The conditions tend to be severe, exhibiting higher wave heights, currents and winds. For this reason, robust breakwaters were designed by the Port Authority of A Coruña to withstand the hazardous weather and serve as an artificial harbour for large ships. The port facilities (
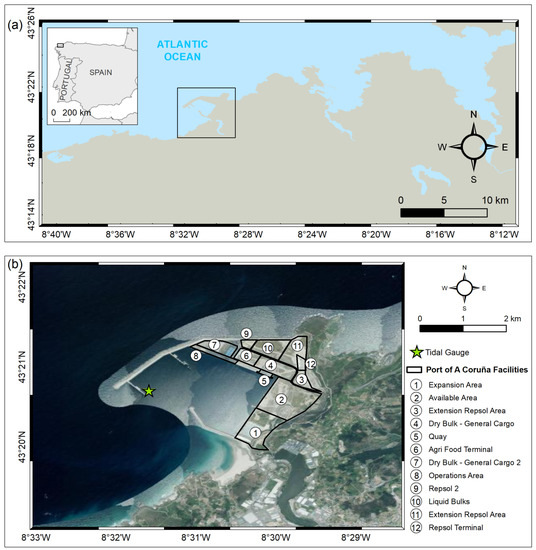
Figure 2b) involved the construction of a 3360 m long breakwater with three alignments and the creation of a dock basin with 230 ha of sheltered waters, with capacity for nine berths for oil tankers up to 300 m and 200,000 tons. The port aims to handle break-bulk, dry bulk and liquid bulk cargoes. For detailed port information, the reader is referred to the port administration website (puertocoruna.com).
Figure 2. Study area and location of the A Coruña Outer Port (a) and the business areas (b).
2.2. Ria: Vigo Port
Vigo port is located in the Ria de Vigo, the widest of the four V-shaped drowned river valleys caused by a rise in sea level with SSE–NNW orientation, in the Rias Baixas, between 42° N and 43° N (
Figure 3). According to the hydrodynamic characteristics, Rias de Vigo is divided into inner, middle and outer sectors. The outer section is protected by the Cíes Islands, providing a natural harbour with around 14.000 hectares of sheltered water protected from the direct influence of the ocean. The middle sector is the central part of the ria, where the port is located. The inner sector covers the shallow head of the ria, where the Oitavén-Verdugo river flows, with a mean annual discharge of 13 m
3s
−1, characterised by high seasonal variability, ranging from 120 m
3s
−1 to 1 m
3s
−1 in winter and summer, respectively [
55]. The mesotidal tide [
56] also contributes to the ria circulation, characterised by a semi-diurnal pattern.
The Azores anticyclone influences the weather and climate observed in the Rias Baixas region, where the winds are predominant from NNE in the winter and from northeast to the northwest in the summer [
56,
57]. This seasonal pattern is also observed in the wave regime, with great inter-annual variability, where the swell component is predominant most of the year [
47]. In the winter, the significant wave height usually ranges between 1–3 m, reaching up to 10 m during storms, and presenting a northwest dominant wave direction [
58].
The Ria de Vigo supports important touristic and industrial activities [
59], being a major shipyard centre and constituting Europe’s principal landing point for fishing [
60]. The Vigo port jurisdiction area comprises the whole Ria de Vigo region, limited in the south by the Punta Lameda, in the north by Cape Home, and in the west by the Cíes Islands [
61]. These features allow the port to operate 365 days a year. Most of the infrastructures in Vigo port are for freight, passenger and fishing vessels, being located on the southern margin of the Ria de Vigo. For detailed port information, the reader is referred to the port administration website (apvigo.es).
2.3. Lagoon: Aveiro Port
Aveiro port is located in an inland lagoon (
Figure 1), characterised by a low topography. The lagoon extends up to 10 km onshore and is 45 km long, with various channels where five major rivers flow into the system (Vouga, Antuã, Ribeira dos Moinhos, Cáster and Boco) [
28,
29], with the Vouga river being the main contributor reaching a mean discharge of 80 m
3s
−1 [
63]. The lagoon is protected from hazardous waves by sandy barriers extending along the shore, which offers protection from the wave action even during winter storms [
30,
34,
64]. The tide is characterised by a semi-diurnal regime, reaching average tidal amplitudes of 0.46 m at the neap tide and 3.52 m at the spring tide. During winter storms, waves can reach up to 8 m during 5-day storm events [
65], and the occurrence of storm surges can contribute to over elevations from 0.3 to 1.1 m [
66]. The contribution of meteo-ocean drivers to the lagoon flood risk has been studied for historic [
29,
67,
68,
69] and future periods [
28,
30,
34,
70], highlighting work focused on the port flood risk which identified the most hazard areas of the port [
34].
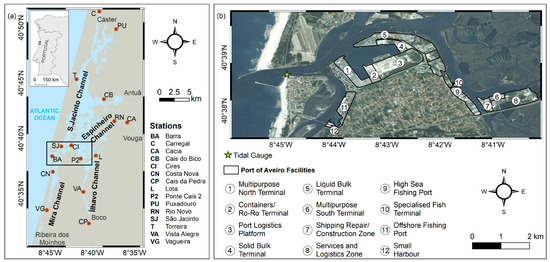
The port structure lies inside the Ria de Aveiro (Figure 4), contiguous to the lagoon entrance, which serves as a single navigation channel and is protected by two breakwaters that extend seaward north with an extension of 1200 m and south for 700 m, with a wide channel to the port facilities. These features allow the required channel depth and stability to secure passage for large ships during rough winters. The port is composed of several terminals divided into sectors, where the lagoon entrance is 2.4 km from the north sector (north terminal, container and roll-on/roll-off terminal, solid bulk cargo and liquid bulk cargo terminal) and 7.2 km from the south sector (south terminal, high sea fishing port and specialised fisheries terminal). For detailed port information, the reader is referred to the port administration website (portodeaveiro.pt).
Figure 4. Location of the Aveiro port (
a) and the business areas in the port administration jurisdiction (
b) [
34].
2.4. Estuary: Lisbon Port
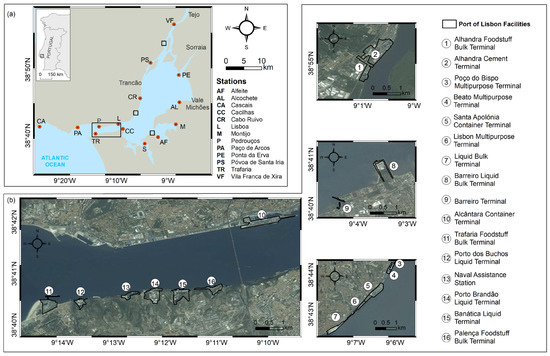
The Lisbon port is located in the Tagus estuary (
Figure 5). The Tagus estuary is one of the largest estuaries on the west coast of Europe and the largest of the Iberian Peninsula, having an EW direction, with a total area of 320 km
2 [
71]. The estuary is composed of a deep, narrow inlet channel and a shallow inner bay. The inlet channel is 15 km long, 2 km wide and reaches depths of 40 m, constituting the deepest part of the estuary [
72]. The inner bay is about 25 km long and 15 km wide, being the shallowest part, and has complex bottom topography with narrow channels, tidal flat areas and small islands on the innermost part of the estuary [
73,
74]. These features provide protection from the ENE and WSW directions of the predominant winds and from waves during the winter. However, the circulation at the estuary’s mouth is affected by the wave regime, being often exposed to the predominant swells from various incident directions [
75].
Figure 5. Study area with the in-situ stations (
a) used to validate the hydrodynamic model (data retrieved from [
87]). Location of the Lisbon port and the business areas in the port administration jurisdiction (
b).
The estuary hydrography is mainly controlled by the tidal propagation and fluvial discharge from several major rivers (Tagus, Sorraia, Trancão and Vale Michões) [
76], which can cause seasonal variability due to the influence of the discharge from the rivers [
77,
78]. However, during storms, wind, atmospheric pressure and surface waves may also influence the estuarine circulation [
79]. The tides are semi-diurnal, and the M
2 harmonic constituent is dominant with amplitudes of 1 m [
73], with tidal ranges varying from 0.75 m in neap tides in Cascais to 4.3 m in spring tides in the upper estuary [
72,
80].
Historically, these hydrodynamic drivers and morphological settings promote the flooding of estuarine margins [
73,
81,
82,
83]. In fact, the conjugation of the extreme astronomic tidal levels and storm surge conditions has led to flood events in the past [
79,
84] that significantly impacted flood-prone areas, affecting several residential and economic activities. The anthropogenic pressure on the estuary has been increasing in the margins, with the integration of several uses and activities for urban, industrial and agricultural purposes [
84]. The estuary is surrounded by Lisbon, the most populated city in Portugal, featuring different land cover types along its margins [
85], which include salt marshes, anthropogenic structures and beaches. This inundation risk is expected to increase in severity due to climate change effects [
86].
Lisbon port’s location (Figure 5a) and structure were established during the first decades of the 20th century, boosted by the local industry and maritime traffic. Since then, the expansion of the port towards the inner regions of the estuary has taken place, with the settlement of new terminals. The port activities (Figure 5b) range from handling of containerised cargo, roll-on/roll-off, break-bulk cargo (located on the north bank of the port) and liquid and solid bulk cargo (south bank of the port). For detailed port information, the reader is referred to the port administration website (portodelisboa.pt).