Your browser does not fully support modern features. Please upgrade for a smoother experience.
Please note this is an old version of this entry, which may differ significantly from the current revision.
A Tool Condition Monitoring (TCM) system is presented that automatically classifies tool wear of turning tools into four classes. A cutting tool was monitored with infrared (IR) camera immediately after the cut and in the following 60 s. The Convolutional Neural Network Inception V3 was used to analyse and classify the thermographic images, which were divided into different groups depending on the time of acquisition. Based on classification result, one gets information about the cutting capability of the tool for further machining.
- Tool Condition Monitoring
- turning
- Convolutional Neural Network
- Deep Learning
- Industry 4.0
- thermography
- tool wear
- Inception V3
1. Introduction
One needs to rely on experience and visual inspection of the cutting edge of the cutting tool at the end of the cut. One also monitors the sound of the process (vibrations), the roughness of the workpiece surface, the colour (temperature) of the chips, the dimensional accuracy of the workpiece, etc.
Researchers are often confronted with the question of how to determine tool wear with the TCM System (Tool Condition Monitoring System). By introducing a reliable smart system that makes decisions instead of humans, it is possible to eliminate any error in judgement that may occur due to the human factor (e.g., inexperience). Several advantages can be obtained by monitoring the wear of a cutting tool. The condition of the cutting tool is one of the main factors affecting the quality of the final product [1] therefore the tool wear prediction is critical for product quality control [2]. However, not only the quality of the product is affected by the wear of the cutting tool. The financial aspect is also needs to be taken into account. Optimal costs can be achieved only if the cutting tool is changed at the right time—just before the quality of the machined surface does not meet the requirements due to the worn cutting tool. Replacing precipitately is related directly to the higher cost of a new cutting tool and additional changeover time. The use of a worn cutting tool has a negative effect on both the quality of the product and the machine tool load. TCM systems are crucial for cost-optimised manufacturing and play a fundamental role in Industry 4.0 [3] in the contest of error minimization and productivity maximization [4]. Since the cutting tool is clamped and heats up considerably during turning, various indirect systems without contact with the cutting insert are suitable methods for tool wear monitoring.
This entry introduced the TCM, which classifies cutting tool wear according to a tool change policy. The system detects whether a tool produces a conforming or non-conforming part. The method used is based on Machine Vision, Convolutional Neural Network (CNN), and Transfer Learning (TL). Brili et al. [5] were able to use a thermal IR (infrared) camera to monitor the cutting process successfully. Furthermore, thermographic images of chips were analysed with the CNN, a well-known Machine Vision model. This system sorts tools into 3 classes according to the wear level: no wear, low wear, and high wear. The cutting tool wear is determined during a turning process, which is achieved by mounting an IR camera to the revolver and taking images. The said images do not exhibit the cutting tool, because it is being obstructed by the emerging chips.
A completely new approach for TCM for a turning tool is presented: A system that determines whether the cutting tool is suitable for further machining or not, based on the thermographic image of the cutting tool after the cut has been finished. The thermographic image made with the IR camera combines two approaches: Computer Vision and temperature measurements. Thermographic images were taken immediately after the end of the cut and then in the next 60 s. A Deep Learning method, more precisely a Convolutional Neural Network Inception V3, is used to analyse the images and classify them into 4 different classes: no, low, medium, and high tool wear.
The existing temperature based TCM systems have focused on the absolute cutting tool temperature measurement, the proposed system based on the cutting tool temperature distribution (relative temperatures) is diverse. The whole thermographic image is an input to the Neural Network and the tool wear is categorised based on the features of the image. Furthermore, a use of Deep Learning for the analysis of thermographic images in the field of TCM is a novelty compared to existing research. By using feature-based method analysing relative temperature differences instead of absolute temperature measurement, the temperature dependent TCM system becomes more universal and robust.
2. Complete Image Set (60 s)
Firstly, all of thermographic images were classified. The results are depicted in the confusion matrix in Table 1.
Table 1. Confusion matrix for the tool wear classification for all images.
| ACTUAL | |||||||
|---|---|---|---|---|---|---|---|
| No Wear | Low Wear | Medium Wear | High Wear | Sum | Precision | ||
| PREDICTED | No wear | 216 | 0 | 4 | 0 | 220 | 98.2% |
| Low wear | 0 | 220 | 0 | 0 | 220 | 100% | |
| Medium wear | 4 | 0 | 210 | 4 | 218 | 96.3% | |
| High wear | 0 | 0 | 6 | 216 | 222 | 97.3% | |
| Sum | 220 | 220 | 220 | 220 | Accuracy: 97.95% | ||
| Recall | 98.2% | 100% | 95.5% | 98.2% | |||
After a brisk inspection of Table 1, it is evident that the CNN managed to classify 862 images correctly out of the total 880 images. Subsequently, the analysis of 18 false predictions was performed (Figure 1).
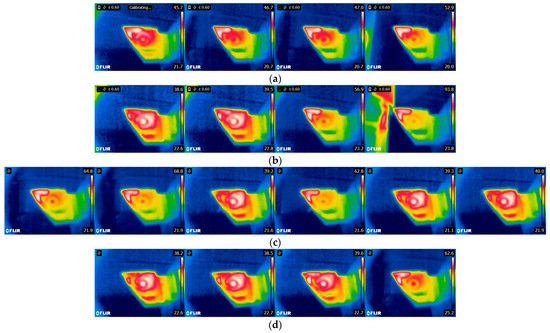
Figure 1. (a) “No wear”, but classified as “medium wear” (images belong to the turning series 9, 11, and 12—only images taken from the last series of turning were classified falsely, because the insert was not completely new); (b) “Medium wear”, but classified as “no wear” (images belong to the series 1 and 5—especially the first series of turning with medium insert wear, when it was not yet heated); (c) “Medium wear”, but classified as “high wear” (images belong to the series 9, 10, and 11); (d) “High wear”, but classified as “Medium wear” (images belong to the series 2 and 12).
After inspection of the false predictions it was concluded that the CNN classified images from early—initial turning series into a lower wear severity class than it should. On the other hand, it classified images from later series (11th, 12th, etc.) into a wear level category that was too high. Abnormalities during a visual inspection were not observed.
Additional probabilistic analysis for four images of an insert with a “high wear” that were classified as “medium wear” was performed, which was derived from the Softmax layer (Table 2). The analysis showed similar probabilities between the actual and false classes. Furthermore, the Neural Network’s second most probable guess always contained the correct class for each image.
Table 2. Probabilities of high wear insert images to be of some class.
| Image 1 | Image 2 | Image 3 | Image 4 | |
|---|---|---|---|---|
| Medium wear | 0.51866305 | 0.6532518 | 0.5108754 | 0.5324518 |
| High wear | 0.47833866 | 0.33923936 | 0.480641 | 0.44897473 |
| Low wear | 0.002657221 | 0.0071650357 | 0.008182266 | 0.018294167 |
| No wear | 0.000341077 | 0.000343807 | 0.0003013296 | 0.00027929 |
3. Other Classifications
Here, confusion matrices for the remaining categories are presented as follows: 0–6 s after machining (Table 3), 6–12 s after machining (Table 4), 0–12 s after machining (Table 5).
Table 3. Confusion matrix for the tool wear classification for images taken 0–6 s after machining.
| ACTUAL | |||||||
|---|---|---|---|---|---|---|---|
| No Wear | Low Wear | Medium Wear | High Wear | Sum | Precision | ||
| PREDICTED | No wear | 19 | 0 | 1 | 0 | 20 | 95.0% |
| Low wear | 0 | 20 | 0 | 0 | 20 | 100% | |
| Medium wear | 1 | 0 | 19 | 1 | 21 | 90.5% | |
| High wear | 0 | 0 | 0 | 19 | 19 | 100% | |
| Sum | 20 | 20 | 20 | 20 | Accuracy: 96.25% | ||
| Recall | 95.0% | 100% | 95.0% | 95.0% | |||
Table 4. Confusion matrix for the tool wear classification for images taken 6–12 s after machining.
| ACTUAL | |||||||
|---|---|---|---|---|---|---|---|
| No Wear | Low Wear | Medium Wear | High Wear | Sum | Precision | ||
| PREDICTED | No wear | 20 | 0 | 0 | 0 | 20 | 100% |
| Low wear | 0 | 20 | 0 | 0 | 20 | 100% | |
| Medium wear | 0 | 0 | 20 | 0 | 20 | 100% | |
| High wear | 0 | 0 | 0 | 20 | 20 | 100% | |
| Sum | 20 | 20 | 20 | 20 | Accuracy: 100% | ||
| Recall | 100% | 100% | 100% | 100% | |||
Table 5. Confusion matrix for the tool wear classification for images taken 0–12 s after machining.
| ACTUAL | |||||||
|---|---|---|---|---|---|---|---|
| No Wear | Low Wear | Medium Wear | High Wear | Sum | Precision | ||
| PREDICTED | No wear | 39 | 0 | 1 | 0 | 40 | 97.5% |
| Low wear | 0 | 40 | 0 | 0 | 40 | 100% | |
| Medium wear | 1 | 0 | 39 | 1 | 41 | 95.1% | |
| High wear | 0 | 0 | 0 | 39 | 39 | 100% | |
| Sum | 40 | 40 | 40 | 40 | Accuracy: 98.16% | ||
| Recall | 97.5% | 100% | 97.5% | 97.5% | |||
The performance of the model is represented most intuitively by accuracy [6], so all four classifications were compared by this evaluation indicator (Figure 2).
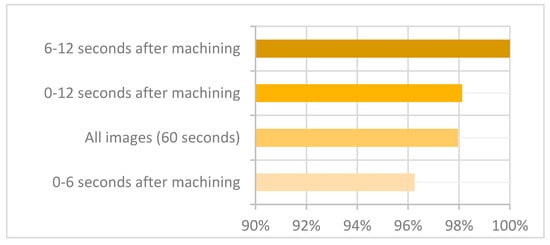
Figure 2. Accuracy for different classifications.
Figure 2 shows the accuracies of classifications for each dataset. The exceptional 100% accuracy was achieved for images in the category “6–12 s after machining”. That includes the moment when a cutting tool just leaves the workpiece, with the temperature gradient on the insert still clearly visible.
The Neural Network reached highly accurate predictions on the other datasets as well, namely 96.25% or more.
One crucial piece of information is hidden in the fact that the CNN did not make any predictions at the extremes of a diagonal in the confusion matrix. The model managed to avoid classifications of the “no wear” inserts into “high wear” class, and vice-versa. This information is very significant from a practical point-of-view, because such an error could represent high risk for damage and waste in the work process. It is assumed that, with an expansion of the training dataset, it is possible to enhance the classification’s accuracy additionally.
The analysis of the false classifications points to the incorrect predictions for at most two subsequent images. Most often, there was only one. If the algorithm was set in a way that it analyses, e.g., three subsequent images and determines the wear based on three identical classifications in a row, all false decisions could have been eliminated.
4. Discussion
The proposed study addresses the question of whether the condition of the cutting tool can be monitored using an IR camera. Thermographic images are analysed using Deep Learning, more specifically a Convolutional Neural Network. A turning tool was monitored for 60 s after the cut finished. The images were divided into different groups depending on the time of acquisition. The conclusions are as follows;
-
The cutting tools were successfully divided into groups according to their suitability for further machining, also taking into account the type of machining (fine/rough).
-
The proposed method was confirmed to be suitable for the TCM system.
-
The tool can be monitored immediately after cutting or a few seconds later (e.g., when the tool turret is in home position).
-
The accuracy for classifying the thermographic images ranged from 96.25% (0–6 s after machining) to 100% (6–12 s after machining).
The results are more than encouraging compared to similar studies: 85% accuracy for 37 tools that were divided into two groups GO or NO GO, according to the conformity of the part produced [7]; 5%, 10.7%, and 22% errors for estimated tool wear for milling tools [8]; 80% and 93% accuracy for tool breakage prediction using the Backpropagation Neural Network and CNN, respectively [9]; 6.7% absolute mean relative error between image processing systems based on an Artificial Neural Network and the commonly used optically measured VB index (Flank wear) [10]. Proposed smart system based on CNN and thermographic images is more accurate than other similar TCM systems.
The presented smart system for Tool Condition Monitoring and defining the suitability of the turning tool for further machining has shown high potential for industrial use due to its high accuracy, relatively low investment cost, and direct applicability of the decisions made. In line with the idea of Industry 4.0, decisions are shifted from humans to intelligent systems.
4. Future
The intelligent model for cutting tool wear and defect monitoring determines the tool state based on the thermographic image. The information crucial for the end-user (the machine operator) is whether the tool in question is still adequate for the type of intended machining or if it needs to be replaced. In the future, the aim is to develop a system that would serve recommendations to the operator about the cutting tool change. An algorithm will be constructed which will reduce the possibility of random false classifications of the cutting tool wear.
Additional experiments will enable the expansion of the training dataset. The trained model will be tested on a new workpiece material and at altered machining parameters (cutting speed, feed rate, cutting depth, cutting tool). The research will be extended to the use of cooling/lubrication fluids, which is commonly used in industry. This way, the robustness of the trained model on unfamiliar conditions can be studied.
This entry is adapted from the peer-reviewed paper 10.3390/s21196687
References
- Kang, W.; Derani, M.; Ratnam, M. Effect of Vibration on Surface Roughness in Finish Turning: Simulation Study. Int. J. Simul. Model. 2020, 19, 595–606.
- Piotrowski, N. Tool Wear Prediction in Single-Sided Lapping Process. Machines 2020, 8, 59.
- Kuntoğlu, M.; Aslan, A.; Pimenov, D.Y.; Usca, Ü.A.; Salur, E.; Gupta, M.K.; Mikolajczyk, T.; Giasin, K.; Kapłonek, W.; Sharma, S. A Review of Indirect Tool Condition Monitoring Systems and Decision-Making Methods in Turning: Critical Analysis and Trends. Sensors 2021, 21, 108.
- Kuntoğlu, M.; Salur, E.; Gupta, M.K.; Sarıkaya, M.; Pimenov, D.Y. A State-of-the-Art Review on Sensors and Signal Processing Systems in Mechanical Machining Processes. Int. J. Adv. Manuf. Technol. 2021, 116, 2711–2735.
- Brili, N.; Ficko, M.; Klančnik, S. Automatic Identification of Tool Wear Based on Thermography and a Convolutional Neural Network during the Turning Process. Sensors 2021, 21, 1917.
- Choi, T.; Seo, Y. A Real-Time Physical Progress Measurement Method for Schedule Performance Control Using Vision, an AR Marker and Machine Learning in a Ship Block Assembly Process. Sensors 2020, 20, 5386.
- Mamledesai, H.; Soriano, M.A.; Ahmad, R. A Qualitative Tool Condition Monitoring Framework Using Convolution Neural Network and Transfer Learning. Appl. Sci. 2020, 10, 7298.
- Chi, Y.; Dai, W.; Lu, Z.; Wang, M.; Zhao, Y. Real-Time Estimation for Cutting Tool Wear Based on Modal Analysis of Monitored Signals. Appl. Sci. 2018, 8, 708.
- Li, G.; Yang, X.; Chen, D.; Song, A.; Fang, Y.; Zhou, J. Tool Breakage Detection Using Deep Learning. arXiv 2018, arXiv:1808.05347.
- Mikołajczyk, T.; Nowicki, K.; Kłodowski, A.; Pimenov, D.Y. Neural Network Approach for Automatic Image Analysis of Cutting Edge Wear. Mech. Syst. Signal Process. 2017, 88, 100–110.
This entry is offline, you can click here to edit this entry!