The interfacial contact area between an electronically conducting and an ionically conducting phase is the area where an electrode meets an electrolyte or an electrolyte solution. This area may differ significantly from the geometric, microscopic, real, or true surface area of the electronically conducting solid (the electrode) determined with a variety of experimental methods. This contact area may also differ from the electrochemically active surface area. These different surface or interface areas are relevant in electrochemical energy conversion and storage. They are not necessarily identical; there are even no simple relationships between them. This entry provides an overview of the various terms, briefly describes experimental methods for their determination and puts the data in perspective with respect to electrochemical energy conversion and storage.
- electrochemically active surface area
- geometric surface area
- true surface area
- BET-method
- po-rosimetry
- double layer capacity
- exchange current
- exchange current density
1. Introduction
In electrochemical energy conversion and storage EES phenomena, structure and processes relevant for conversion and storage are located at the interface between the electronically conducting phase (in oversimplification frequently called “the electrode”) in physical contact with the ionically conducting electrolyte, in most cases the electrolyte solution [2]. Whether this combination shall be called more precisely the electrode instead of just naming the electronically conducting phase is more than a semantic detail: A wire of lead in contact with a solution of sulfuric acid behaves fundamentally different from the same lead wire in a solution of perchloric acid; this has been pointed out before. Because of the inherent heterogeneity of electrochemical processes the amount of contact area is of fundamental importance in conversion and storage devices utilizing the interfacial or double layer capacity in supercapacitors as well as in devices employing Faradaic processes in transformation reactions for storage proceeding at this interface.
Corresponding with this fundamental importance determination or measurement of this contact or interfacial area is of major importance with all devices. Design of interfacial architectures aiming at optimized specific surface areas SSA (not necessarily biggest values) is also of considerable interest. Applied terminology varies and appears to lack clear and commonly accepted definitions. In addition measured and reported data vary with employed methods, when combined with the imperfectly defined terminology confusion is a likely result. Research and engineering aiming at improved performance of EES devices frequently focuses on this interfacial area, in reports either obtained data are reported or – more frequently – improved performance is claimed and both are related to changes (mostly increases) of interfacial area. For critical evaluation as well as fair appreciation comparable measurement and data reporting standards are fundamental. Some details inspected below shall provide support to this. First the double layer and supercapacitors will be addressed, secondly charge transfer.
1.1. The electrochemical double layer
An electrochemical double layer EDL is formed whenever an electronically conducting phase (e.g. a metal, graphite, an n-doped semiconductor or a hole-conducting p-doped semiconductor) is brought into contact with an ionically conducting phase (e.g. an electrolyte solution). Properties, structure and behavior have attracted scientists from various fields including surface scientists, electrochemists, tribologists, and biologists for a long time already. The capacitor-like behavior of the EDL noticed in the studies of Lippmann [3,4], Perrin [5],Gouy [6-8], Stern [9], Helmholtz [10], Chapman [11,12], and others has been considered frequently in experiments more like an unwelcome burden causing a charging, non-Faradaic current. Researchers looking into the basics of electrochemistry have investigated structure and dynamics of the electrochemical interface systematically, they did not try trying to compensate the effects as commonly done for example in polarography by adding a supporting electrolyte in sufficiently big amount. The leading work by Grahame [13] has been highlighted earlier in [14], for a more overview see [15]. Ion and solvent molecule dynamics in the ionically conducting phase adjacent to this interface (the electrolyte solution) in particular when not related directly to charge transfer (see below) with respect to abrupt changes of e.g. electrode potentials/cell voltage or current have been discussed before [16]. With respect to the current understanding of the theoretical foundations wetting of materials, in particular for electrochemical double layer capacitors EDLCs, has been examined [17].
Experimental values of this electrochemical double layer capacity (the technically correct term seems to be capacitance, but electrochemists seem to prefer the former one or use both as synonyms) reported in μF·cm-2 (more precisely of true or of geometric or of electrochemically active surface area (see [1]) are influenced by several parameters and factors like identity of the electronically conducting material (metal or else), its crystallography, on the composition of the electrolyte solution, the concentration of the electrolyte etc. [18,19]. A commonly quoted value is 20 μF·cm-2 for a perfectly flat surface of a metal in contact with a moderately concentrated aqueous electrolyte solution. This comes very close to a value calculated in eq. 1 with the Helmholtz-model for a parallel-plate condenser with
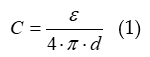
with permittivity ε = 6 F·m-1 and distance d = 300 pm yielding C = 18 μF·cm-2. Reported results going from C = 15 μF·cm-2 up to C = 50 μF·cm-2 have elsewhere been discussed [20]; for various types of graphite an even broader range of numbers from 3 to 70 μF·cm-2 has been reported [21,22]. For practical applications in electrochemical energy storage reported experimental values are too low. Capacitance values found for so-called electrolytic capacitors with respect to the geometric electrode surface are much larger [23-26], but this is due to a roughness of the metal foil electrodes artificially produced yielding a much larger true interfacial area. This capacitance depends also on the interfacial properties of the thin layer of Al2O3 or another valve metal oxide like Ta2O5 placed as a dielectric between the metal, the ionically-conducting electrolyte (solution) and the counter electrode.
Practical double layer capacity numbers exploded into technologically relevant values with the reports and following patents of Becker [27] and Rightmire [28] (more details of the technological developments are found in [29]) with experimental observations for porous carbon electrodes. The huge surface area of activated carbon powders pressed into pellets then used as porous electrodes in contact with aqueous electrolyte solutions provided double layer capacitances of many Farads with small porous pellet electrodes a technically realistic possibility. Two such electrodes inserted into a joint electrolyte solution enabled the respective double layer capacitances CDL1 and CDL2 acting as two capacitors connected in series. According to eq. 2 the effective capacitance C of the device is only

its actual value C is still impressive.
Establishment of the double layer and changes of structure and composition are exclusively based on movement of (ionic) charge carriers in the ionically conducting phase; adsorption or specific adsorption of ions are of minor importance if at all. Charge storage, changes of electrode potentials and thus in a complete cell storage and release of energy proceed exclusively by ion accumulation and dispersion with the respective countercharges in the electronically conducting phases. As highlighted by eq. (1) the interfacial properties (which are amenable to external changes only to a very limited extent by using e.g. solvents of different permittivity’s for the electrolyte solution) control the specific capacitance, the surface area controls the actual capacitance of an electrode and thus of a cell. The interest in determining, increasing and optimizing the participating interfacial area is just a logical consequence.
1.2. Pseudocapacitive behavior
Redox-active materials strongly attached to the electrode surface (because they are insoluble in the electrolyte solution like many metal chalcogenides [30] or because of formation of an insoluble polymer [31]) show redox activity upon changes of electrode potential in their range of electrochemical redox-activity with a current/potential-behavior like a capacitor or the electrochemical double layer capacity. This similarity has resulted in the suggestion of “pseudocapacitive” as a designation for this behavior [32], for an overview see [33], a further critical discussion can be found in [34]. The frequently used term “pseudocapacitor” for the resulting device lacks logic and is more of a linguistic aberration. Recorded current values can exceed those for the double layer capacity by factors 10 to 100 [33], again they increase in absolute terms with a growth of the electrode surface area. Accordingly there is a major interest in knowledge of this surface area and – if applicable and promising – its increase and optimization.
1.3. Faradaic reactions
Kinetic data of electrode reactions for an electrode in an EES provided as exchange currents I0 are calculated with respect to the surface area A of the electrode, they are given as exchange current densities j0 = I0/A, as heterogeneous rate constants k0 or for standard concentrations finally as standard exchange current densities j00 [35,36]. Calculation of the latter quantities again needs knowledge of the surface area A of the electrode. For well-defined single crystal surfaces or liquid metal electrodes (mercury, see above), the geometric surface area Ageo is well defined; and the true surface area Atrue is equal to the geometric surface. Because deviation (the overpotential η) of the electrode potential E with a flow of current from its value E0 at rest, i.e. without a flow of current, critically depends on the current density and thus on the surface area with larger surface area implying a lower current density and thus smaller deviations and finally losses (for details see e.g. [2]) knowledge of the participating surface area, its improvement and optimization, are of outmost importance.
For electrode reactions with sufficiently fast charge transfer, i.e. under diffusion control, it can be assumed, that roughness with typical dimensions smaller than the diffusion layer thickness δN might not have any influence on I0 because the diffusion layer cannot conformally follow these small features, but instead will average them out. This has been observed before [37-40]. Nevertheless, the value of EASA as obtained typically from double layer capacitance determination should certainly depend on roughness. Thus, j0 should not depend on roughness at small roughness values. To identify this “maximum roughness” where an electrode can be assumed as smooth in determination of j0 is of significant practical value when identifying catalytic activity of an electrode material. If this concept is not correct, a claimed enhanced catalytic activity may actually be an effect of increased surface area (for further discussion see e.g. [47,69]). This unease becomes even more central for porous electrodes.
2. Electrode surface areas
Following the various types of surface areas are described and put into perspective with respect to each other. Their relevance to supercapacitors and battery electrodes is highlighted whenever relevant.
In case of rough (but not automatically porous or 3D) electrodes the true surface area Atrue (not to be mixed up with the electrochemically active surface area EASA; sometimes also called ECSA [41]) may differ significantly from the geometric area as well as from other surface areas addressed below. The roughness factor Rf (also named fr [42]) given as the ratio of true surface area Atrue vs. geometric surface area Ageo according to
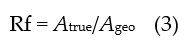
reflects this ratio. In the context of this entry, the term “roughness” is applied in a very simplified sense: It simply reports the ratio of EASA vs. geometric surface area. Consequently an EASA larger than the geometric surface area because of a few and very fine roughness features generated by electrodeposition of a small amount of metal is not distinguished from one caused by roughening with abrasive paper leaving scratches and other coarse, almost macroscopic features. In the first case the roughness may have typical features smaller than the diffusion layer thickness relevant in electrode kinetics with effects indicated above, but the coarse roughness features generated by the mechanical roughening may be big enough to enable a conformal diffusion layer to be. If the discussed consequences apply only in the second case the Faradaic current I0 caused by the electrode reaction will be greater than for a surface without these features. The range of very large roughness values is of further particular interest. Possibly there is a range wherein roughness numbers typical of porous electrodes associated with large EASA may have a significant fraction of EASA inside the rough, i.e. porous, layer. Once more, the diffusion layer will not follow these features, and the noticed growth in EASA will not affect significantly j0 = I0/A. Accordingly a further growth of EASA and Rf will not be reflected in a growing I0 (for a discussion see e.g. [45,46]).
The preceding considerations address only geometric/topographic surface area aspects, they do not reflect surface properties except for a detail in the method of temperature-programmed desorption TPD of adsorbed oxygen (see below). This may suffice for electrode reactions running fast on almost every electrode surface (in most cases outer-sphere-reactions). But already numerous redox reactions applied in redox flow batteries have been recognized as highly sensitive to the electrode material’s surface properties [47,69]. Presumably, many of these reactions are inner-sphere-reactions with considerable adsorptive interactions of reactants with the electrode surface.
Different surface sites, for example basal plane sites and edge sites of graphite, may have significantly different adsorption properties and consequently different electrocatalytic activities. Such variations in surface properties may also be related to electronic solid-state properties [43] and can also show up in varying double layer capacity values going e.g. for graphite from 3 to 70 μF·cm-2 [21,22]. With more complex electrode reactions (for example the electroreduction of dioxygen, for an overview see [2]) and inhomogeneous (polycrystalline) surfaces of metals the situation becomes even more complex. Electrode reactions may proceed only, or mostly, fast at selected surface sites (surface defects, heteroatoms) or fractions of the surface with particular crystallographic orientation (e.g. edge sites of graphite [44]). Obtaining an exchange current density with respect to this area of “active surface” will be even more complicated or possibly impossible. For non-3D graphitic materials with basically only two types of surface sites (edge and basal plane sites) with significantly different activities such distinction and calculation may be feasible.
For felts, fabrics, and other porous and 3D-materials the relationship between e.g. the Ageo of a graphite felt disc and its true surface area is perhaps even more complex. To avoid this dilemma calculation of j0 based on the surface area ABET measured with the BET-method (see below) has been proposed [44] despite much earlier critical examinations of the relationship between BET-surface area, exchange current, exchange current density and actually utilized electrode surface area [45,46]. Therein the use of BET-surface area in calculations of j0 was concluded as being problematic at least, possibly inadequate. Taking into consideration the actual surface area has been addressed as needed previously [47]. Increases of electrocatalytic activity claimed sometimes may simply an effect of increased surface area without any increased specific catalytic activity. Definition of a total surface area the result of BET-surface area multiplied with sample density divided by height of an electrode (a graphite felt in this study) as proposed elsewhere [44,48] obviously has not improved understanding, consequently its use seems to be very limited. The lack of any relationship between BET-surface area and EASA has again been highlighted more recently, the use of microelectrodes as an option for experiments with applied large current densities has been recommended [49].
True surface area may also be different from EASA because of incomplete wetting or only partial electrolyte penetration into a porous electrode also resulting in partial wetting and utilization of internal surface area [45,50]. True surface area can be measured with several methods. Presumably the gas-adsorption method according to Brunauer−Emmett−Teller (BET) is used most frequently [51-53]. The gas used in the experiment may significantly influence the obtained values of surface area, consequently the results must always include details of the employed gas. The measured values can only approach the true surface area as they include only those parts of the true surface area, which are accessible to the adsorbed gas. The internal surface area of small or very small pores (micro- and nanopores) which are not accessible for the selected gas may not be included.
Porosimetry with various liquids (alcohols, mercury etc.) can be applied to measure pore volume inside a porous material and pore size distributions. In a following step, the surface area may be derived from these data by assuming pore shapes, sizes and their distribution [54].
Temperature-programmed desorption of adsorbed oxygen can be applied to materials with sufficient interactions with dioxygen. Obtained results may specify different fractions of the total found area assigned to surfaces with different reactivities. Surface showing no reactivity at all might be ignored. Further surface differences in terms of reactivity will be discussed following.
Reviews and overviews of at least selected methods of measurement of surface areas are available; they will be addressed below.
Rough surfaces of nonporous materials can be studied with atomic force microscopy (AFM). Surface areas can be calculated from obtained surface topographies [55] utilizing in addition the capacitive component of the equivalent circuit element assigned to adsorption (presumably of species in the dioxygen evolution reaction studied in this investigation) used in the evaluation of impedance data as a reference. Authors have suggested that this capacity reflects the surface area active in this adsorption process. They finally propose the use of this reaction for determination of surface area of oxidic electrocatalysts.
EASA may differ from the above mentioned surface areas in terms of numerical values, it is also qualitatively different: Just the interface (more precisely the electrochemical interface) between the ionically and the electronically conducting phases participating in the electrode reaction is addressed.
Measurements of EASA have been a frequent subject of research, numerous reviews are available [1,42,56-58]; for further details and descriptions of selected methods see also [49,55,59-62]. Material-related problems observed with specific substrates like palladium have been studied [63]. The various methods include measurement of the differential double layer capacity CDL from impedance or cyclic voltammetry data [64], a range of electrochemical relaxation techniques [65], determination of the charge associated with adsorbed carbon monoxide oxidation, oxidative stripping of adsorbed hydrogen atoms, and underpotential metal deposition. Specific challenges in data acquisition and evaluation with porous electrodes during cyclic voltammetry have been addressed [66-68].
Mostly without saying explicitly the geometric surface area is used nevertheless in calculations of j0. The apparent or geometric surface area of highly porous or 3D-materials like graphite felts can be measured easily, this area (for example, of a graphite felt disc) is mostly used in reporting. Schweiss et al. [44] noticed in an attempt to determine true surface areas by various methods significant differences of exchange current densities calculated with respect to geometric electrode surface area and something apparently closer to true surface area. This property named variously carbon surface area, total carbon surface area and total surface area of carbon (just within a few lines of the report) for different felt materials (carbon or graphite felt, activated graphite felt) used as electrodes in a redox flow battery RFB is presumably the CDL discussed elsewhere in this text as measured with impedance measurements performed at the electrode potentials where the positive and negative electrodes were operating. Values of j0 calculated (as done generally) using the geometric surface area of the felt supported the repeated claim of poorer kinetics of the negative electrode as compared to the kinetics of the positive one. Calculations based on the other measure of surface area instead yielded similar values of j0 for both positive and negative electrode reactions. Initially, this might seem to be irrelevant for the actual user interested only in low charge transfer overpotentials. In discussions of methods to increase electrocatalytic activity this conclusion may become very important when transferring results of electrocatalytic studies obtained with smooth materials to felt materials (for more details see e.g. [69]). Merely when considering active surface area true electrocatalytic effects depending on e.g. attachment of expensive catalyst material or complicated surface treatment can be distinguished from effects of simple surface area enlargement.
In studies of electrodes prepared by e.g. particle deposition the geometric electrode area (beyond the apparent surface area of the support) is difficult to determine by most of the non-electrochemical methods described above, instead surface areas determined by the electrochemical methods presented above may be used. Evidently, the j0-data obtained with these surface areas are not exactly compatible with those based on geometric surface areas since the latter do not take into account any roughness effects whereas the former data implicitly and unavoidably contain such effects. Reports based on the use of EASA instead of geometric surface areas when reporting kinetic data are rare [70-72]. The obvious inconsistencies present with porous materials have been addressed with respect to fuel cell electrodes [73] and to RFBs [44,69]. Using geometric surface areas in Tafel-evaluations of catalytic activity of Co3O4 for oxygen evolution resulted in artificially overblown activity values [73]. A more adequate method suitable to identify the relevant surface area could not be recommended.
The need for careful surface area considerations has been highlighted also in a comparative benchmark study of catalysts for the dioxygen evolution reaction [74] and in a study of electrocatalysts for electrochemical water splitting [75]. In a somewhat confusingly entitled study, the specific role of the reference electrode and electrode potential determination with it in kinetic overpotential studies has been reported [76].
3. Conclusions
The calculation of exchange current densities as the pivotal number characterizing the electrocatalytic properties of an electrode for a Faradaic reaction requires knowledge of the value of the involved electrode surface area. The numerous electrochemical and non-electrochemical methods yield experimental data, which differ significantly in most cases because of the different operating principles of the employed methods. So far no single “truly correct” surface area has been identified. Accordingly reporting of any value of j0 must include details of applied methods in order to enable a comparison with previously reported data and to assess achieved progress in terms of electrocatalytic activity.
Glossary
Ageo: geometric surface area determined by calculation using the mechanical dimensions of an electrode
ABET: surface are determined using the BET-method
Areal: same as Atrue
Atotal: The sum of all surface area components on the outer surface and inside of macro-, meso- and micropores.
Atrue: The actual, real surface area taking into account roughness, porosity and whatever contributes to the surface area
ECSA: electrochemically active surface area
EASA: electrochemically active surface area
j0: exchange current density
Rf: roughness factor
SSA: specific surface area in m2 per gram of material
This entry is adapted from the peer-reviewed paper 10.3390/batteries8100146