It is generally recognized that sight is the most important sensory perception used to collect information while driving, comprising up to 90% of the total information collected. It is of great importance that those objects and stimuli that must be perceived to drive safe, are the ones that will be the first to be observed and located by the driver. It is especially demanding when objects are perceived using mirrors in the vehicle. For the above reasons, an experimental study was carried out, which includes the evaluation of the distance with/without rear-view mirrors in the vehicle. The results show the difference in the estimation of distances when a rear-view mirror is used and when the rear-view mirror is not used. The test objects were various colors, so the results involve also this aspect of perception. The above results play an important role in improving the safety of all road users.
- rear-view mirror
- traffic safety
- perception
- distance
1. INTRODUCTION
It is generally acknowledged that the eyesight is the most important way of sensory perception used in gathering information during driving, comprising up to 90% of total gathered information. It is very important that those objects and stimuli that must be perceived to maintain road traffic safety while driving be the ones that are first perceived and located by the driver (CIE Publication, 137-2000). As visibility is the ability of distinguishing particular situations conditioned by light, its determinants in the conditions of driving could be expressed in the form of visibility distance and visibility rate, which are dependent on road and weather conditions. The visibility distance is the minimum distance at which an object cannot be clearly distinguished from its surroundings when viewed in 3D space. Visibility rate presents an ability to distinguish objects characteristics: its colour, shape, etc. (Škerović et al, 2011).
In the study conducted by Gudzulić and Baroš in 2008 it is observed that the change in body position affects distance perception at the distances longer than 1m, i.e., 3m and 5m. The basis of visual system function is the projection of light rays which carry information about the object on retina and projects on it a two–dimensional picture. As a consequence of the retinal projection of a picture, the third dimension, the depth, is lost. The distance is reconstructed further during the perception process with the help of so-called depth cues. According to Palmer (1999), distance cues can be categorized in different ways. The most commonly used terms are binocular/monocular cues and relative/absolute distance cues. Binocular cues are available from both eyes, whereas monocular cues are available from only one eye. Relative/absolute distance cues provide information about relative distance and absolute distance, respectively. It is also very important to note that some cues provide numerical information about distance (quantitative), while others only indicate whether objects are closer or farther away (qualitative). Some of them provide absolute information, whereas others provide only relative information. Gogel (1978) distinguished between two kinds of distance cues. Egocentric cues determine the perceived distance of a point or object from the observer, providing perceived egocentric distances. For researchers, perceived egocentric distance (or simply perceived distance, absolute distance) is a representation of the distance between oneself and an object (Woods et al, 2009). Exocentric cues indicate the perceived or distance between points or objects, providing perceived exocentric distances (Gogel, 1978). We should also mention the type of information a cue can provide. According to Sweet and Kaiser (2011), some cues provide only ordinal information (e.g., "Object B is behind Object A"), others provide relative information (e.g., "Object B is twice as far away as Object A"), while still others may provide absolute information (e.g., "Object B is 2 units away and Object A is 1"). Visual information can provide a numerical value of distance (quantitative information), or just the relation of distances of two objects, near-far (qualitative information), (Palmer, 1999). Man’s visual system makes mistakes in distance assessment in some cases even though there are depth cues present (so called optical illusions) (Ross and Plug, 2002). In the earlier studies it has been concluded that the position of the body, head and eyes affects spatial perception (Kaufman and Rok, 1962), so that the perception while driving with the rear-view mirror and without the rear-view mirror may result in different distance assessments, which can be relevant result in traffic safety.
In the study conducted by Roy in France in 2011 it was determined that 20% of the drivers drives with the eyesight weaker than 0.8 (80%), and that in France 8 million drivers in total participates in traffic with the eyesight lower than 50%. Also, at the same time 29% of the drivers does not use any optical aid although it is recommended. The research conducted in the UK determined that a third of drivers do not check their vision regularly. According to the World Health Organization, 285 million people has some type of visual impairment (including 19 million children), 80% of visual impairment is preventable, and it is important to point out that 90% of visually impaired live in developing countries (WHO, 2014).
In a study conducted in the Netherlands in 2010, 1.5% of drivers older than 75 years drive with visual acuity below the statutory minimum (50%). In Italy, in 2009 study was conducted by the University of Milan, by which it was established that even 32.17% of the tested drivers do not meet any of the criteria for obtaining or renewing a driver's license. 16.67% of them had visual acuity of less than 50% (Maffioletti, 2009).
A study conducted in Croatia by the end of 2011 (Petriček, 2011) showed that in 2011, 27% of the drivers did not have optimal vision (100% correct vision), which is nearly a third more than in 2010 (20%). The average in European countries is 23%. In Croatia, among drivers over 40 years, 11% of them drive with visual acuity below the statutory minimum (80% correct vision). The same survey shows that 46% of drivers who wear glasses have not checked them in the last 2 years, and 2% never have. 13% of drivers who do not wear glasses has never been on the eye exam, while 58% of drivers surveyed said that they have problems with driving at night (56% of men and 63% women).
It is interesting, more men do not want to acknowledge the problem with driving at night, though vision control shows extremely poor eyesight (20%). Data from the United Kingdom for the year 2012 show that over 2,000 traffic accidents had for its cause inadequate vision, resulting in damage of 33 million pounds and 3,000 injured person (IRTAD, 2013). On the contrary, the study conducted by Charman in 1997 did not find any association between lower colour vision and traffic accidents (Charman, 1997). In a number of countries (USA, Canada, United Kingdom ...) when you access the driving test examiner checks visual acuity of candidates for the drivers, simply by asking him to read a license plate at a distance of 20 meters.
Blind spots in passenger vehicles are very often considered as a problem in the literature (Chun et al, 2013; Vincent, 2013; Pitchipoo, 2014). A common way to reduce blind spots is to use rear view mirrors in the vehicle. The study conducted by O'Brien in 2004 shows the costs and benefits of proper use of rear-view mirrors in the vehicle and it justified the introduction of additional rear view mirrors in large goods vehicles (O'Brien 2004). The above-mentioned problem is much more pronounced in trucks, especially when it comes to goods vehicles with a trailer. The new regulation on the rear-view mirrors in the vehicle 2003/97 / EC (European Commission, 2004) aims to increase the field of view around the trucks. New commercial vehicles in Europe are equipped with rear view mirrors that have to meet the new regulations. Trucks (weighing more than 8t) according to previous European regulation on the rear view mirrors in the motor vehicles (71/127 / EEC (European Commission, 1971)) were equipped with at least three rear view mirrors on the passenger side and one on the driver's side. The new regulation 2003/97/EC requires additional rear view mirror for the driver's side and one at the front of the vehicle. It is also allowed to use surveillance system with a camera instead of a frontal rear view mirror. A study conducted in 2011 states that countries have focused transportation policy towards the implementation of this directive. The cited study does not mention that on the territory of the Republic of Serbia the directive has been implemented (McGrath, 2011).
Within its vehicle safety check activities, the DEKRA company performs studies analysing the visual field in passenger vehicles (DEKRA, 2022). There are two categories of research results, the ones using rear view mirrors settings in the vehicle according to the old regulations (71/127/EC) and the second category of the results obtained from the use of rear-view mirrors settings, according to the new regulations (2003/97/ EC). The results showed that the wide-angle rear-view mirrors in the vehicle, which are set by the old legislation, have medium values which are very close to the target (desired) value. Using wide-angle rear-view mirrors in the vehicle set according to the new regulations did not produce the expected results. Consequently, this means that in many cases advantages of the new rear view mirrors in the vehicle cannot be fully exploited, because the rear-view mirrors are helping more in noticing a details at the side of the truck and / or trailer while others angles are neglected.
Blind spots in passenger cars are also of great importance for road safety. They are mainly caused by the presence of A, B and C pillars. The problem is limited to a two-dimensional plane and is thus much smaller than in commercial vehicles: trucks have a third dimension as far as blind spots are concerned. This problem is a consequence of the height difference between the truck driver's eyes and the eyes of other road users (e.g. pedestrians or drivers of passenger cars). The eyes of truck drivers are approximately at a height of 2.5 m for most European trucks (weighing more than 8 tons), while the eyes of pedestrians are at a height of 1.6 m (for an average man). In addition to the height of the driver's eye, there are three important influential factors that determine the size of the blind spot. One is the height of the lower edge of the windscreen and then also side windows shape. The third is the horizontal distance between the driver and the window. These three factors influence the way that blind spots outside the truck will be visible (Niewoehner, 2009).
The distribution of visual attention while driving is a key element to prevent traffic accidents (Ciceri and Ruscio, 2014), and the less blind spots the driver has around his vehicles, contributes to safer driving. A study by Kidd and Brethwaite shows that smaller vehicles have a lower area of blind spots, while larger vehicles (SUVs) have a larger area of blind spots, particularly at the rear of the vehicle (Kidd and Brethwaite, 2014). Proper use of rear-view mirrors in the vehicle reduces the number and area of blind spots.
In addition to practical experiments for analysing the use of rear-view mirrors in the vehicle, there are a variety of computer simulations. Such simulations are applied to a wide range of vehicles, which are currently used by car manufacturers. In addition to the tests that are conducted prescribed by applicable international standards, specific procedures are aimed to optimize and test visibility using rear view mirrors in the vehicle (Carfagna and Landi, 2002).
Contribution of the rear-view mirrors in the vehicle is evident, as technical resources for the improvement of traffic safety and considerable help to drivers of motor vehicles for safe participation in traffic. The studies mentioned in this paper are mostly engaged in the use of rear-view mirrors in the vehicle in order to reduce blind spots (blind zones), and what is the importance of the same for certain categories of motor vehicles. The goal of this study is to investigate how rear-view mirrors affect distance estimation by drivers.
2. METHODOLOGY
The experiment was performed in a closed laboratory, which is illuminated by natural light. In a laboratory rear view mirror and four boxes are placed, identical in shape and size, different colours (Figure 1.).

Figure 1. Environment and facilities used in the experiment
2.1. Description of boxes used in the experiment
For this test were used four boxes were identical in shape, with a height of 25 cm, 36 cm in length, and 26 cm in width. The boxes are wrapped in different colours:
Box 1: A coated yellow reflective foil,
Box 2: A coated blue reflective foil,
Box 3: A coated red paper wrap, without reflection,
Box 4: A coated green paper wrap, without reflection.
The choice of colour boxes was carried out on the basis of colour, which is predominantly used in traffic signs. The light signals at traffic lights include red and green. All traffic warning signs and some signs of explicit orders are also lined with red (e.g., the sign "traffic is prohibited for pedestrians" (II-17) denoting a road or road section where traffic is prohibited for pedestrians). Some traffic signs of explicit orders and information are blue. Traffic signs of "marked crosswalk" for example, consist mainly of a blue color, along with some traffic signs of explicit order (a sign "pedestrian way" (II -41), which indicates a path that pedestrians must take, and other road users are not permitted to use). Yellow, as the brightest, most visible and most vocal colours, which exists on all the signs related to work on the road, on certain signs of the notification, at traffic lights for cars and cyclists, as well as the individual elements of horizontal signalization, was the color on the fourth coloured box. The sign "Men at work" (I-19) denoting the place where the works are performed on the road, has a base of yellow (Rules on traffic signs, 2020).
2.2. The position of the rear-view mirror
In the experiment, the rear-view mirror is placed at a height of 1.2 m from floor level. The first box is set at 4.5 m from the place where test subject was sitting, the other at 5.5 m, and the third and fourth to 6 m and 7 m from test subject, respectively. The task was to first adjust the rear-view mirror so you see all the boxes behind it, and then to estimate the distance from the box (Figure 2.). The second part of the task consisted in the fact that the subject stood up from where he sat, looked at the box in front of him and estimate distance without rear view mirrors. After that the test subjects fills survey on demographics and answer questions related to the driving test, the frequency of driving motor vehicles (Trifunović et al., 2022; Ivanišević et al., 2022; Trifunović et al., 2017).
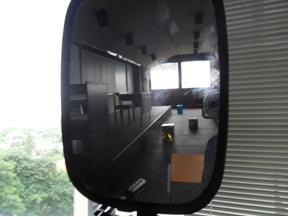
Figure 2. View at the boxes with the aid of the rear-view mirror while participating at the experiment
2.3. Data analysis
The survey was placed on the Google Drive platform to facilitate data collection and processing. Normality of distribution was tested by inspection of the histogram and the Kolmogorov-Smirnov test. Since the distribution of all interval variables significantly deviate from the normal distribution, we used the nonparametric method. To assess the significance of differences were used Kruskal-Wallis's and Mann-Whitney's rank sum test U-test and Wilcoxon rank test (test of equivalent pairs). Null hypothesis was set (H0), which was as follows: There is no statistically significant difference between the groups and alternative hypothesis (Ha) which is as follows: There is statistically significant difference between the groups. Threshold of statistical significance (α) set at 5%. Therefore, if p ≤ 0.05, H0 is rejected and Ha accepted, and if p> 0.05 H0 is accepted (Pešić et al., 2019).
3. RESULTS
3.1. Descriptive statistics
The experiment involved 16 participants, aged from 19 to 22 years. A larger number of test subjects were males (9) while 7 test subjects were females. Driver's license "B" category has 68.75% of the test subjects, 12.5% and 6.25% of test subjects have a driver's license "B and E" and "B and A" categories, respectively, while other test subjects were in driving school (12.5%). 6.25% of test subjects have driver’s licenses for less than a year, 75% of test subjects between one and three years, and 6.25% between three and five years, while other participants are in driving school. Every day 37.5% of test subjects drive, 12.5% between three and five times a week, 25% less than three times a week, 6.25% fewer than three times per month, 6.25% less than three times a year, while other respondents attend training in driving school. Since the topic of study is perceiving distance using rear view mirrors, test subjects were taken data on the use of spectacles or contact lenses. Specifically, 62.5% of respondents who participated in the experiment do not use eyeglasses or contact lenses, while 37.5% of respondents used eyeglasses or contact lenses.
3.2. Distance perception
The first analysis of data relates to the influence of colour to estimation of distances with and without a rear-view mirror. Based on the results of descriptive statistics (Figure 3.) it can be concluded that the average distance for the colours yellow and blue shorter when test subjects estimate distance using rear-view mirrors, while the standard deviation is higher for any colour when the assessment is performed with the aid of rear-view mirrors (except for blue when equidistance). It can also be concluded that yellow is perceived as the closest by means of a mirror, then blue and red, and as the furthest green, while green is perceived as the closest without a mirror, then blue and yellow, and as the furthest red.
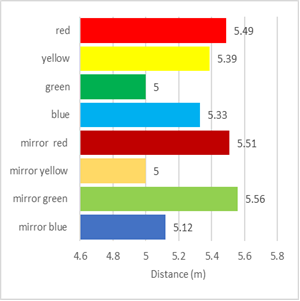
Figure 3. Results of distance estimations based on the colors
Based on the Pearson correlation, we found a statistically significant relationship and a highly significant positive correlation between the colors of the boxes in the estimation of the distance with and without mirrors, i.e. based on the estimation of the distance of one color, we can predict the estimation of the distance of any of the other colors (with or without mirrors). Based on the results of normality distribution, to analyse the results we used nonparametric tests, Mann Whitney and Kruskal Wallis, which showed statistically significant differences. In addition to this statistical analysis, based on the recommendations of textbooks "SPSS survival manual" (Pallant, 2011) using the Wilcoxon rank test (test of equivalent pairs) showed a statistically significant difference in the estimated distances with and without rear view mirrors for colour blue (z = -3.025; p = 0.003) and red (z = 2.684, p = 0.009). On basis of the results of the sum of the ranks for the colour blue with and without rear-view mirrors, it can be concluded that the estimated distance is less with the rear-view mirror. Regarding the red-colored box, the sum of ranks with a rear-view mirror is greater than the sum of ranks without a rear-view mirror, so it can be concluded that the distance at which the red box is estimated is greater if a rear-view mirror is used.
Based on Tables 1 and Figure 4. it can be concluded that for smaller values of the distance (4.5 m and 5.5 m) one underestimates the distance using a rear-view mirror, whereas for higher values (6 m and 7 m) overestimates the distance. If this trend, for estimation of distances using rear-view mirrors, is also valid for distances greater than 7 m, we have a big problem, because the drivers think they have a greater distance available, so they behave accordingly (e.g., assessment of distance vehicles using rear-view mirrors, when the driver decides to brake, thinking that the car behind at a greater distance from actual).

Figure 4. The average value of the distance estimation with and without a rear-view mirror for various distances
Table 1. Descriptive statistics of the results of estimation of distances for different estimated distances
|
|
Rear-view mirror 7m |
Rear-view mirror 6m |
Rear-view mirror 5,5m |
Rear-view mirror 4,5m |
7m |
6m |
5,5m |
4,5m |
|
N |
Valid |
82 |
82 |
82 |
82 |
82 |
82 |
82 |
|
Miss. |
0 |
0 |
0 |
0 |
0 |
0 |
0 |
|
|
Mean |
6,96 |
5,71 |
4,65 |
3,95 |
6,5 |
5,5 |
5,32 |
4,18 |
|
Std. Error of Mean |
,2092 |
,1686 |
,1360 |
,1354 |
,16 |
,14 |
,119 |
,112 |
|
Median |
6,150 |
5,500 |
4,500 |
4,000 |
6,0 |
5,1 |
4,50 |
4,00 |
|
Mode |
7,00 |
5,00 |
4,00 |
3,00 |
7,0 |
5,0 |
4,50 |
4,00 |
|
Std. Deviation |
1,99 |
1,71 |
1,13 |
1,30 |
1,3 |
1,4 |
1,03 |
0,99 |
|
Variance |
3,591 |
2,332 |
1,518 |
1,504 |
2,1 |
1,6 |
1,18 |
1,03 |
|
Minimum |
4,00 |
2,00 |
3,00 |
2,00 |
4,0 |
3,0 |
4,00 |
2,00 |
|
Maximum |
14,00 |
11,00 |
8,00 |
8,00 |
10, |
9,0 |
8,00 |
7,00 |
|
Sum |
531,9 |
459,3 |
371,2 |
315,5 |
500 |
449 |
379 |
338 |
|
Percentage |
25 |
5,00 |
4,50 |
3,675 |
3,00 |
5,0 |
4,5 |
4,00 |
|
50 |
6,150 |
5,500 |
4,500 |
4,000 |
6,0 |
5,1 |
4,50 |
|
|
75 |
7,00 |
6,50 |
5,050 |
4,500 |
7,0 |
6,5 |
5,50 |
4. CONCLUSION
The most important findings of executed and in paper analysed and explained experiment are:
• Using rear-view mirrors, yellow can be perceived as the nearest, then blue and red, and green is perceived as the most distant;
• Closest without rear-view mirrors is perceived green, then blue, and yellow and red colour is the farthest;
• Standard deviation has greater value when estimating distances with a rear-view mirror for all colours except for blue (when equidistance);
• There is a statistically significant difference in the assessment of distance with and without rear-view mirrors, for blue and red;
• For blue, estimated distance is less when using rear view mirror compared to the assessment without a rear-view mirror, while the red colour is reverse (distance at which the red box is, is estimated as higher, when using a rear-view mirror);
• Warm colours (yellow and red) are seen as further if using a rear-view mirror, as opposed to cold colours (blue and green), which are perceived closer if used a rear-view mirror to estimate distances;
• When the value of the distance is lesser (4.5 m and 5.5 m), one underestimates the distance while using rear-view mirrors, and at the same time overestimates for higher values (when an object is located at distances of 6 m and 7 m).
These results are of great importance for road safety, especially overestimation of distance for more than 6m. Also, it has been shown that different colours are perceived differently by using rear-view mirrors in terms of distance estimation, which can be used primarily for the analysis of accidents that occurred when the vehicle was backing up. Future studies should confirm the results and strengthen the interpretation of the research presented in this paper. Also, future research should be directed at increasing distances from the rear-view mirror, introduction of new facilities, different colours, sizes and shapes of the stimulus, conducting experiments at various visibility conditions (morning, noon, evening, night, in foggy conditions). The next research can be directed toward the rear-view mirror variations (different sizes and shapes of rear-view mirrors, as well as different types and forms of glass).
Acknowledgements
The authors acknowledge the constructive comments of two anonymous reviewers, which have helped in significantly improving this paper. This study was supported by The Ministry of Education, Science and Technological Development of Serbia (project 36027, 36022 and 36006).
References
- Charman, W. N. (1997). Vision and driving‐a literature review and commentary. Ophthalmic and Physiological Optics, 17(5), 371-391.
- Chun, J., Lee, I., Park, G., Seo, J., Choi, S., & Han, S. H. (2013). Efficacy of haptic blind spot warnings applied through a steering wheel or a seatbelt. Transportation research part F: traffic psychology and behaviour, 21, 231-241.
- Ciceri, M. R., & Ruscio, D. (2014). Does driving experience in video games count? Hazard anticipation and visual exploration of male gamers as function of driving experience. Transportation research part F: traffic psychology and behaviour, 22, 76-85.
- DEKRA. (2022). Safety Check. https://www.dekraauto.co.za/safety-check
- Passenger Transportation, Accident Prevention Strategies on Europe‘s Roads.
- European Commission - Enterprise and Industry. Directive 2003/97/EC. 29.01.2004.
- European Commission - Enterprise and Industry. Directive 71/127/EWG. 22.03.1971.
- Gudzulić, V., Baroš, M. (2008). Upside-down world - importance of vestibular information in distance perception, Psychology. 22, 81-95.
- Kaufman, L., & Rok, I. (1962). The Moon Illusion. In Held R. Richards (Ed.), Perception: Mechanisms and Models. San Francisco: W.H. Freeman and Company. pp. 260-268
- Kidd, D. G., & Brethwaite, A. (2014). Visibility of children behind 2010–2013 model year passenger vehicles using glances, mirrors, and backup cameras and parking sensors. Accident Analysis & Prevention, 66, 158-167.
- Law on Road Traffic Safety. (2020). Official Gazette of the RS", No. 41/2009, 128/2020.
- Maffioletti, S., Pocaterra, R., & Tavazzi, S. (2009). The importance of precise sight correction for safe driving, Undergraduate Degree Course in Optics and Optometry.
- McGrath, M. (2011). Published Project Report PPR588, A study of the implementation of Directive 2007/38/EC on the retrofitting of blind spot mirrors to HGVs. Transport Research Laboratory.
- Niewoehner, W. (2009). How to Use Mirrors. In Proceedings of the 21st (Esv) International Technical Conference on the Enhanced Safety of Vehicles, Held June 2009, Stuttgart, Germany.
- O'Brien. (2004). Cost benefit analysis on blind spot mirrors - final report. Jacobs consultancy.
- Palmer, S. E. (1999). Vision science: Photons to phenomenology. MIT press.
- Pešić, D., Trifunović, A., Ivković, I., Čičević, S., & Žunjić, A. (2019). Evaluation of the effects of daytime running lights for passenger cars. Transportation research part F: traffic psychology and behaviour, 66, 252-261.
- Petriček. I. (2012). How our drivers see - the results of vision tests among our drivers. Clinic for eye diseases KBC Zagreb, Zagreb.
- Pitchipoo, P., Vincent, D. S., Rajini, N., & Rajakarunakaran, S. (2014). COPRAS decision model to optimize blind spot in heavy vehicles: A comparative perspective. Procedia Engineering, 97, 1049-1059.
- Ross, H., & Plug, C. (2002). The Mystery of The Moon Illusion-Exploring Size Perception. The Mystery of The Moon Illusion-Exploring Size Perception, 288.
- Škerović, V., Gordić, M., Galović, N., Djuretić, A. (2011). Visibility parameters as a key aspect of pedestrian crossing safety. 9th International Conference Traffic Safety in the Local Community, Divčibare.
- Trifunović, A., Pešić, D., & Čičević, S. (2022). Experimental Study: Children’s Perceptions Expressed Through Drawings and Coloring. Perceptual and Motor Skills, 00315125221104780.
- Trifunović, A., Pešić, D., Čičević, S., & Antić, B. (2017). The importance of spatial orientation and knowledge of traffic signs for children's traffic safety. Accident Analysis & Prevention, 102, 81-92.
- Ivanišević, T., Ivković, I., Čičević, S., Trifunović, A., Pešić, D., Vukšić, V., & Simović, S. (2022). The impact of daytime running (LED) lights on motorcycles speed estimation: A driving simulator study. Transportation research part F: traffic psychology and behaviour, 90, 47-57.
- Vincent, D. S., Pitchipoo, P., & Rajakarunakaran, S. (2013). Elimination of blind Spots for heavy transport vehicles by driver seat design. In Int Conf Adv Manuf Auto, Kalasalingam University, India.
- World Health Organization. (2014). Visual impairment and blindness, WHO.