Your browser does not fully support modern features. Please upgrade for a smoother experience.
Please note this is an old version of this entry, which may differ significantly from the current revision.
Subjects:
Geography, Physical
This basin is one of the most radioactively contaminated and studied in Central Russia. Over the past three decades, under the conditions of the decreasing snowmelt runoff in the spring and reduced share of cultivated land over the post-Soviet period, the intensity of the 137Cs transfer has decreased. The 137Cs deposit losses associated with erosion activities do not exceed a few percent.
- fluvial geomorphology
- erosion
- Chernobyl accident
- radiocesium technique
1. Transformation of Radioactive Contamination on Arable Slopes
The redistribution of the sediments and Chernobyl 137Cs on the slopes was the main direction of the research carried out in the first decades after the accident because it enabled us to identify the primary transformation of the contamination to assess the sediment budgets on the slopes and slope sub-catchments over the post-Chernobyl period. According to studies conducted in the mid-1990s, 11 years after the Chernobyl fallout is too short a time window for substantial 137Cs losses from the cultivated slopes due to soil erosion. An increase in the 137Cs deposits only occurred in the local sediment sinks (up to 1.5–2 times on the bottoms of the uncultivated parts of hollows) [47]. The hollow systems on the cultivated slopes are the most important pathway for the transport of sediments beyond the cultivated fields. The boundaries “cultivated slope/valleys’ side” and “valleys’ sides/dry valleys’ bottoms” are the zones in which a substantial portion of the mobilized sediments are redeposited [48].
According to the combined use of the radiocesium and magnetic tracer methods, there was a clear trend towards decreasing erosion rates for the post-Chernobyl period on the cultivated slopes of the forest-steppe zone compared with the 150 years of active ploughing. The main reasons for the decline were the decreases in the intensity of the snowmelt runoff on the slopes in the spring and the proportion of row crops in the crop rotation [130]. Moreover, according to the magnetic tracer, the intraslope sediment deposition depends on a complex of local factors and can take place on any part of the slope [131]. The delivery of sediments and particulate 137Cs beyond arable slopes is determined not only by the configuration of the slope, but also, to a large extent, by the anthropogenic relief, including the plough ramparts along the field boundaries. Plough ramparts (so-called “napash’”) are an important barrier for both sediment and sediment-associated 137Cs [80].
The loss of material on the slopes led to a consistent reduction in the 137Cs deposits. To estimate the reduction in the deposits, researchers used the proportional conversion model [115] in the reverse order. researchers independently estimated the erosion rates, and researchers converted them into the relative reduction in the 137Cs deposits [132]:
where X is the relative reduction in the 137Cs deposits (%); Y is the erosion/accumulation rate (t ha−1 year−1); T is the number of years; B is the soil density (bulk density) (kg m−3); and d is the ploughing depth (m).
X = (10 × Y × T)/(B × d),
Given the mean rate of erosion of 6.4 t ha−1 year−1 on the arable slopes of the Plava River basin [104] and excluding the segments of the basin that are limited by artificial sinks [133], the maximum mass of the mobilized sediments was no more than 16 × 106 t over 1986–2012. This value might be overestimated because it contains the results of the universal erosion equation (USLE) calculations, which do not consider the intraslope accumulation.
The proportion of sediments that entered the valley bottom network was about 61.6%. researchers based this estimation on the values of the sediment delivery ratio (SDR) for slopes of different morphologies, which researchers obtained after the generalization of several observations [134] and the morphometric analysis of the relief of the Plava River basin [133]. A total of 38.4% of all the mobilized sediments were redeposited on the slopes, which amounted to 6.1 × 10⁶ t.
Using the available large-scale maps of the radioactive contamination and the results of our survey [135], researchers calculated the net loss of the 137Cs deposits from the cultivated slopes. In just 26 years after the accident, the total 137Cs deposit losses caused by erosion were about 12.2 × 10¹² Bq (recalculated for 1986). Considering the overestimation of the erosion rates, the average annual 137Cs deposit losses from the cultivated slopes amounted to no more than 0.2% of the total 137Cs fallout. According to the results of the first experimental work on the study of the reduction in the 137Cs deposits on the cultivated slopes of the Chernobyl-affected zone, with the use of artificial sprinkling, the reduction in the deposits due to erosion does not exceed a few percent. The slope runoff for the year (1995–1996) led to a 137Cs deposit reduction of only 0.07% [136].
2. Sediment and Particulate 137Cs Redistribution along Pathways from Catchment Area to Watercourses
Dry valleys (“balka”) occupy the main extent of the fluvial network of the Upa River basin. A major portion of sediment that is transferred by the temporary streams from the arable slopes is redeposited on the dry valley bottoms. The intensity of the sediment redeposition primarily depends on the slope of the valley bottom [137]. According to the assessment made for the Plava River for the period 1986–2009, about 60% of the sediments that had washed away from the cultivated slopes did not leave the catchments of the first–third Hortonian orders [104]. The proportion of sediment carried outside the catchments of the valleys of the fourth Hortonian order, as a rule, does not exceed 10% [74,138,139]. The average “slope-river valley” SDR for the entire basin of the Plava River is 0.27, excluding segments of the basin cut off by artificial reservoirs. The main source of the material inflow into the valleys of the Plava River and its tributaries is the catchments of small valleys of 1–2 orders that flow directly into them. The bottoms of the dry valleys of the 3–4-order catchments are the main sediment sinks [104].
The sediments that accumulate on the bottoms of dry valleys, in the artificial reservoirs that are constructed on them, and on river floodplains, which are discussed below, are an important source of information for studying the dynamics of the erosion and accumulation processes over the period dated with 137Cs from the global and Chernobyl fallouts [140]. The increase in the 137Cs deposits in these sediment sinks is so intense that it can compensate for the losses from radioactive decay. However, layers with a high concentration of 137Cs are overlapped by sediments with much lower concentrations eroded from arable land [141]. The total accumulation in the dry valley bottoms of the Plava River basin over the post-Chernobyl period amounted to 4.3 × 10⁶–6.1 × 10⁶ t.
3. Floodplain Accumulation of Sediment and 137Cs
According to studies on the floodplain complexes of the Lokna, Plava, and Upa Rivers, there is a high spatial unevenness in the accumulation of sediments and radionuclides. Moreover, there is a substantial difference between the sedimentation rates at the different levels of the Lokna River floodplain. On the lower floodplain, the sedimentation rate is 0.3–1.1 cm year−1. This growth is high enough to overcome the 137Cs losses due to radioactive decay. On the middle floodplain, the accumulation for the post-Chernobyl period is low due to the decreasing spring flood levels associated with the reduction to almost zero in the surface runoff from the slopes during snowmelt [142].
The Plava River floodplain, where the accumulation rates on the low floodplain change in the range of 0.7–1.4 cm year−1, produced similar results [143]. researchers primarily explored the floodplain sedimentation on the Upa River valley bottom in the middle and lower reaches starting from the mouth of the Plava River. researchers evaluated two additional sections upstream and downstream of the Schekino Reservoir (see Figure 4). The low level of the floodplains is discontinuous and represented by rather narrow sections. For the period 1986–2014, the sedimentation rates on the low level of the floodplain reached 1.5–2.7 cm year−1. Thus, there was a consistent increase in the sediment accumulation rate as the water discharge increased along the Upa River, which was most likely associated with the increase in the duration of the flooding of the low floodplain. A major portion of the particulate 137Cs, which entered the Upa River channel, was delivered to the Oka River.
The downtrend surface runoff during snowmelt, especially after 2007 (see Figure 3), resulted in a decrease in the level and duration of the flooding in spring, and a reduction in the contribution of the hillslope erosion to the sediment yield in the Upa River basin. Consequently, the impact of the contaminated sediment transported by the Plava River on the level of the contamination of the Upa River declined [50].
The floodplain complex is primarily formed due to the action of fluvial processes. The lateral supply of the material from the sides of the valleys only plays a substantial role during ploughing. Due to the large area of the high floodplain and small amount of information on the accumulation rates, a direct reliable assessment of the accumulation is complicated. The main accumulative component of the sediment balance on the surface of the high floodplain under the rare high flood conditions and dense vegetation cover, which traps the sediments, is the erosion on the hillslopes directly adjacent to the sides of the river valleys [144].
The total transfer to the river valleys of the Plava River basin for the period 1986–2012 was 3.8 × 10⁶–5.6 × 10⁶ t, of which 1.6 × 10⁶–1.7 × 10⁶ t accumulated on the river floodplains. researchers estimated the sediment yield by the residual principle in the range of 2.1 × 10⁶–4 × 10⁶ t.
4. Sediment Budget of Sub-Basins of Upa River Basin: Plava River and Upper Reaches of Upa River
By summarizing the results of the estimations represented above, researchers could assess the sediment budget of the entire Plava River. researchers present the results in graphical form in Figure 9. The accuracy and reliability of the obtained results are affected by the totality of the errors and limitations of all the particular applied methods. However, researchers can consider these results to be the most detailed and factually substantiated for the river basins of Central Russia, which have been subjected to intense radioactive contamination.
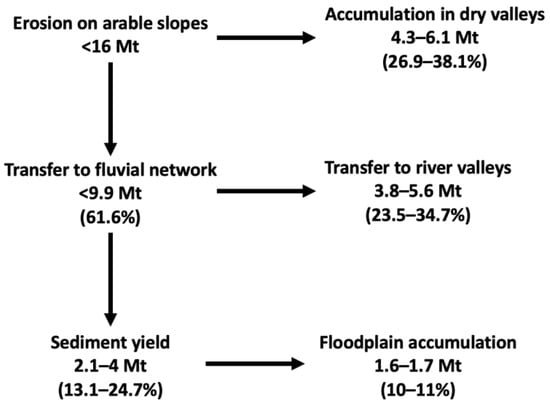
Figure 9. Preliminary sediment budget of Plava River for 1986–2012.
In comparison with the Plava River, the corresponding values for the upper reaches of the Upa River are much lower. According to the mathematical modelling of the erosion and SDR distribution over the catchment, during 1986–2018, 4.6 × 10⁶–4.8 × 10⁶ t of sediment was eroded from the cultivated slopes, and 0.44 × 10⁶–0.47 × 10⁶ was delivered to the permanent streams [66]. It is likely that researchers underestimated the systematic sediment delivery to the rivers. Currently, the Schekino Reservoir is a large sink for the sediments and particulate 137Cs delivered from the upper reaches of the Upa River. The observed decrease in the concentration activity towards the surface of the bottom sediments clearly demonstrates the general trend towards a decrease in the 137Cs content in the river sediment yield for the post-Chernobyl period [124,125,145]. The overlapping of the most active strata of sediments, with less polluted sediments under modern conditions, serves as a factor in increasing environmental safety [145]. According to the analysis of the vertical distribution of the 137Cs in the bottom sediments sampled in 2018–2019 [125], sediment accumulation during the post-Chernobyl period only occurred in the flooded channel of the Upa River, which occupies a relatively small part of the reservoir bottom area (Figure 10A). When assessing the total accumulation within the boundaries of the water area, researchers divided the riverbed into sections depending on the location of the selected cores, which researchers took as characteristic of the sections (Figure 10B).
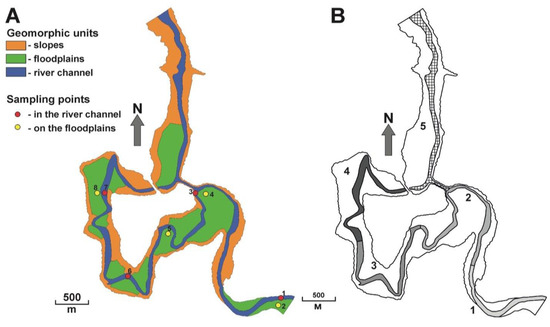
Figure 10. (A) Geomorphic structure of Schekino Reservoir bottom with locations of sampling points; (B) locations of sections (marked with numbers 1–5) arranged for calculations for river channel to assess accumulation for post-Chernobyl period.
researchers calculated the accumulation using the following formula:
where WRes is the total accumulation in the reservoir (t), and Wn is the accumulation within the boundaries of the individual sections (t). researchers calculated the accumulation within n selected sections with the following formula:
where Hn is the mass depth of the “Chernobyl peak” in the sediment column (kg m−2), and Sn is the area of the corresponding section (m2).
WRes = W1 + … + Wn,
Wn = Hn × Sn,
researchers present the results in Table 5. The total mass of the accumulated sediments was more than 0.37 × 10⁶ t (Table 5). Considering that researchers only determined the volume of the sediments accumulated since 1986 for the upper larger part of the reservoir, and a part of suspended sediments can still cross the dam, the resulting estimate should be considered an a priori underestimation.
Table 5. Mass depth of “Chernobyl Peak” and areas and masses of sediments in selected sections of the flooded channel of Schekino Reservoir for the post-Chernobyl period.
| Section | Core | Mass Depth of “Chernobyl Peak” (kg m−2 1) | Area (m2) | Accumulated Sediments (t) |
|---|---|---|---|---|
| 1 | 1 | 406 | 114,200 | 46,365 |
| 2 | 3 | 520 | 175,000 | 91,620 |
| 3 | 6 | 845 | 157,700 | 133,266 |
| 4 | 7 | 629 | 162,800 | 102,401 |
| Total | 0.37 × 10⁶ | |||
1 According to Ivanov et al., 2021 [125].
According to the estimates made using the RUSLE model, the total washout from the catchment area for the period under review amounted to 4.64 × 10⁶–4.78 × 10⁶ t, of which river valleys reached 0.44 × 10⁶–0.47 × 10⁶ tons, or less than 10% [97].
According to the analysis of the particle size distribution of the longest of the sampled sediment cores (№6) (see Figure 10A and Table 5), there was a trend towards a smooth increase in the proportion of coarser mechanical fractions (Figure 11A) and, accordingly, an increase in the median size (d50) of the bottom sediment particles to the surface of the sediment layer (Figure 11B). researchers expected this distribution considering the decrease in the supply of material enriched with clay fractions from the arable slopes and the increase in the proportion of coarser material formed due to the bank erosion and incision of the river channels.
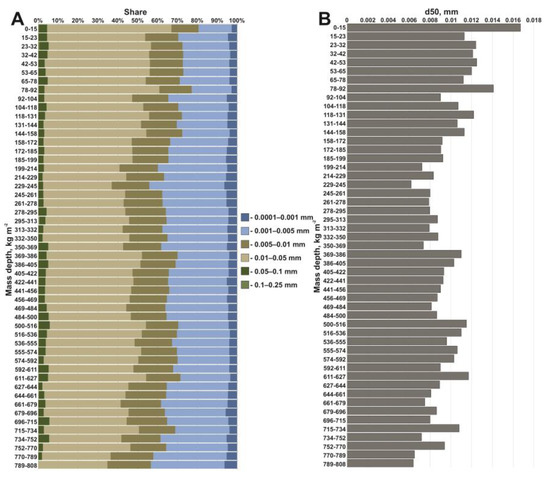
Figure 11. Grain-size composition of bottom sediments accumulated after 1986: (A) proportion of particles of different sizes; (B) median particle sizes (d50) (according to data from Core 6).
Based on the obtained balance estimates, researchers calculated the indicators of the sediment yield modulus for the Plava and upper reaches of the Upa River basins. The obtained values are quite close to the established values based on the monitoring studies at the gauging stations of the Hydrometeorological Service, located on the rivers of the Oka River basin, with a catchment area of the same order (Table 6).
Table 6. Calculated sediment yield for Plava and upper reaches of Upa River basins in comparison with corresponding values of other rivers of forest steppe and south of forest zones in Oka River basin, which researchers obtained based on long-term observations of water and suspended sediment discharge (based on Golosov, 1989 [146]).
| River | Basin Area (km2) | Share of Arable Lands (%) | Sediment Yield (t km−2 Year−1) |
|---|---|---|---|
| Plava | 1880 | 58.2–84.8 | 43.4–82.7 |
| Upper Reaches of Upa | 1350 | 61.2–71.3 | 8.6 |
| Zusha | 6000 | 67 | 53 |
| Atmiss | 2310 | 70 | 63 |
| Lomovka | 1110 | 40 | 40 |
| Vad | 1930 | 45 | 8.9 |
| Vysha | 2190 | 50 | 43 |
| Pronya | 3520 | 64 | 21 |
Considering the overestimation of the erosion rates within the Plava River basin, researchers should assume that the SDR value of the entire basin is also systematically overestimated. However, the results obtained for both studied catchments fit well into the range of estimates made for the rivers of the East European Plain with the close areas of their catchments (Table 7).
Table 7. Comparison of SDR values of Plava River and upper reaches of Upa with river basins of Oka River system [147].
| River | Basin Area (km2) | Share of Arable Lands (%) | SDR |
|---|---|---|---|
| Plava | 1880 | 58.2–84.8 | 13.1–24.7 |
| Upper Reaches of Upa | 1354 | 61.2–71.3 | 7.7 |
| Lomovka | 1110 | 40 | 15 |
| Vysha | 2190 | 50 | 25.3 |
| Pronya | 2300 | 62 | 2.9 |
| Atmiss | 2310 | 70 | 19.7 |
| Osetr | 3020 | 64 | 5.0 |
5. Particulate 137Cs Budget of Plava River and Upper Reaches of Upa River
researchers obtained the results based on the assumed equality of the ratios of the sediment budget components (Figure 10) and mobilized deposits of particulate 137Cs (Equation (2)) in the Upa River basin for the post-Chernobyl period (Table 8).
Table 8. Distribution of 137Cs deposits between different sediment budget components of Plava River basin in 1986–2012.
| Sediment Budget Component | 137Cs Deposits (Bq 1) |
|---|---|
| Hillslope erosion | 12.2 × 10¹² |
| Intraslope accumulation | 4.7 × 10¹² |
| Transfer to fluvial network | 7.5 × 10¹² |
| Accumulation in dry valleys | 3.3 × 10¹²–4.6 × 10¹² |
| Transfer to river valleys | 2.9 × 10¹²–4.2 × 10¹² |
| Floodplain accumulation | 1.2 × 10¹²–1.3 × 10¹² |
| Sediment yield | 1.6 × 10¹²–2.9 × 10¹² |
1 Recalculated to 1986.
According to the estimates presented in Table 8, for the period 1986–2012, from 0.41 to 1% of the initial Chernobyl fallout of 137Cs was carried out outside the basin of the Plava River in particulate form. Considering the likely overestimation of the hillslope erosion, the total delivery of the particulate radionuclides to the receiving watercourse (the Upa River) did not exceed 0.83% of the initial fallout.
An alternative approach is to use Equation (3), from which researchers obtained the results presented in Table 9. researchers considered two values of the estimated sediment yield of the Plava River. The first option has already been described above and presented in Figure 10. Considering the landscape and geomorphological similarity of the catchments, in the second option, researchers assumed the proximity of the value of the sediment yield of the Plava River to the corresponding value of the upper reaches of the Upa River. researchers estimated the mean 137Cs concentration activity in the sediment runoff of the Plava River from samples taken at the low floodplains [143,144]. researchers estimated the sediment yield and concentration activity in the sediments for the upper reaches of the Upa River based on the results of a study on the bottom sediments of the Schekino Reservoir [125].
Table 9. Evaluation of particulate 137Cs deposits transferred with sediment yield beyond Plava River and Upper Reaches of Upa River.
| Basin | Plava River | Upper Reaches of Upa River | |
|---|---|---|---|
| Mean 137Cs concentration activity in sediments over post-Chernobyl period (Bq kg−1) | 868 1 | 1081 2 | |
| Sediment yield (106 t) | 2.1–4 3 | >0.37 4 | >0.37 |
| 137Cs deposits in sediment yield over post-Chernobyl period (1012 Bq) | 1.88–3.47 | >0.32 | >0.4 |
| Share of total 137Cs fallout (%) | 0.65–1.2 | >0.11 | >0.21 |
In conclusion, all the estimations show that less than 1.5% of the Chernobyl fallout 137Cs left the observed catchment over almost three decades. Given the underestimation of the accumulation in the Schekino Reservoir, the total deposits of the particulate 137Cs in the sediment yield of the Plava River and upper reaches of the Upa River (in the absence of the Schekino Reservoir) were more than 0.1% of the initial fallout. researchers expected such a low value due to the current rates of the erosion processes on the arable land and the peculiarities of the redistribution of the sediments along their transfer routes from the arable slopes to the permanent watercourses, and due to the reduction in arable land after 1991.
This entry is adapted from the peer-reviewed paper 10.3390/land12010175
This entry is offline, you can click here to edit this entry!