A perovskite catalyst combined with various advanced oxidation processes (AOPs) to treat organic wastewater attracted extensive attention. The physical and chemical catalytic properties of perovskite were largely related to oxygen vacancies (OVs). OVs were able to alter the chemical, physical, and electronic properties of materials, so they became one of the most important research subjects. It was usually necessary to observe and analyze the phenomenon caused by OVs; however, due to their low concentration and short existence time, OVs were normally not visible to the naked eye. The relative concentration of OVs ranged from PPM to tens of atomic percent, a condition that was difficult to find a fitting experimental plan to characterize and distinguish OVs.
oxygen vacancy
advanced oxidation processes
perovskite
1. Spectral Detection Methods
Thinking over the kinds of constraints in each technique, it was sometimes not convincing to prove the existence of OVs with just one technique. In the early research, various electron microscopes and radiation instruments, such as UV-vis and XRD, were used to characterize OVs in perovskite. In recent years, more advanced techniques that included HRTEM and EELs were used to characterize and gain insight into OVs in perovskite catalyst.
1.1. X-ray Photoelectron Spectroscopy (XPS)
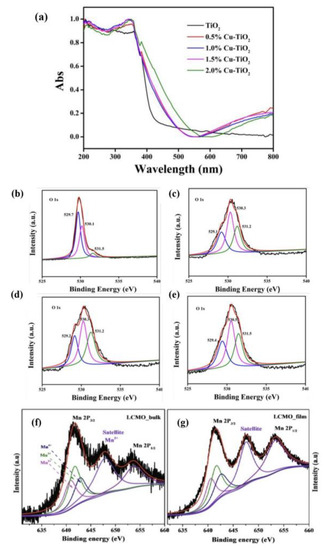
X-ray photoelectron spectroscopy (XPS). It was one of the most important characterization techniques for analyzing OVs, which was characterized by the difference in the atomic number ratio of metal ions to lattice oxygen. XPS and others were employed together to analyze the structures of perovskites and concentrations of OVs. TiO2 was obtained with distinctive concentrations of OVs by synthesizing a series of TiO2 samples with different Cu-doping concentrations by Liang et al. [91]. Although pure TiO2 could not absorb the visible light, UV-vis diffuse reflectance spectroscopy could easily detect the presence of OVs in TiO2 samples. As the copper-doping concentration climbed, the intensity of absorption in the visible area increased, which led to the remarkable rising of the concentration of OVs (Figure 3a). More information about OVs in Cu-doped TiO2 samples was displayed in the O 1s XPS (Figure 3b–e). By curve fitting, O 1s area precisely showed three peaks, which corresponded to lattice oxygen, surface hydroxyl oxygen, and adsorbed oxygen. They were located at 529.5, 530.5, and 531.5 eV.
Figure 3. (a) UV-vis diffuse reflectance spectra of TiO2 samples with different Cu loadings, XPS spectra of O 1s on the surface of (b) TiO2, (c) 0.5% Cu-doped TiO2, (d) 1.5% Cu-TiO2, and (e) 2.0% Cu-doped TiO2 samples, and XPS spectra of Mn 2p core level of (f) LCMO bulk and (g) LCMO film [91,92].
Magray et al. [92] used a solid–state method and a laser deposition method to prepare La2CoMnO6 bulk (LCMO-B) and La2CoMnO6 films (LCMO-F), respectively. For the purpose of detecting OVs in the above two perovskites, rapid responding XPS measurements were performed. Figure 3f,g illustrates the Mn 2p XPS spectrum of LCMO-B and LCMO-F, respectively. Firstly, the background was used for the best fit, and then the normalized spectrum was used to figure out the charge states of Mn ions. Mn4+, Mn3+, and Mn2+ peaks were fitted to the Mn 2p 3/2 peak. Manganese in the sample was present in the Mn2+ state because of the satellite peak at 647.9 eV. This confirmed the presence of OVs in these samples. However, the peak intensity of Mn3+ and Mn2+ in LCMO-F was higher than that in LCMO-B, indicating that LCMO-F had more OVs. XPS detection technology could reflect the presence of OVs from the side, rather than directly detect the concentration.
1.2. Raman Spectroscopy
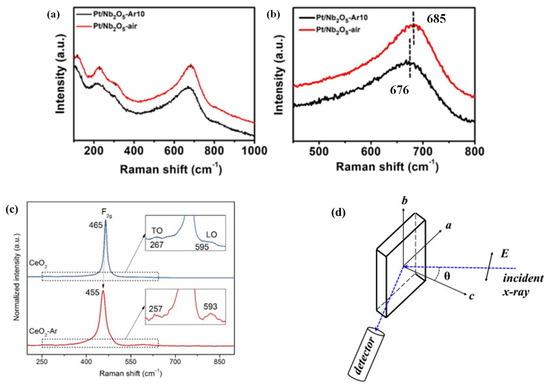
Raman spectroscopy was widely applied in studying various defects, such as OVs caused by ion doping and so on, because the characterization method was high-efficiency and sensitive to the structure and bond order of perovskites [93]. For example, the chemical coordination structures of Pt/Nb2O5-AR10 (PNO-A) and Pt/Nb2O5-air (PNO-a) were studied by Raman spectroscopy. The peaks after several times magnification are shown Figure 4a,b. It could be clearly seen that in PNO-A, the peak concentrated at 685 cm−1, while the peak of PNO-a shifted to 676 cm−1, which could generate more OVs under Ar reaction.
Figure 4. (a) Raman spectra of the representative Pt–based catalysts and (b) magnification of the peaks located at 450–800 cm−1. (c) Raman spectra of the CeO2 and CeO2-Ar catalysts. (d) Schematic diagram of the polarized EXAFS measurement geometry [93,94,95,96].
The influence of OVs on NO selective reduction by CeO2 was also investigated. Zhang et al. [94] found that the OV of CeO2 roasted in the Ar atmosphere was higher than that of the roasting in ambient air. Figure 4c illustrates the Raman spectra of the two catalysts. Usually, the strain and the defect in the lattice caused the Raman band position and shape of the F2g mode at 465 cm−1. The F2g oscillation frequency of the CeO2-AR catalyst was changed to 455 cm−1. The sample was calcined at 600 °C and then cooled to room temperature. Therefore, no residual strain was found in the lattice of CeO2. Therefore, the inferred Raman band position shift might indicate that there were OVs in CeO2-AR.
1.3. The X-ray Absorption Microstructural Spectrum (XAFS)
XAFS was developed on the basis of synchrotron radiation. The excited photoelectrons were dispersed by the surrounding atoms as X-rays passed through a sample, which resulted in an energy oscillation. The local electronic and geometric formation of the detected specimen could be obtained by detecting these oscillatory indicators [95].
The location of OVs of Sr2CuO3+δ was developed in a high-temperature superconductor by polarized extended X-ray absorption fine structure (EXAFS) by Wang et al. [96] The characterization analysis was that OVs were distributed in the material plane and apical position, about 10% and 8%, respectively. By rotating Sr2CuO3+δ around the b axis, polarized EXAFS at different incident angles was collected (Figure 4d), and the DFT was used in the calculation.
Xie et al. [97] used EXAFS to collect the information of SrTiO3 (STO) doped with NiP. They concluded that the ratio of OVs in NiP/STO-60 was the highest among all samples; then, the order of oxygen octahedron structure was affected. The STO doped with NiP could gently adjust the relative concentrations of OVs, lattice oxygen, and adsorbed oxygen and significantly improve the catalytic hydrogen evolution activity due to the oxygen balance.
2. Electron Paramagnetic Resonance
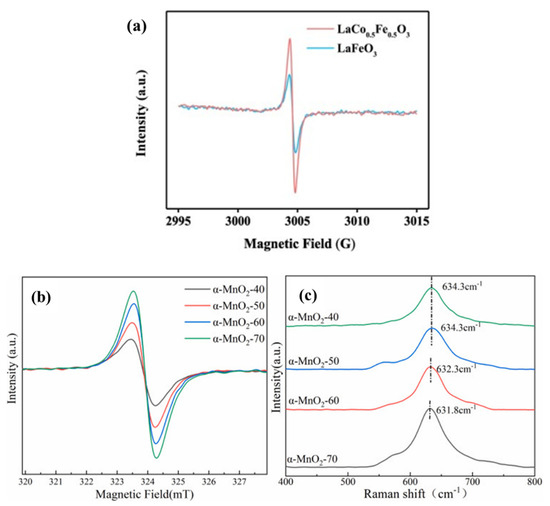
EPR was a kind of magnetic resonance technology that could be used to detect the unpaired electrons contained in atoms or molecules of matter qualitatively and quantitatively. Then, the structural properties of the surrounding environment could be explored. Jing et al. [98], respectively, synthesized LaFeO3 (LFO) and 3D micron globular LaCo0.5Fe0.5O3 (LCFO) by the hydrothermal method. Both of these perovskites were used to activate PMS to degrade BPA, and the electron spin resonance (ESR) spectra of the two were compared to detect OVs (Figure 5a). LCFO exhibited stronger signal intensities due to electron capture sites on OVs. The peak intensity was proportional to the concentration of OVs, which also indicated that there were more OVs in the LCFO material. OVs in LCFO could be increased by ion co-doping in a LFO structure, thereby enhancing the activation ability of PMS [99].
Figure 5. (a) LaCo0.5Fe0.5O3 in LaCo0.5Fe0.5O3/PMS system and ESR spectra representing oxygen vacancies in LaFeO3 and LaCo0.5Fe0.5O3 and EPR (b) and Raman (c) profiles of different catalysts [98,99,100].
The OVs in the various prepared MnO2-x catalysts were characterized by EPR [100]. Electron delocalization on OVs might result in more symmetric signal peaks. As can be seen from Figure 5b,c, each catalyst had a symmetric EPR signal peak, indicating that there were certain OVs in each material. The changing trend of the signal peak intensity of different catalysts was as follows: MnO2-1.8 (Ipeak = 795) > MnO2-2.0 (Ipeak = 758) > MnO2-1.65 (Ipeak = 578) > MnO2-1.5 (Ipeak = 333) > MnO2-1.8R (Ipeak = 226). The content of OVs was directly reflected by the signal peak strength. When x = 1.8 in the prepared MnO2-x sample, the signal strength of the catalyst was the strongest, suggesting that the MnO2-1.8 catalyst had the highest OVs’ concentration. Conversely, when x = 1.8R, the signal strength of the catalyst was the lowest, which indicated that it possessed the least amount of OVs [101].
Yang et al. [102] utilized EPR to probe into the hydrothermal α-Fe2O3 film and explored the kinetic and thermodynamic properties of its photoanodes in the presence or absence of OVs, understanding the effect of OVs on the water oxidation of the film. The consequence was that the film had an obvious EPR signal. Along with the time of hydrothermal treatment, the signal intensity of the material strengthened, indicating the increase in OVs.
3. Kelvin Probe Force Microscope and Electron Microscopy
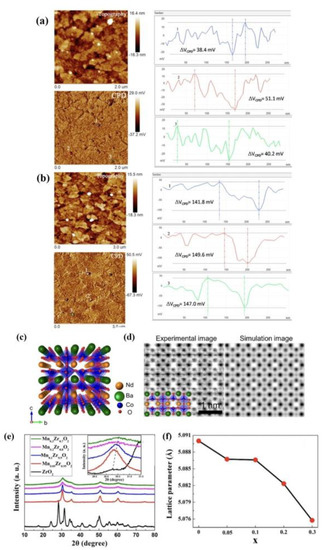
The Kelvin probe force microscope (KPFM) was one of the most widely used instruments, which was susceptive to detect the concentrations of local OVs. The electronic characterization of semiconductor surfaces also could be performed by it. The preparation of BiFeO3 (BFO) and hydrogenated BFO (HB-180-2-8) on the ITO surface was measured simultaneously with KPFM, respectively, and the morphology and CPD images are illustrated in Figure 6a,b. The variation of CPD cross-section variation values (ΔVCPD) was ~40 mV and ~140 mV, respectively, which were the original BFO and the hydrogenated BFO (HB-180-2-8); both them were clearly marked in CPD images with the marks of one, two, and three. The surface potential of unhydrogenated BFO nanocrystals was less than negative than that of hydrogenated BFO nanocrystals. The large number of OVs on the particle surface was due to the surface potential with a more negative shift of hydrogenated BFO, and these OVs could be used as active sites for electron capture [103]. The BFO particle electronic structure surface was actually altered by the use of a hydrogenation method in the image of KPFM. In an effort to better study the distribution and kinetics of OVs in NdBaCo2O5.5, the oxygen ions and their occupied positions were analyzed by means of neutron powder diffraction (NPD) and annular dark-field scanning transmission electron microscopy (ADF-STEM). A schematic diagram of the crystal structure of NdBaCo2O5.5 (NBCO5.5) in TEM image is shown in Figure 6c. The image could be used to distinguish OVs and positions of oxygen atoms by the way of improving spatial resolution. Figure 6d displays the ordered arrangement of OVs’ channels in the ND-O layer due to alternating the CoO5 square cone and CoO6 octahedron along the B-axis. ADF-STEM image simulation was carried out on the measured grid parameters and the optimized DFT model in order to demonstrate the experimental results. The image showed that OVs’ channels were empty, and the atomic columns of Nd, Ba and Co were murky, which was consistent with the experimental image primely [104].
Figure 6. Topography and contact potential difference (CPD) images of as-prepared (a) BFO and (b) hydrogenated BFO (HB−180−2−8) nanoparticles on ITO surface measured by KPFM. The cross−se−tional line profiles of CPD are achieved along the lines indicated by numbers 1, 2, and 3 in CPD images and direct observation of oxygen vacancy channels in NdBaCo2O5.5 (NBCO5.5) double perovskite. (c) Schematic view of the structure of NBCO5.5. (d) ADF STEM and simulated images of NBCO5.5 taken in the [100] zone axis. (e) HAADF image of NBCO5.5 with the EDS elemental map of Nd, Ba, and Co. (f) XRD patterns of MnxZr1−xO2 catalysts [103,104,105].
It was confirmed that the addition of Mn2 ions into a ZrO2 lattice could lead to a large amount of OVs, which was probably one of the causes of the reduction in lattice parameters.
4. H2-TPR, O2-TPD
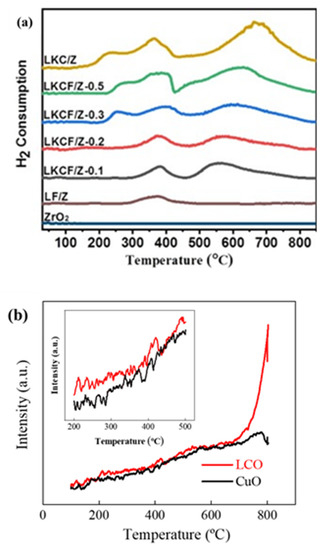
Temperature programmed desorption (TPD) was a technique used to measure the surface properties of an active center. Temperature programmed reduction (TPR) could measure the reducibility of a substance. La0.9K0.1CoO3/ZrO2 (LKC/Z), LaFeO3/ZrO2 (LF/Z), and pure LaFeO3 (Pure-LF) were prepared by Guo et al. [106] The TPR profiles of all samples are shown in Figure 7a. The reduction in Fe4+ to Fe3+ occurred in two places: one was a small H2 consumption peak of LF/Z material at around 370 °C, and the other was a relatively obvious H2 consumption peak, which appeared in the sample of x = 0.2. Another significant H2 consumption peak appeared in the x = 0.1 sample due to the reduction in Co3+ to Co2+ at low temperature. The reduction in the above metal ions led to the formation of OVs on the surface of perovskite. The O2-TPD spectra (Figure 7b) of CuO and La2CuO4−δ (LCO) showed LCO had more surface chemisorbed oxygen because several of the main low-peak strengths of CuO were less than LCO at 800 °C [107].
Figure 7. (a) The TPR profiles of LKCF/Z-x (x = 0.1–0.3 and 0.5), LKC/Z, LF/Z and ZrO2 after calcination [106] and (b) O2-TPD profiles of LCO and CuO [107].
5. Gravimetric Method
The gravimetric method was the way to determine the component content of the measured substance by weighing the mass of the substance. For the purpose of quantitatively studying the OVs’ concentration, the OVs-rich α-Fe2O3 was obtained by the gravimetric method. Three specimens were prepared on the basis that the molar ratios of α-Fe2O3 and tartaric acid were, respectively, 1/5, 1/7, and 1/10, expressed as S1, S2, and S3. The OVs-rich sample, in which mv was 1000 mg, was transformed into an OVs-free sample (mo) after oxygen annealing at 400 °C for 2 h. where Δmx was the evaporation of α-Fe2O3 at 400 °C, and the weight of absorbed water was calibrated by repeated blank tests.
In the absence of OVs, the mean weight loss of α-Fe2O3 (Δmx) was −3.4. For OVs-rich α-Fe2O3 (Δm), S2 and S3 were, respectively, +1.4 mg and −2.0 mg. As a result, S2 and S3 had an OVs mass (Δm − Δmx) of +4.8 mg and +1.4 mg. Then, in accordance with Equation (2), S3 and S2 were calculated to be 1.6% and 0.4%, respectively. The results for S1 and S4 were not clear, mainly due to the fact that they were too low to weigh (<0.1%), which exceeded the capacity of the device [90]. Other methods for the quantitative detection of OVs according to different concentrations were also studied [36].