Your browser does not fully support modern features. Please upgrade for a smoother experience.
Please note this is an old version of this entry, which may differ significantly from the current revision.
A photovoltaic (PV) system is composed of a PV panel, controller and boost converter. The PV panel is a power-generating device. A controller is an electronic device that controls the circulating circuits in a PV system to collect as much PV output as possible from the solar panel. The boost converter is an intermediate device that regulates the PV output based on the duty cycle provided by the controller.
- MPPT application
- interrelationship
- PV panel
- controller
- converter
- publication distribution
- year
- article type
- publisher
- country
1. Introduction
Global energy provision has evolved into a duty and a commitment to the growth of numerous industrial sectors. For ASEAN’s emerging nations to develop their industries, modernize their agriculture, boost trade, and enhance transportation, reliable energy is crucial. However, the official infographic released by the ASEAN Energy Centre 2020 study indicates that certain ASEAN nations still have poor electrification rates. So far, Myanmar only has a 44% electrification rate, while Cambodia only has a 68% electrification rate. According to Silitonga’s research, Cambodia has the highest energy costs in the area, depriving the majority of its inhabitants of access to electricity [1]. On the downside, there was an energy deficit of 442.5 MW. Insufficient supply, unstable supply and excessive electricity prices are hallmarks of its energy industry.
To address energy shortages in some ASEAN countries, photovoltaic (PV) systems have gained attention [2]. A PV system is an electrical framework device that produces renewable energy by having PV cells transform solar energy into electricity. It has gained popularity due to favorable low maintenance costs, environmental sustainability, economic viability and long lifespan [3]. Since PV systems have been commercialized in many countries, various studies have been conducted on their future development [4][5][6][7]. Suggestions for improvements and adjustments have been made on a regular basis to increase the capacity of the PV system [8].
A complete PV system consists of three primary devices that work together: a PV panel, controller and boost converter. The PV panel is equivalent to a PV array composed of multiple PV modules in series and parallel, wherein the modules are composed of multiple PV cells in series. Here, PV cells are the smallest compounds responsible for generating PV voltage, current and power to the system [9]. In theory, only PV cells exposed to uniform irradiance and temperature can operate at optimal efficiency [10]. The operating temperature of a PV panel should always be consistent because every PV cell shares the same ambient temperature. Therefore, the only factor that primarily affects power generation should be the irradiance level. Under normal circumstances, a PV module will be fully irradiated (1000 W/m2), but sometimes the sunlight will be blocked by obstacles such as clouds, trees, birds, etc., causing some PV cells in the module to be shaded and not illuminated. This is the shading effect, where the PV module receives only a percentile of irradiance from the unshaded surface of PV cells [10]. It goes without saying that all individual modules with the same settings will produce different voltage, current and power outputs at different shading degrees [11]. The higher the irradiance level, the higher the efficiency of the PV system and the higher the PV voltage, current and power generated at the panel terminals.
Different connection patterns of PV modules produce different voltage and current outputs. PV modules are connected in series to double the voltage output and in parallel to double the current output [12][13]. PV systems generally require higher voltage outputs, so series-connected PV modules are favorable. However, in practical applications, PV modules will not be completely connected in series, but will also be mixed in parallel [14]. This is to theoretically reduce the risk of defects. Any wiring fault in the series will terminate the power generation of the entire series array. If only the series connection is used, any wiring failure will terminate the entire power generation process of the PV panel, resulting in chain defects of the entire PV system. On the contrary, any wiring fault inside the parallel connection has little effect on the entire power generation process. Although a row of PV power generation circuits will be terminated, the circuit elements in the other rows can still operate normally without major defects. In this case, only a small amount of current is lost, but the maximum voltage at the terminals remains the same [15].
In practice, fully connected PV modules in a panel sometimes experience varying degrees of shading in respective modules. This is what researchers call the partial shading phenomenon that occurs in PV panel [16]. The PV panel under partial shading effect will generate multiple power peaks at the power-voltage (P-V) characteristic curve [17][18]. The number of power peaks corresponds to the number of PV modules with different shading degrees within the panel. The highest power peak in the P-V curve denotes the maximum power point (MPP), where the optimal power can be extracted from the PV panel. To reach the MPP and thus maximize the power extraction from the PV panel at any given situation, the controller in a PV system necessitates parameter optimization while referencing the PV panel data and environmental data to obtain a best-tuned duty cycle [19]. Overall, the controller is responsible for optimizing the process of tracking the MPP. The main difficulty lies in the nonlinear nature and environmental reliance of PV power generation [20][21]. For the controller to complete the optimization task, there must be a tracking scheme applied to the controller block. It can be a traditional technique, intelligent approach, or metaheuristic optimization algorithm. All attempts to track MPP using any of the above-classified tracking schemes are referred to as maximum power point tracking (MPPT). Researchers also reasonably refer to these adopted tracking approaches as MPPT techniques.
In effect, the controller sends commands to the boost converter via a pulse width modulation (PWM) signal generated based on the tuned duty cycle to control the switching interval of the transistors in the boost converter, thereby indirectly maximizing the PV power generation in the PV panel. Here, the controller mainly acts as a stabilizer to maintain a constant output power in the PV circuit system. However, it is worth noticing that the boost converter also acts as a voltage regulator, amplifying the PV voltage drawn from the panel to the user.
From a corollary perspective, for Southeast Asia (SEA) to develop a dependable and consistent energy system, energy efficiency is crucial [22]. In accordance with the energy chapter of the 2025 ASEAN Economic Community (AEC) Blueprint, ASEAN abides by the policy in the 2016–2025 ASEAN Action Plan for Energy Cooperation (APAEC) [23]. It intends to raise the intensity of SEA’s renewable energy to the predetermined level of 23%. Thus, improving MPPT techniques through additional research and development may be the best approach to advance renewable energy. It is believed that this will also be the best solution to deal with the energy shortage problem in some SEA countries.
2. Conspectus of PV Systems
A growing number of projects have begun large-scale implementation of photovoltaic (PV) solar power to replace non-renewable energy in real-world setups [24]. Photovoltaic systems have emerged as prime candidates for power plants, connected via power lines to distribution systems, transmission systems, substations and end-users [25]. It should be noted that power lines are the medium that carry electricity from one location to another, and the process of transferring electricity over vast-distances between two desired locations is called electrical transmission [26]. The most commonly used type of power line is the overhead line, which can carry huge voltages of 100–800 kV and is mainly used for long distance transmission [27]. Efficient transmission of up to 500 km is possible [28]. In theory, the high voltage capacity minimizes the power loss to resistance. Basically, the amount of power is determined by how much current (I) passes through a circuit element, how much voltage (V) differs at the nodes, and how much power (P) is then lost throughout the process. From a more theoretical point of view, the heat dissipated by current travelling across a power cord/line with internal resistance can cause power loss due to resistance [29][30]. As researchers expand the analysis, the resulting power loss is the square of the total current drop, and the current drops proportionally with increasing voltage [30]. This claim implies that PV systems require the highest voltage available to deliver the greatest amount of power to users with minimal losses. However, there is a constraint, in that the current begins to discharge at 2000 kV, leading to significant losses [31].
A PV system is an electrical frame device that sustains renewable energy [32]. It consists of three main devices: PV panel, boost converter and controller [33]. Figure 1 displays the complete layout of the PV system, including all internal layouts of the interacted electro-devices. The PV panel is a power-generating device that converts solar energy into electrical energy, at which the output of the PV panel terminals is regulated by the boost converter and supplied to the controller. The controller tunes the duty cycle while referencing the input PV data output from the PV panel to generate the desired controlling signal to the boost converter. The boost converter refers to the controlling signal provided by the controller to regulate the PV data output from the PV panel. For ease of understanding, Figure 2 displays the interrelationship diagram for these electro-devices in a PV system. The output terminal of the boost converter can be linked to the user device, representing the provision of processed PV power to the user, albeit not directly. The following sections provide an in-depth explanation of each device in terms of background, architecture, concept, and impact.
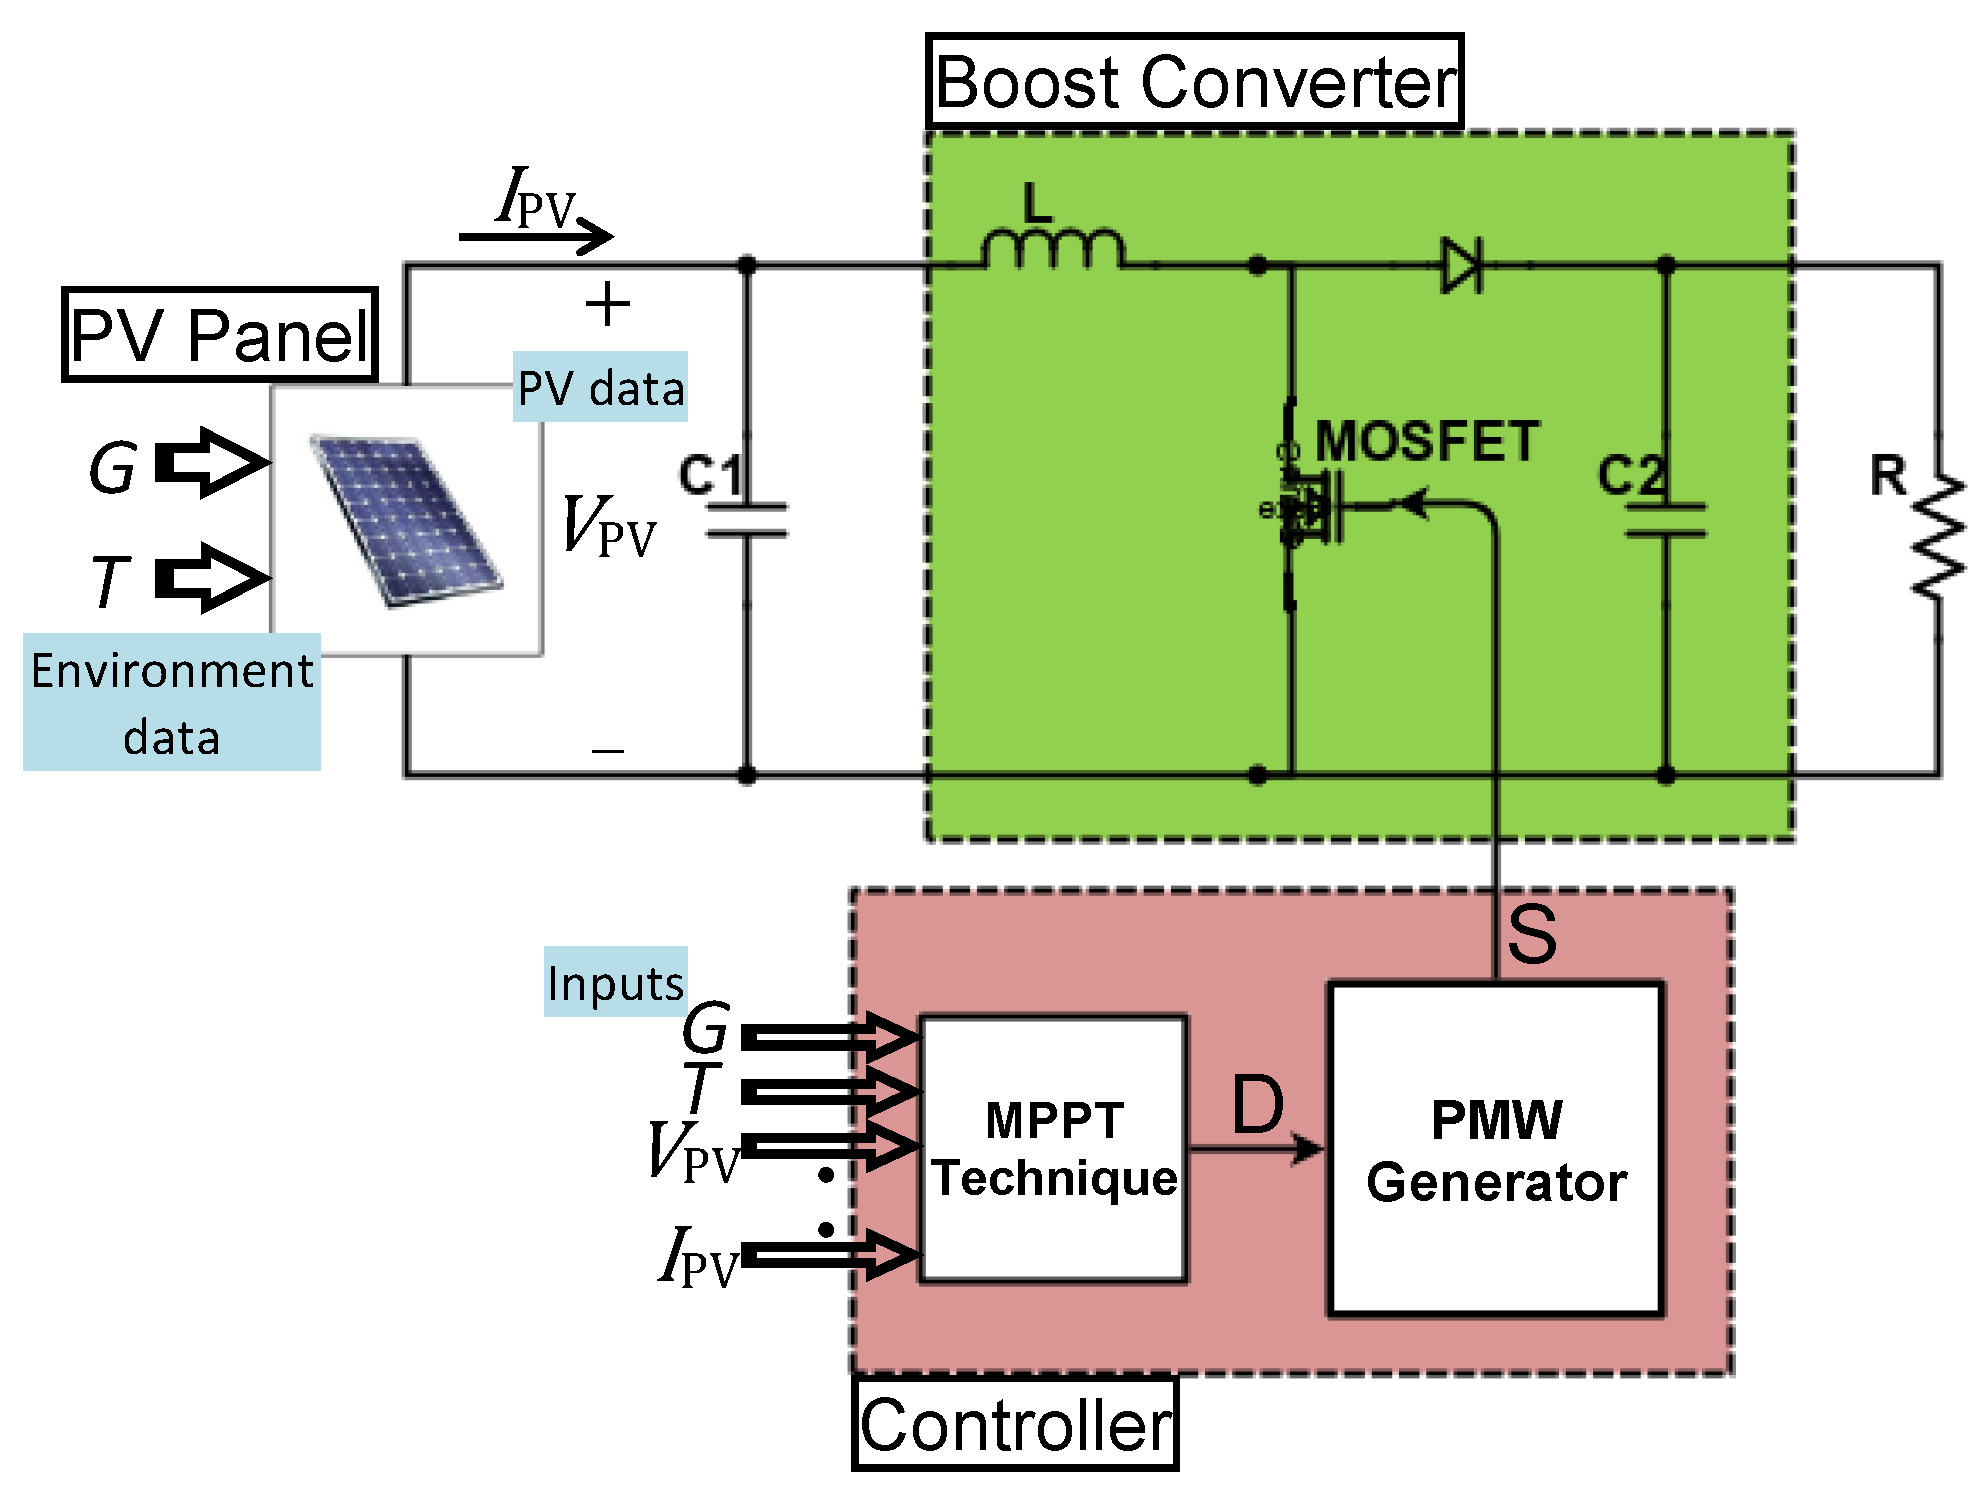
Figure 1. Layout in PV system.
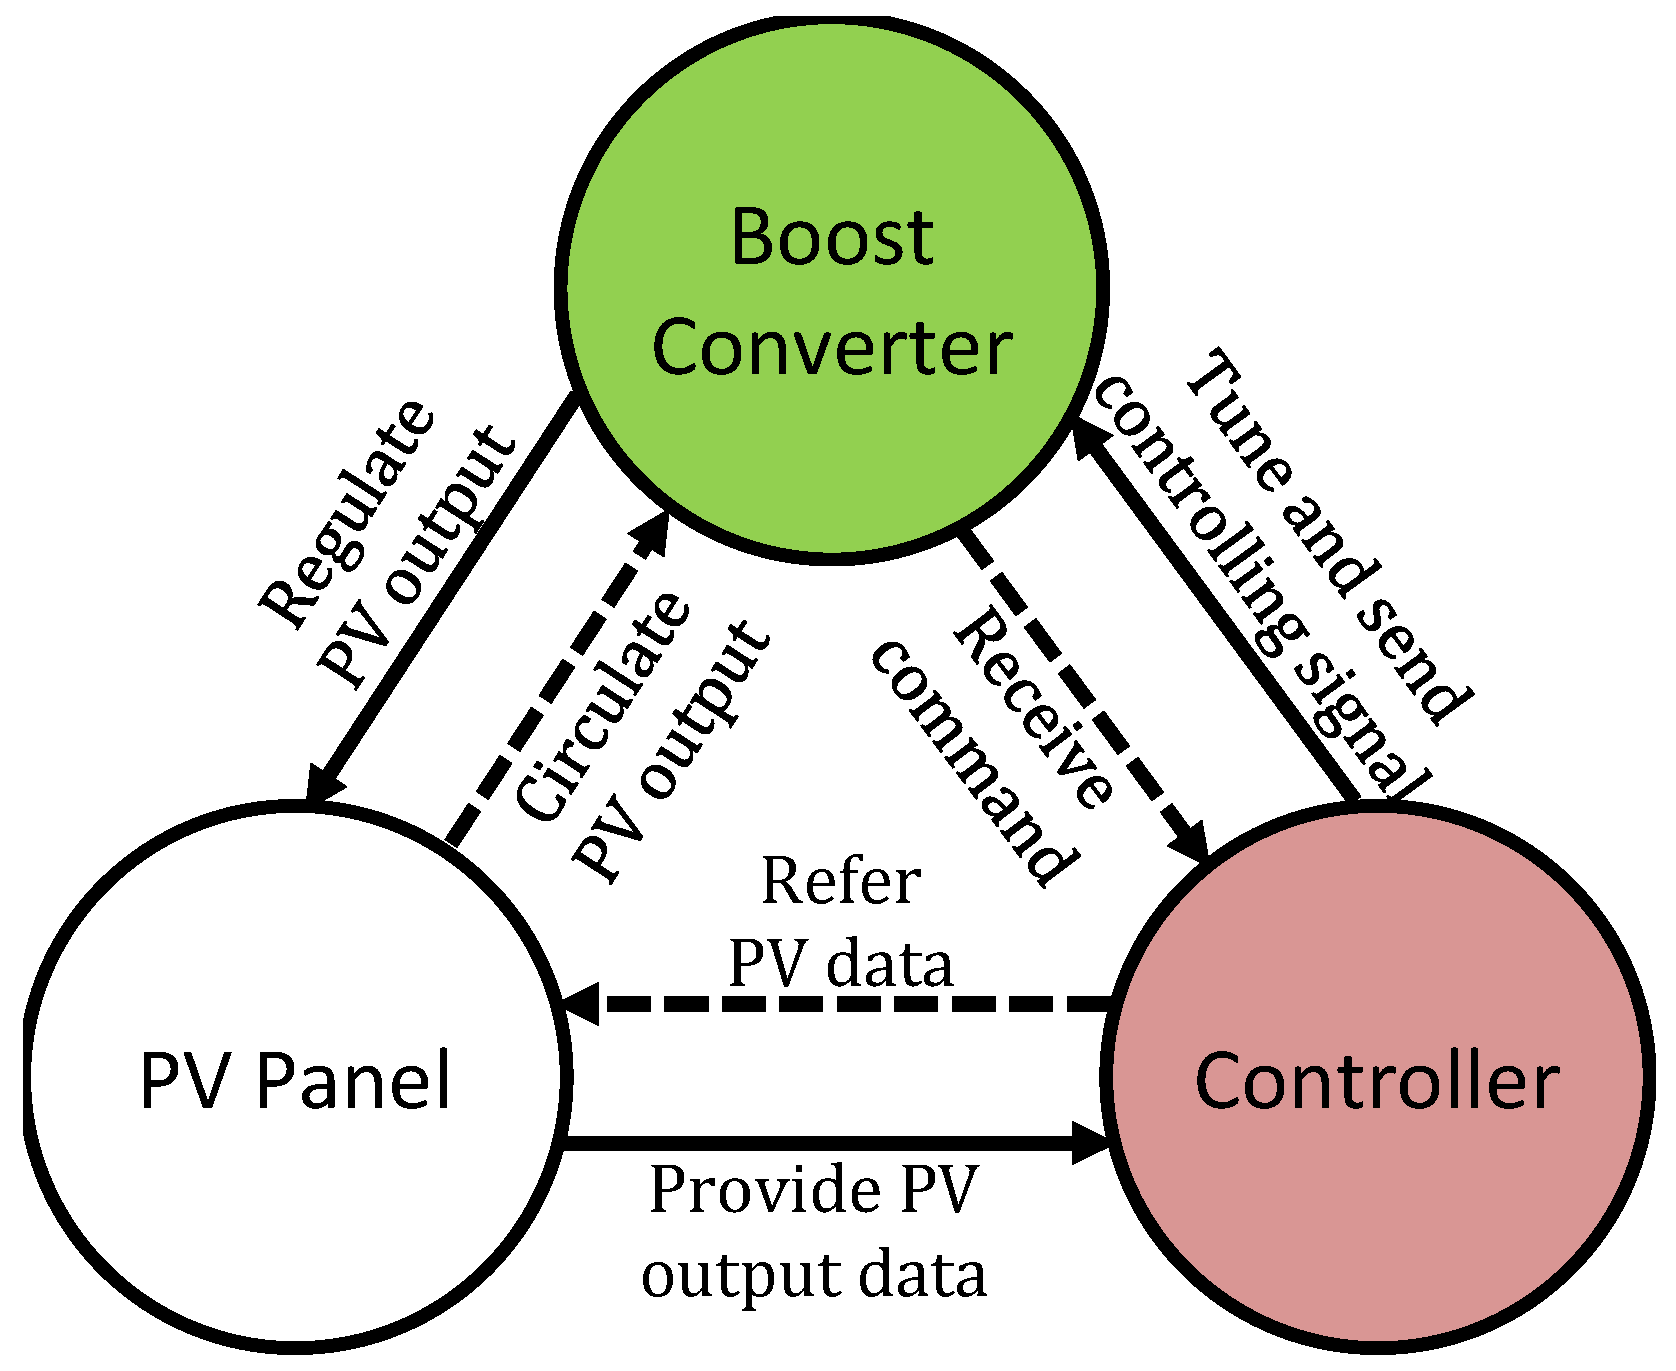
Figure 2. Interrelationship diagram in PV system.
The review sets forth to reveal tendencies in scholarly publications up to the end of December 2022. After in-depth investigation, researchers collected rough data from journals, conferences, books, editorials, and other sources, with at least a significant number of publications from emerging publishers. The content may include studies from various perspectives such as application, design, modification, evaluation, performance comparison, analysis, discussion, interpretation, etc.; all directly or indirectly contribute to the development of PV-related technologies.
For ease of observation and discussion, this research presents the data in different forms such as tables, line charts and pie charts for the following contents. Table 1 records the year-specific publication count by article type, Figure 3 illustrates a line chart plotting publication count by article type over the years, while Figure 4 demonstrates a pie chart with cumulative percentiles distributed by article type.
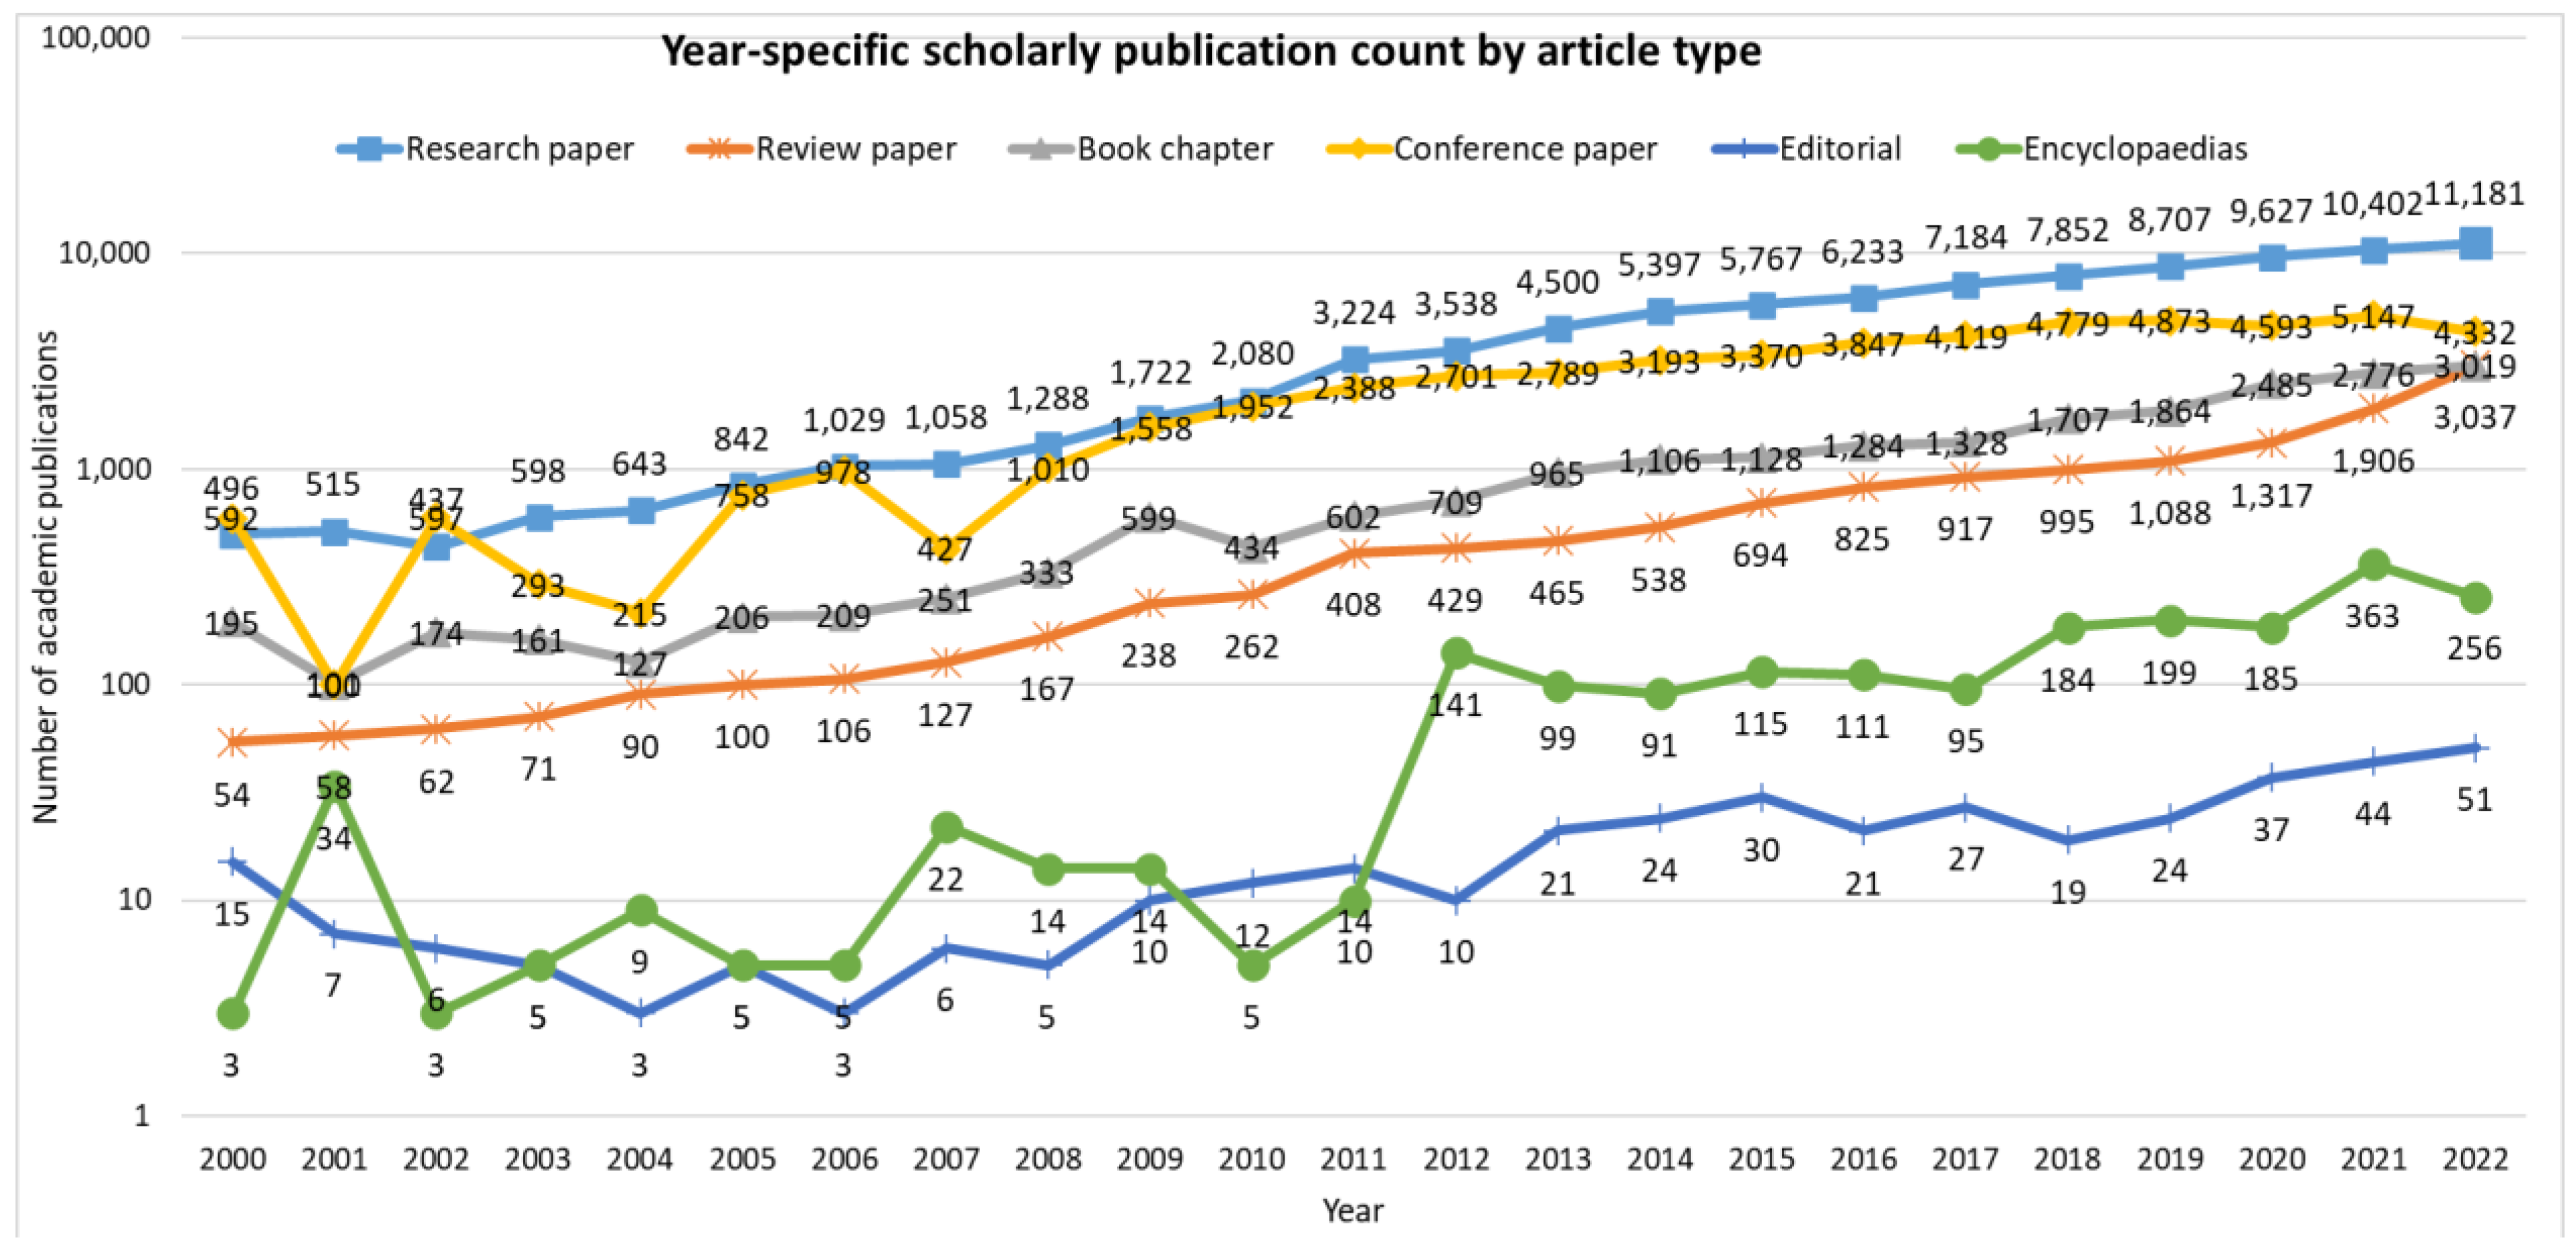
Figure 3. Distribution of publications by article type over the years.
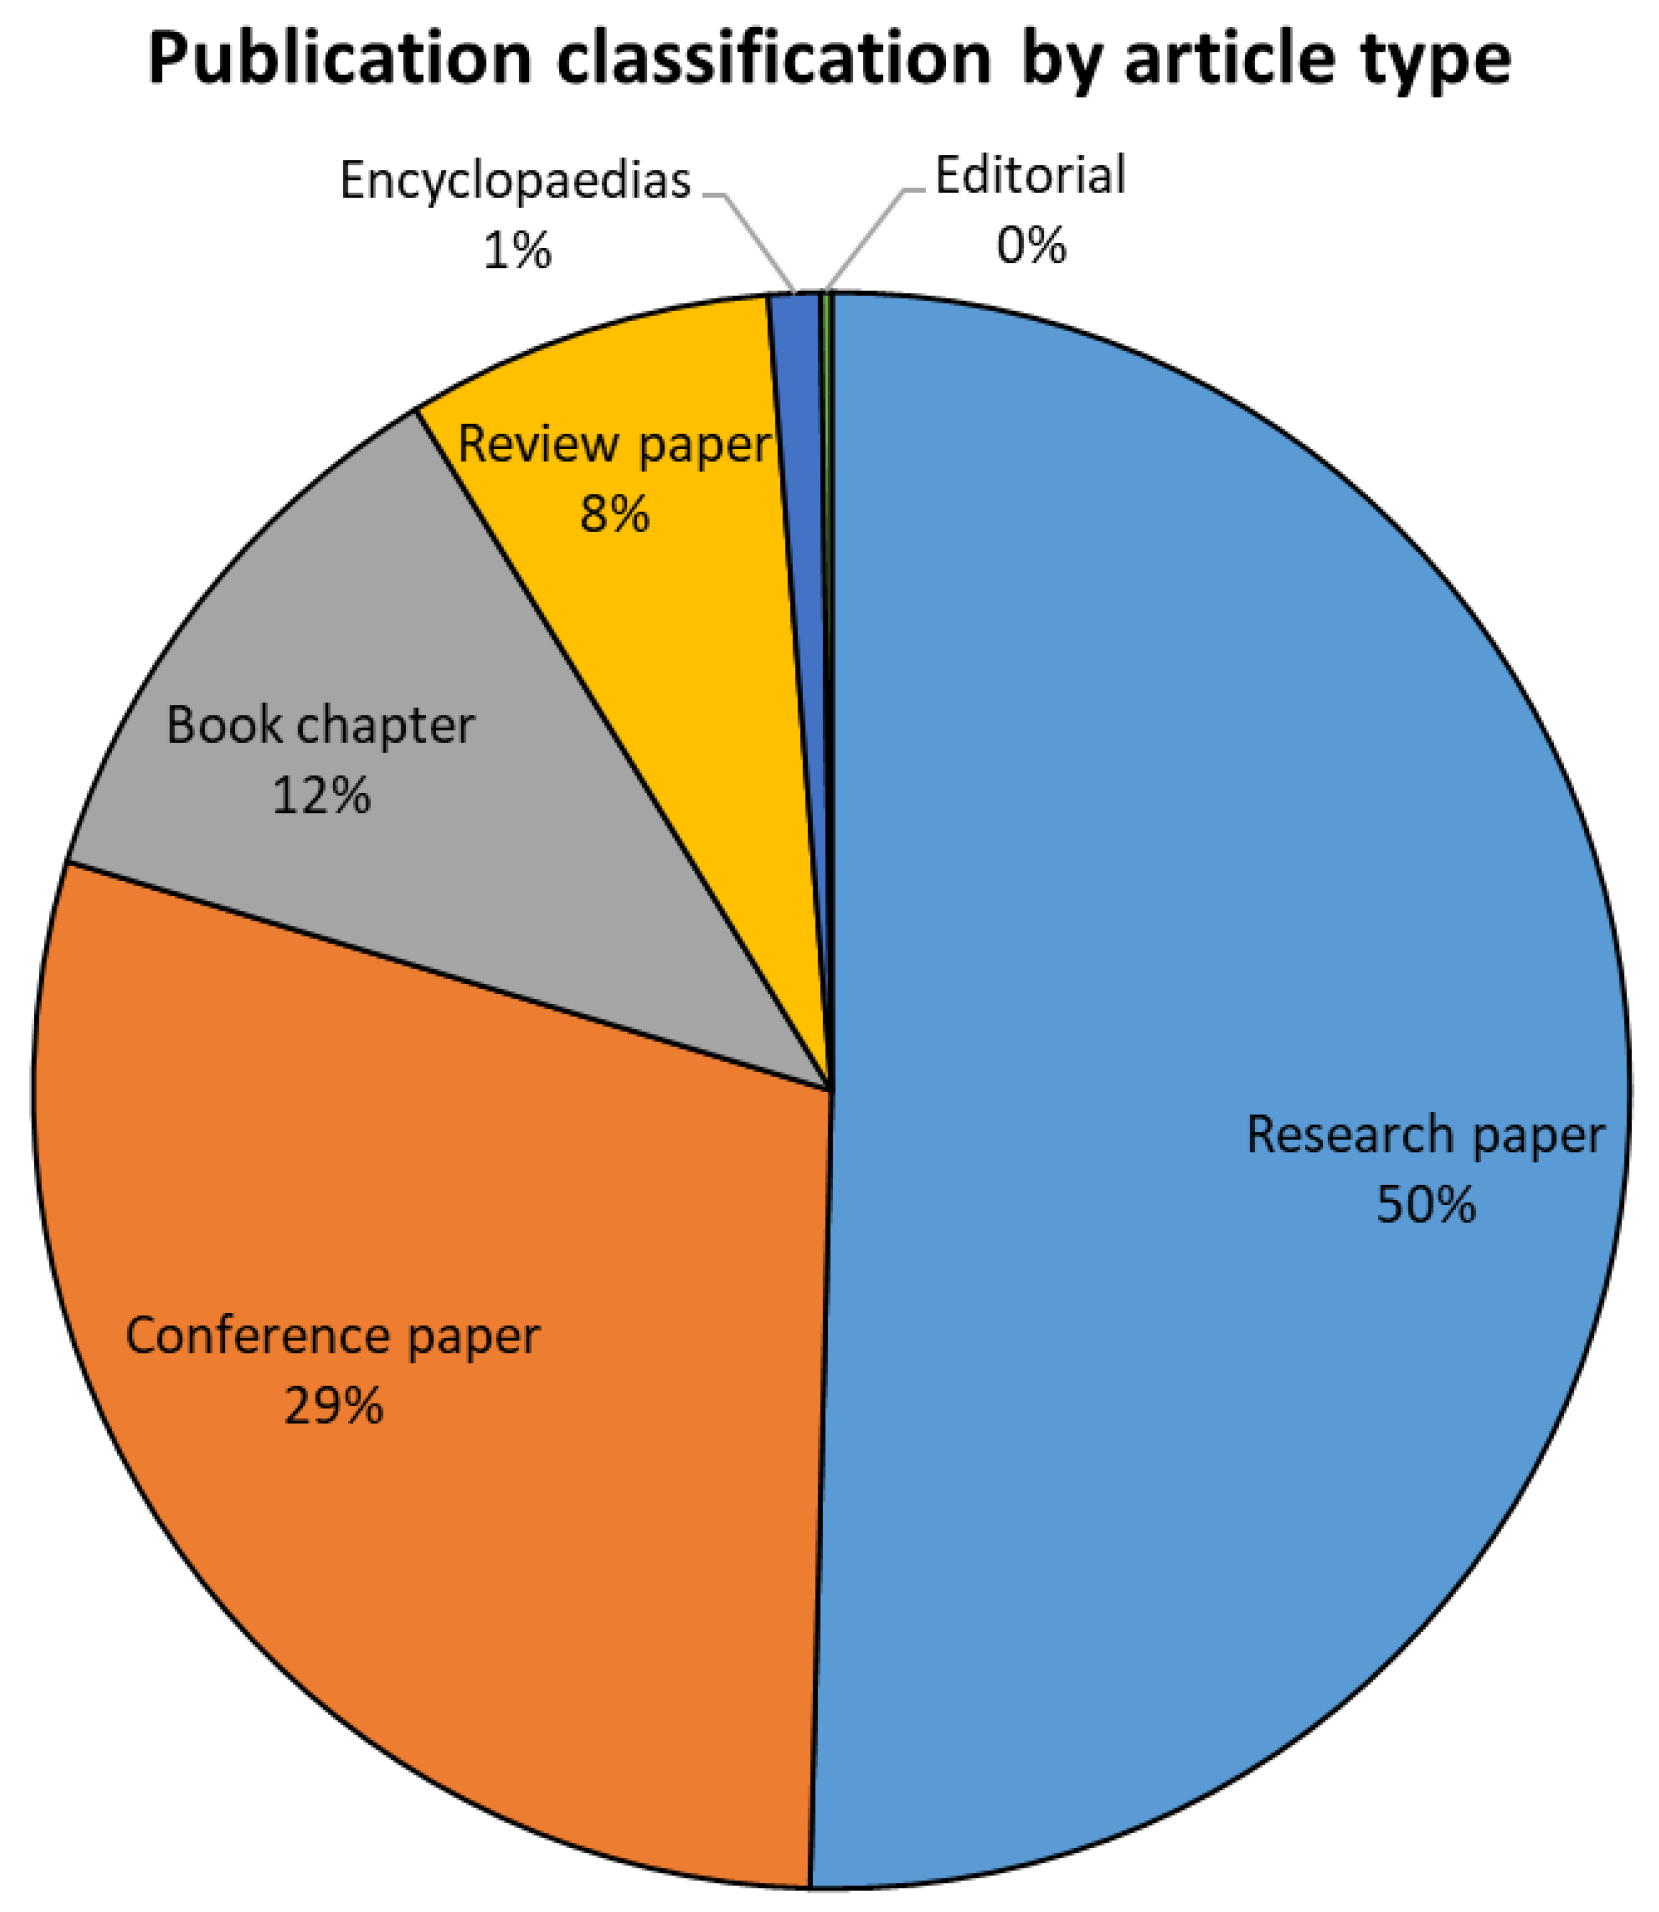
Figure 4. Proportion of publication classification by article type.
Table 1. Year-specific publication count by article type.
| Publication Count by Article Type | ||||||||||||||||||||||||
|---|---|---|---|---|---|---|---|---|---|---|---|---|---|---|---|---|---|---|---|---|---|---|---|---|
| Article Type | 2000 | 2001 | 2002 | 2003 | 2004 | 2005 | 2006 | 2007 | 2008 | 2009 | 2010 | 2011 | 2012 | 2013 | 2014 | 2015 | 2016 | 2017 | 2018 | 2019 | 2020 | 2021 | 2022 | Cumulative |
| Research paper | 496 | 515 | 437 | 598 | 643 | 842 | 1029 | 1058 | 1288 | 1722 | 2080 | 3224 | 3538 | 4500 | 5397 | 5767 | 6233 | 7184 | 7852 | 8707 | 9627 | 10,402 | 11,181 | 94,320 |
| Conference paper | 592 | 100 | 597 | 293 | 215 | 758 | 978 | 427 | 1010 | 1558 | 1952 | 2388 | 2701 | 2789 | 3193 | 3370 | 3847 | 4119 | 4779 | 4873 | 4593 | 5147 | 4332 | 54,611 |
| Book chapter | 195 | 101 | 174 | 161 | 127 | 206 | 209 | 251 | 333 | 599 | 434 | 602 | 709 | 965 | 1106 | 1128 | 1284 | 1328 | 1707 | 1864 | 2485 | 2776 | 3019 | 21,763 |
| Review paper | 54 | 58 | 62 | 71 | 90 | 100 | 106 | 127 | 167 | 238 | 262 | 408 | 429 | 465 | 538 | 694 | 825 | 917 | 995 | 1088 | 1317 | 1906 | 3037 | 13,954 |
| Encyclopaedias | 3 | 34 | 3 | 5 | 9 | 5 | 5 | 22 | 14 | 14 | 5 | 10 | 141 | 99 | 91 | 115 | 111 | 95 | 184 | 199 | 185 | 363 | 256 | 1968 |
| Editorial | 15 | 7 | 6 | 5 | 3 | 5 | 3 | 6 | 5 | 10 | 12 | 14 | 10 | 21 | 24 | 30 | 21 | 27 | 19 | 24 | 37 | 44 | 51 | 399 |
| Total | 1355 | 815 | 1279 | 1133 | 1087 | 1916 | 2330 | 1891 | 2817 | 4141 | 4745 | 6646 | 7528 | 8839 | 10,349 | 11,104 | 12,321 | 13,670 | 15,536 | 16,755 | 18,244 | 20,638 | 21,876 | 187,015 |
The trends in Table 1 and Figure 3 indicate an increasing academic demand for PV-related studies. More than 80% of articles published between 2000 and 2020 were published after 2012, with 2022 seeing the highest number of publications, representing a total increase of 190.6% compared to 2012. Incidentally, the publication count has grown by an average of 11.3% per year over these 10 years. In the decade since 2012, the number of publications across all article types has grown significantly. By the end of 2022, research papers account for the highest proportion of publications (about 50%), followed by conference papers (about 29%), and then book chapters (about 12%), as shown in Figure 4. This reveals that research journals have become the main channel for the dissemination of project outcomes related to the topic of photovoltaics. In fact, it demonstrates the ongoing proposal to develop photovoltaic-related technologies, as research articles only accept results with a high degree of novelty. On the other hand, conference proceedings (papers) account for a persistently high proportion of publications, demonstrating efforts by organizations to hold frequent conferences and provide researchers with free space to discuss, present, and publish their project outcomes. The large number of book chapters also indicate a publisher’s interest in sharing research resources that benefit readers’ learning
Table 2 reorganizes the article data by publisher, while Figure 5 illustrates the data in percentiles via a pie chart representation. Upon investigation, Springer is currently the publishing media that releases the most PV-related publications, covering everything from major research papers to minor editorials. Next came IEEE, Elsevier, and then MDPI, where they are all promising publishers in the engineering field. IEEE is known for its extensive conference proceedings around the world, while Elsevier and MDPI host numerous high-impact open access journals that contribute to knowledge dissemination. All participating publishers are striving to push PV-related technologies to the next level.
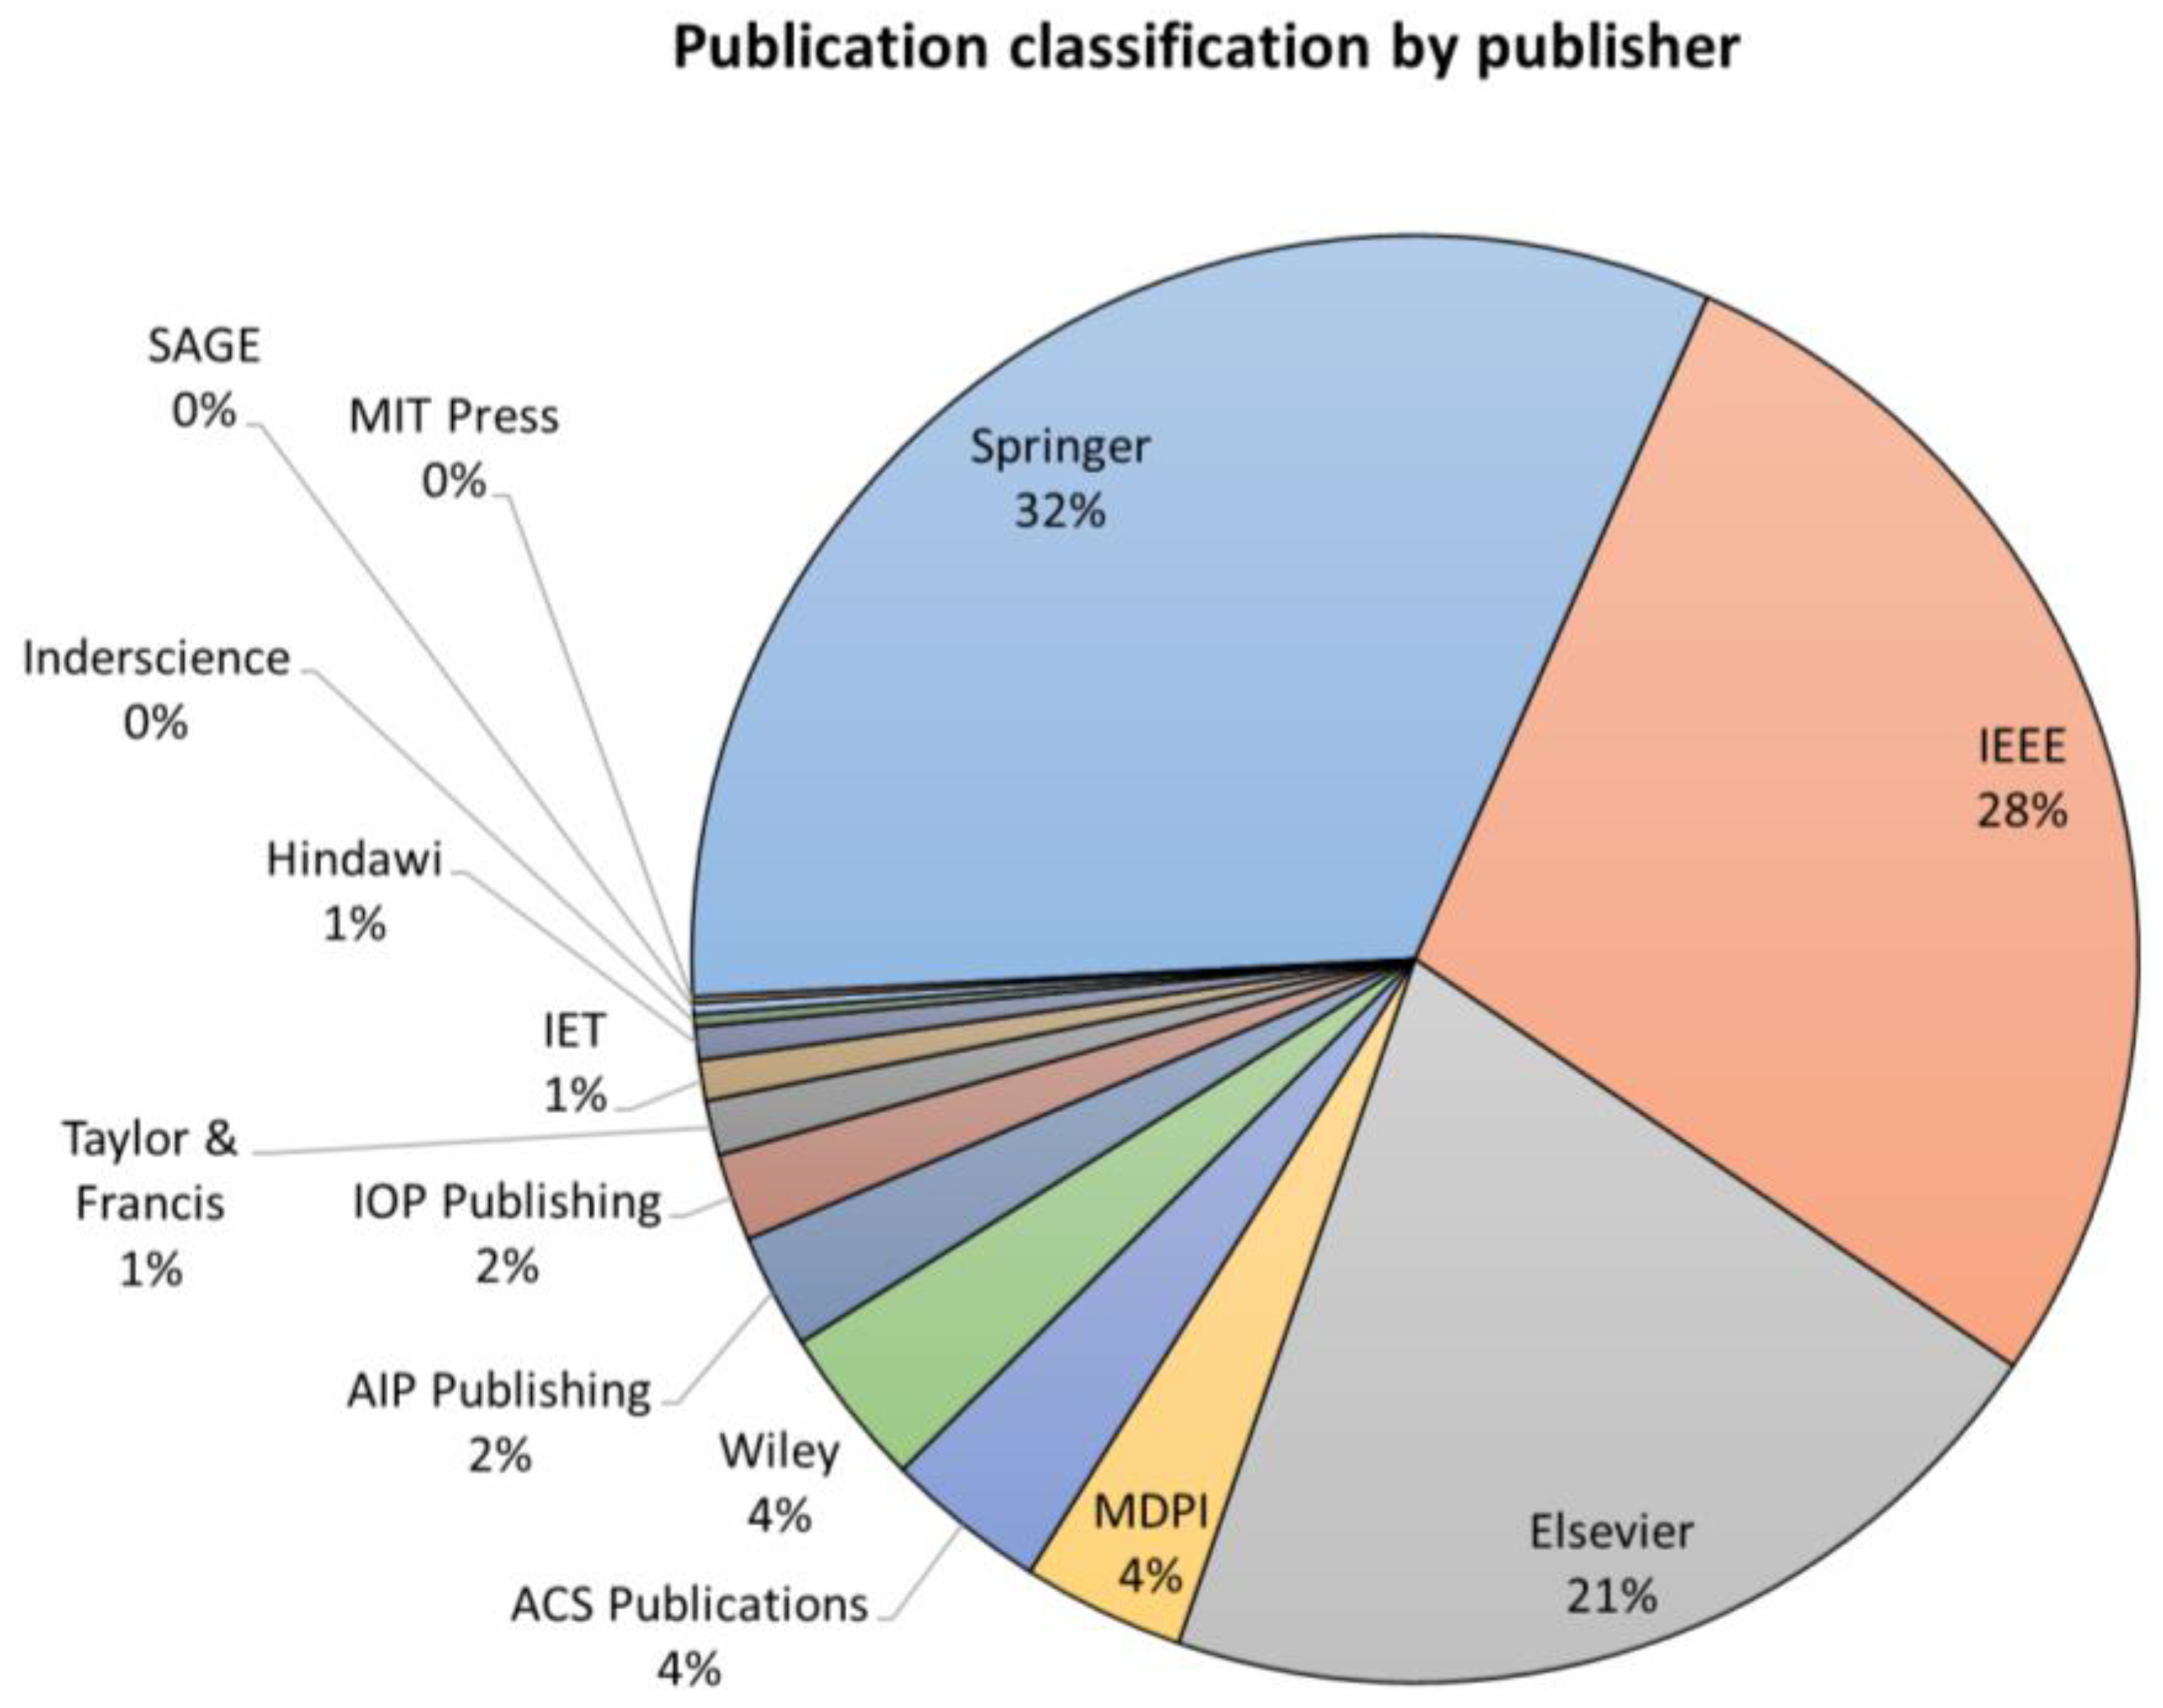
Figure 5. Proportion of publication classification by publisher.
Table 2. Publisher’s publication count for specific article type.
| Publisher | Scholarly Publication Count | ||||||
|---|---|---|---|---|---|---|---|
| Article Type | Cumulative | ||||||
| Research Paper | Review Paper | Book Chapter | Conference Paper | Editorial | Encyclopaedias | ||
| Springer | 22,769 | 9890 | 19,465 | 6866 | 0 | 1720 | 60,710 |
| IEEE | 8124 | 202 | 74 | 43,463 | 250 | 4 | 52,117 |
| Elsevier | 34,724 | 2547 | 1229 | 172 | 55 | 182 | 38,909 |
| MDPI | 6050 | 609 | 9 | 87 | 34 | 7 | 6796 |
| ACS Publications | 6474 | 102 | 19 | 132 | 0 | 0 | 6727 |
| Wiley | 5834 | 78 | 710 | 42 | 0 | 46 | 6710 |
| AIP Publishing | 3257 | 127 | 33 | 1316 | 47 | 7 | 4787 |
| IOP Publishing | 1702 | 123 | 1 | 1825 | 0 | 0 | 3651 |
| Taylor & Francis | 2214 | 78 | 0 | 0 | 1 | 0 | 2293 |
| IET | 984 | 19 | 82 | 608 | 0 | 0 | 1693 |
| Hindawi | 1304 | 65 | 0 | 6 | 12 | 0 | 1387 |
| Inderscience | 486 | 28 | 0 | 0 | 0 | 0 | 514 |
| SAGE | 351 | 20 | 1 | 94 | 0 | 0 | 466 |
| MIT Press | 47 | 66 | 140 | 0 | 0 | 2 | 255 |
The exact publication count by year, article type and publisher may be more than stated as the data presented is based only on information gathered through the outcomes of own review. However, the current amount of data is sufficient to provide key evidence and reference for readers to comprehend the academic progress of PV-related publications over the years. It also advises researchers which publishers and article types would enable their studies to be recognized and accepted.
The use of solar energy is increasing worldwide and currently accounts for an estimated 5% of the world’s electricity. However, global solar installations vary by country, with China having the largest installed solar capacity in the world, accounting for approximately 36% of the world’s total energy production, followed by the United States at 11%, and Japan at 9%. According to experts, 133–175 gigawatts of new solar capacity were built globally in 2021, with another 200 gigawatts deployed by the end of 2022 [34]. This is clear evidence that solar energy has great potential for further expansion, as every country meets the geographic requirements to install solar technology. However, this research is written for scholarly outreach purposes, and researchers prefer to review scholarly publications to reveal their distribution across countries. Table 3 exclusively records the relevant data, Figure 6 shows the data in the form of a pie chart, and Figure 7 displays the data in the form of a map chart. It is worth noting that China, United States and India are currently the top three countries with the largest number of proposals for photovoltaic-related articles in the global scale, of which China accounts for 20.84% of the total number of global academic publications, followed by the United States with 16.63% and India with 8.38%. Collectively, these three counties could have the most advanced knowledge in the installation, production and commercialization of solar power.
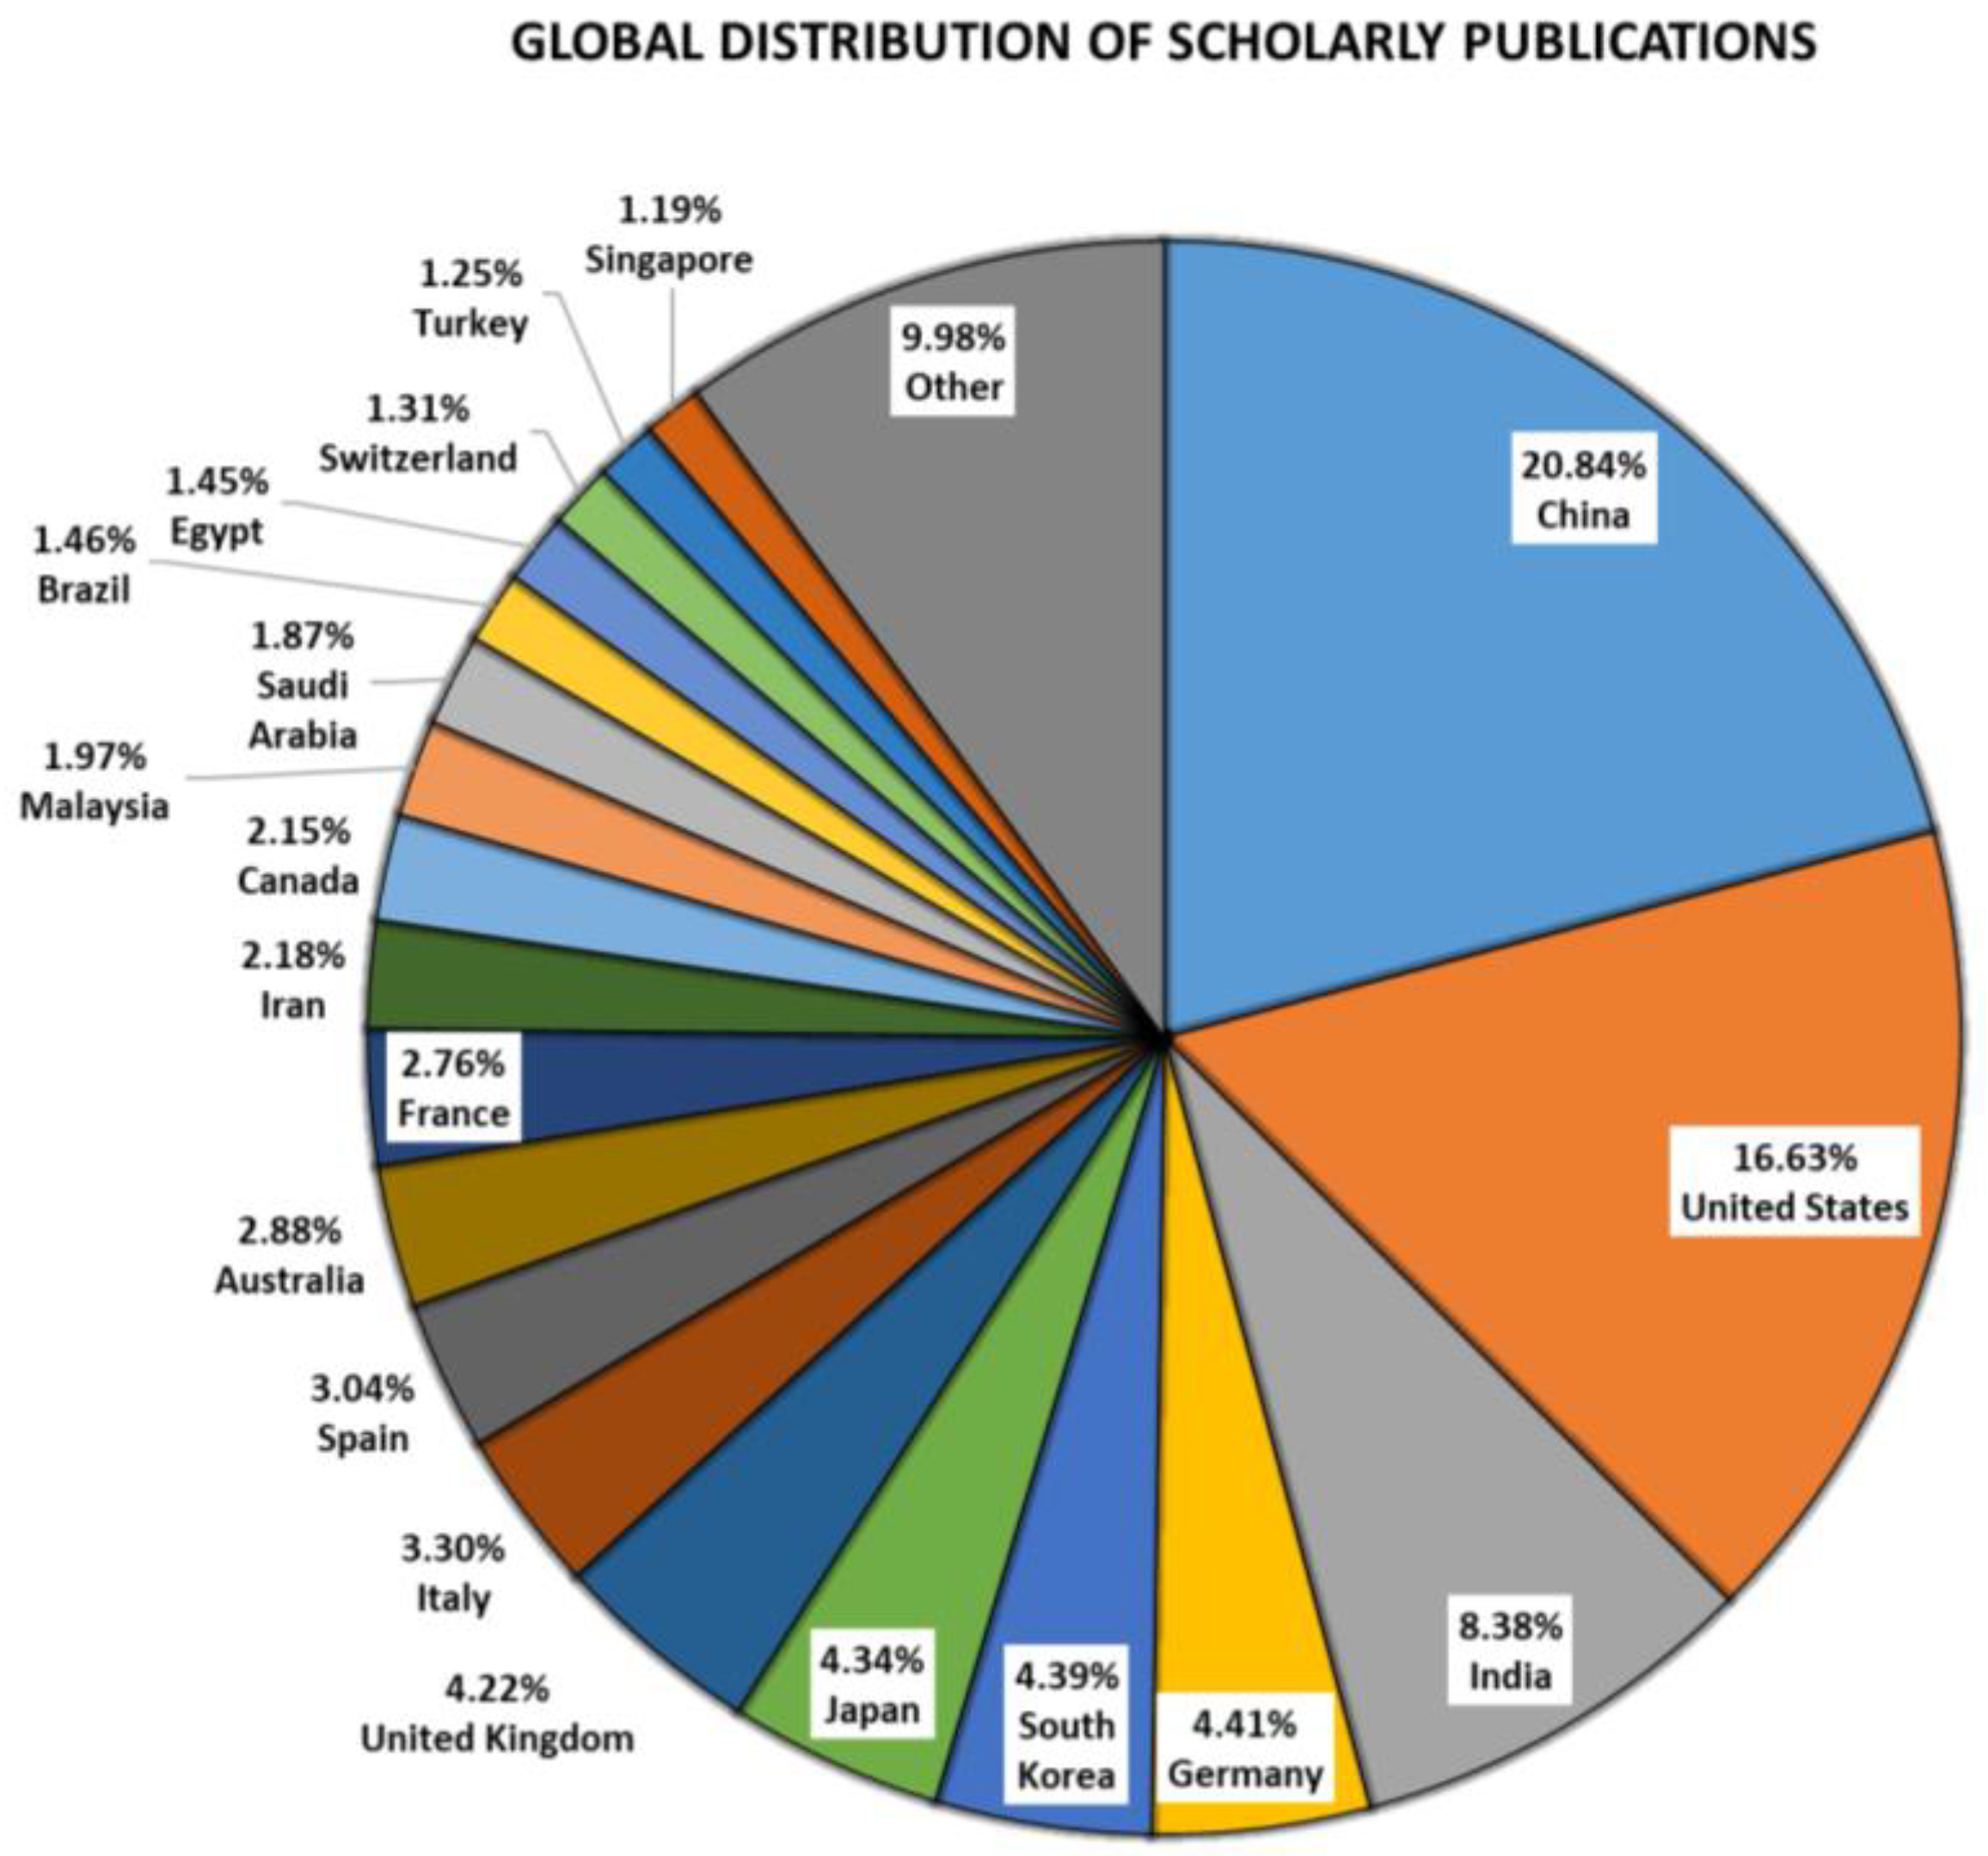
Figure 6. Proportion of publication classification by country.
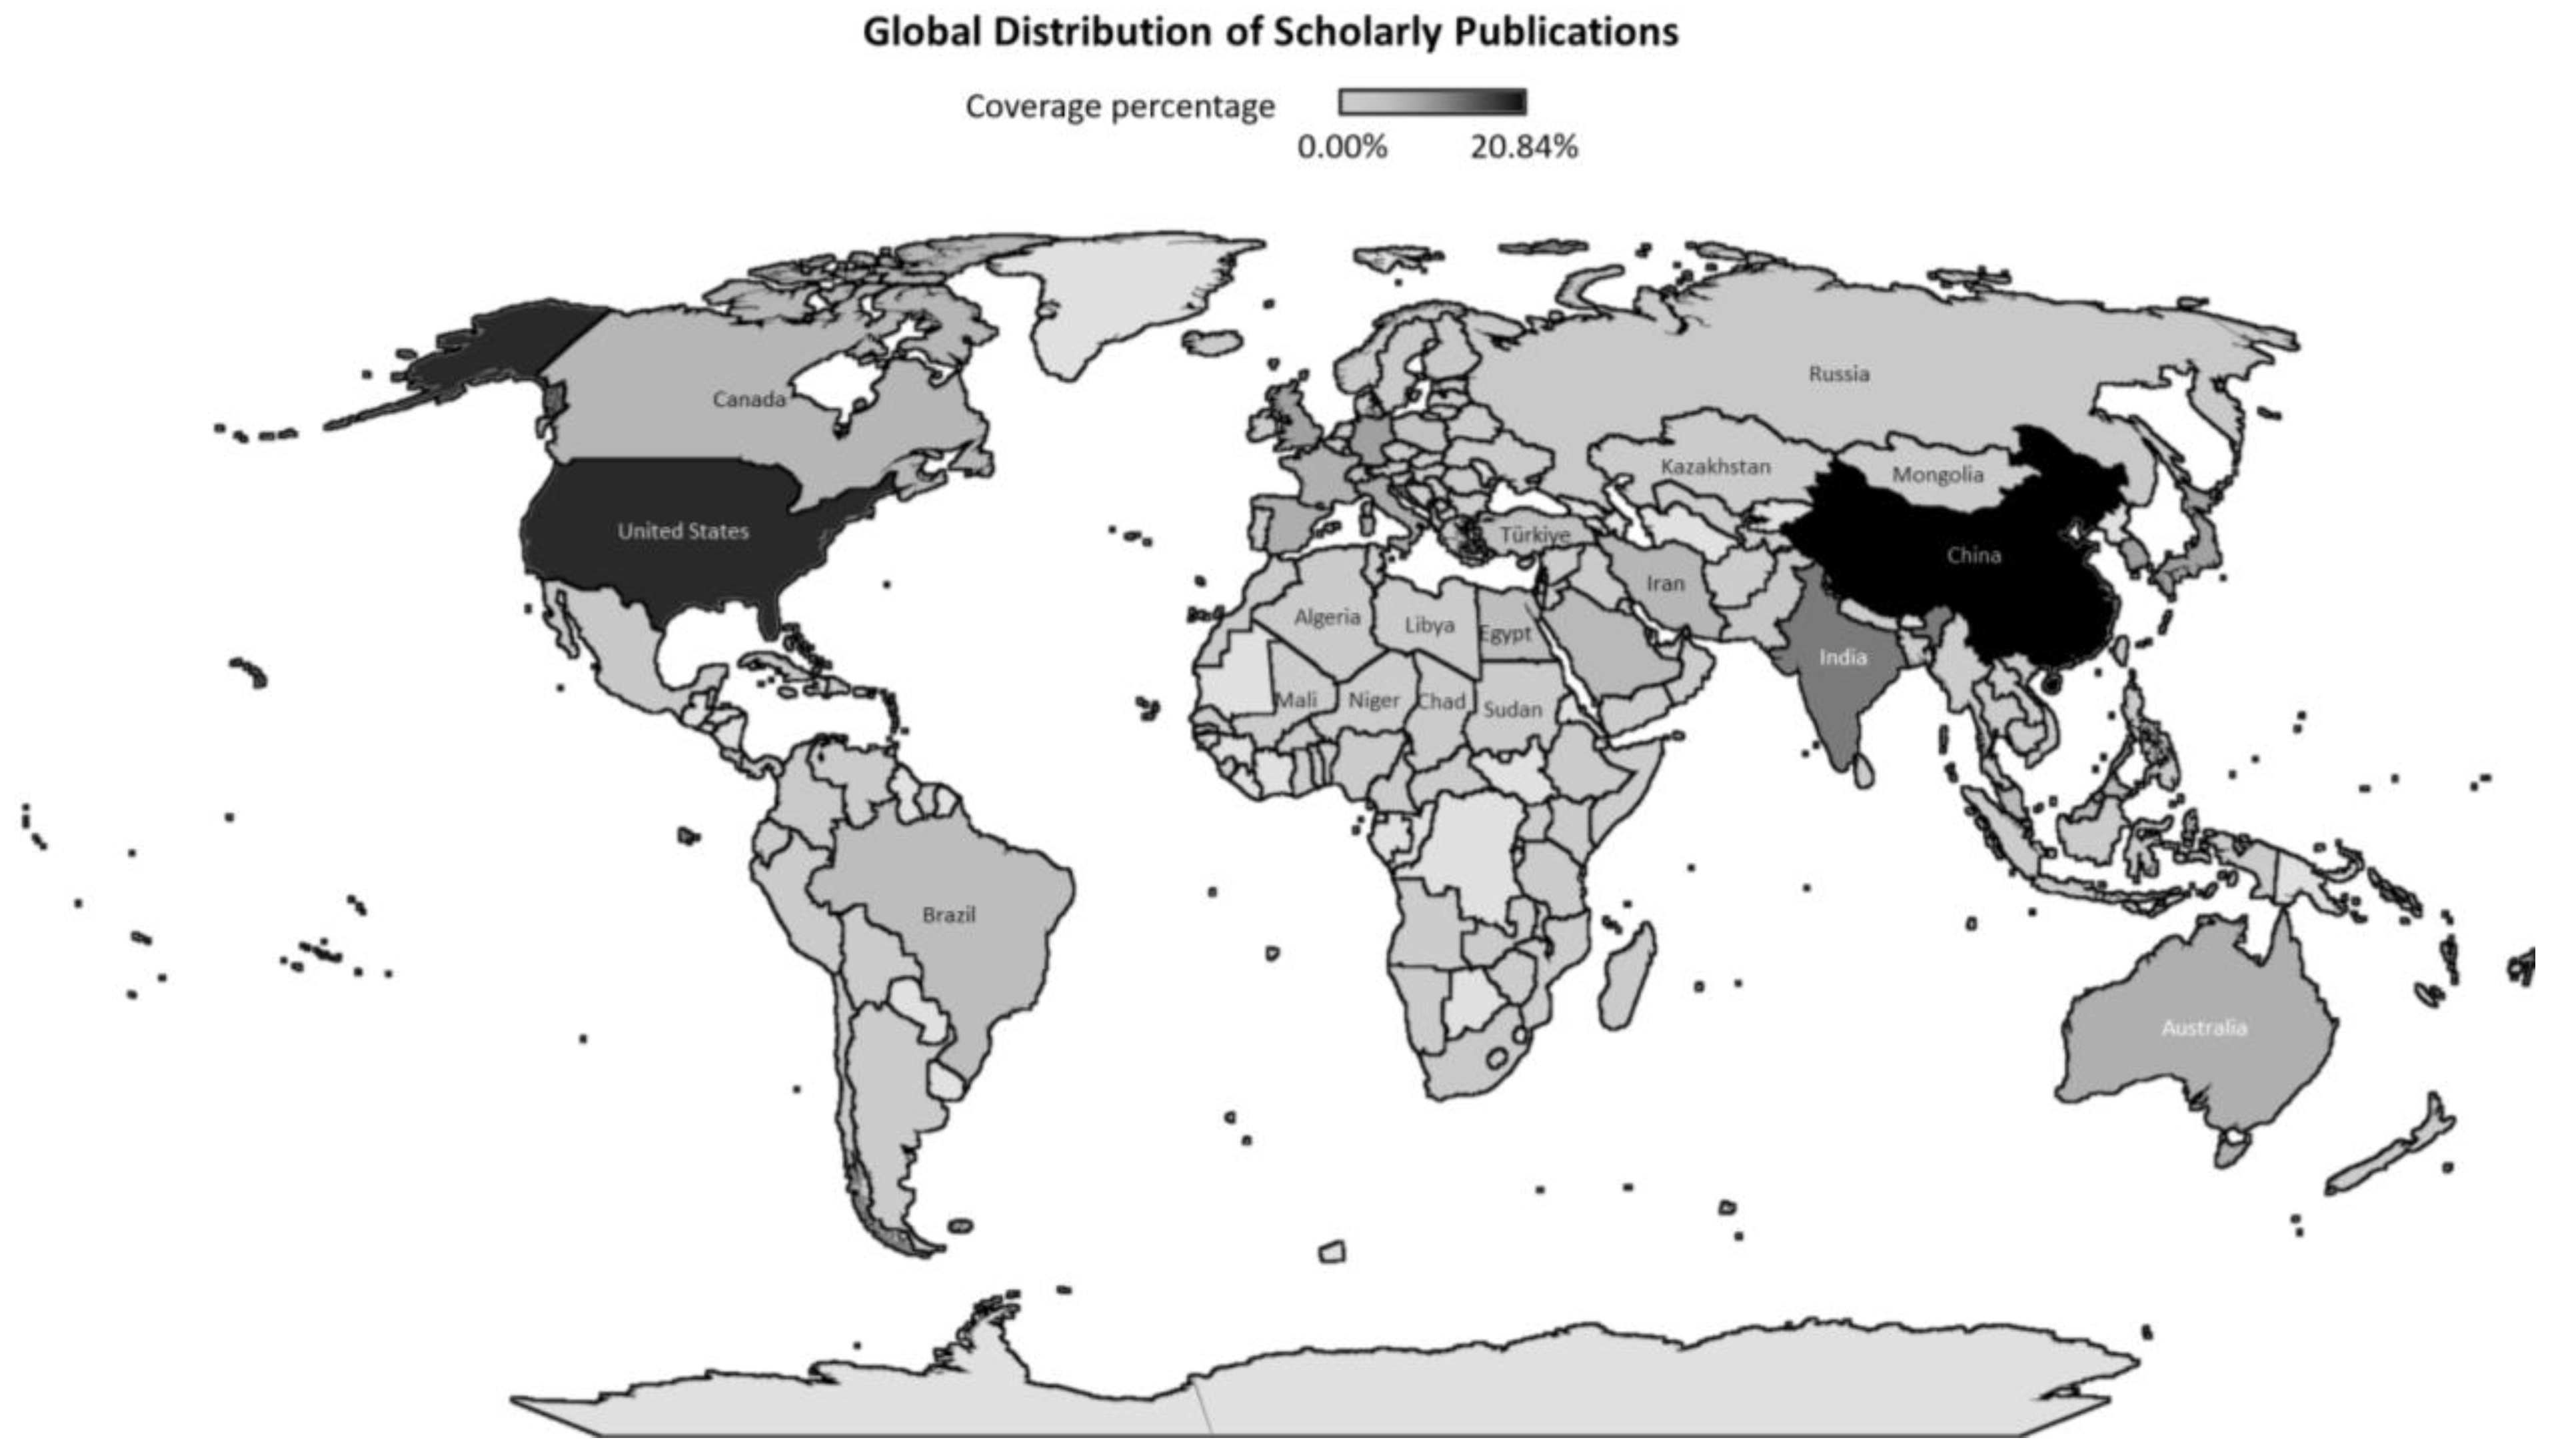
Figure 7. Global distribution of scholarly publications.
Table 3. Percentage distribution of scholarly publications by country.
| Country | Distribution Percentage of Scholarly Publications |
|---|---|
| China | 20.84% |
| United States | 16.63% |
| India | 8.38% |
| Germany | 4.41% |
| South Korea | 4.39% |
| Japan | 4.34% |
| United Kingdom | 4.22% |
| Italy | 3.30% |
| Spain | 3.04% |
| Australia | 2.88% |
| France | 2.76% |
| Iran | 2.18% |
| Canada | 2.15% |
| Malaysia | 1.97% |
| Saudi Arabia | 1.87% |
| Brazil | 1.46% |
| Egypt | 1.45% |
| Switzerland | 1.31% |
| Turkey | 1.25% |
| Singapore | 1.19% |
| Other | 9.98% |
This entry is adapted from the peer-reviewed paper 10.3390/en16020850
References
- Rio, J.; Silitonga, P. Energy Efficiency CambodiaPromoting and Demonstrating Energy Management System in Cambodia; ASEAN Centre of Energy: Jakarta, Indonesia, 2020.
- Tao, M.; Hamada, H.; Druffel, T.; Lee, J.-J.; Rajeshwar, K. Review—Research Needs for Photovoltaics in the 21st Century. ECS J. Solid State Sci. Technol. 2020, 9, 125010.
- Mao, M.; Duan, Q.; Duan, P.; Hu, B. Comprehensive improvement of artificial fish swarm algorithm for global MPPT in PV system under partial shading conditions. Trans. Inst. Meas. Control. 2018, 40, 2178–2199.
- Wang, W.; Yu, N.; Johnson, R. A model for commercial adoption of photovoltaic systems in California. J. Renew. Sustain. Energy 2017, 9, 025904.
- Wei, C.K.; Saad, A.Y. The Potential of Solar Energy for Domestic and Commercial Buildings in Malaysia. J. Adv. Res. Fluid Mech. Therm. Sci. 2020, 75, 91–98.
- Nwaigwe, K.N.; Mutabilwa, P.; Dintwa, E. An overview of solar power (PV systems) integration into electricity grids. Mater. Sci. Energy Technol. 2019, 2, 629–633.
- Ceran, B.; Jurasz, J.; Mielcarek, A.; Campana, P.E. PV systems integrated with commercial buildings for local and national peak load shaving in Poland. J. Clean. Prod. 2021, 322, 129076.
- Ontiri, G.K.; Amuhaya, L.L. A Review of Emerging Photovoltaic Construction Technologies to Increase Efficiencies in Solar as a Renewable Energy Source. Am. Acad. Sci. Res. J. Eng. Technol. Sci. 2022, 85, 348–369.
- Kumari, J.S.; Babu, C.S. Mathematical Modeling and Simulation of Photovoltaic Cell using Matlab-Simulink Environment. Int. J. Electr. Comput. Eng. 2015, 2, 26–34.
- Seyedmahmoudian, M.; Mekhilef, S.; Rahmani, R.; Yusof, R.; Renani, E.T. Analytical Modeling of Partially Shaded Photovoltaic Systems. Energies 2013, 6, 128–144.
- Sathyanarayana, P.; Ballal, R.; Sagar, P.L.; Kumar, G. Effect of Shading on the Performance of Solar PV Panel. Energy Power 2015, 5, 1–4.
- Babu, G.S.; Charan, B.P.; Krishna, A.R. Comparative analysis of I-V & P-V characteristics of a series and parallel connected SPV modules. Int. J. Curr. Eng. Sci. Res. (IJCESR) 2016, 3, 1–6.
- Tiwari, G.N.; Meraj, M.; Khan, M.E.; Dwevedi, V.K. Effect of Series and Parallel Combination of Photovoltaic Thermal Collectors on the Performances of Integrated Active Solar Still. J. Therm. Sci. Eng. Appl. 2022, 14, 081006.
- Gallegos, C.D.R.; Alvarez-Alvarado, M.S. Analysis of the Stationary and Transient Behavior of a Photovoltaic Solar Array: Modeling and Simulation. Int. J. Comput. Appl. Technol. 2015, 127, 26–33.
- Parthiban, R.; Ponnambalam, P. An Enhancement of the Solar Panel Efficiency: A Comprehensive Review. Front. Energy Res. 2022, 10, 937155.
- Salem, F.; Awadallah, M.A. Detection and assessment of partial shading in photovoltaic arrays. J. Electr. Syst. Inf. Technol. 2016, 3, 23–32.
- Saadsaoud, M.; Abbassi, H.A.; Kermiche, S.; Ouada, M. Study of Partial Shading Effects on Photovoltaic Arrays with Comprehensive Simulator for Global MPPT Control. Int. J. Renew. Energy Res. 2016, 6, 413–420.
- Dadjé, A.; Djongyang, N.; Tchinda, R. Electrical Power Losses in a Photovoltaic Solar Cell Operating under Partial Shading Conditions. J. Power Energy Eng. 2017, 5, 19–33.
- Soomar, A.M.; Hakeem, A.; Messaoudi, M.; Musznicki, P.; Iqbal, A.; Czapp, S. Solar Photovoltaic Energy Optimization and Challenges. Front. Energy Res. 2022, 10, 1–18.
- Tofoli, F.L.; de Pereira, D.C.; de Paula, W.J. Comparative Study of Maximum Power Point Tracking Techniques for Photovoltaic Systems. Int. J. Photoenergy 2015, 2015, 1–10.
- Pakkiraiah, B.; Sukumar, G.D. Research Survey on Various MPPT Performance Issues to Improve the Solar PV System Efficiency. J. Sol. Energy 2016, 2016, 1–20.
- Lu, Y.; Khan, Z.A.; Alvarez-Alvarado, M.S.; Zhang, Y.; Huang, Z.; Imran, M. A Critical Review of Sustainable Energy Policies for the Promotion of Renewable Energy Sources. Sustainability 2020, 12, 5078.
- ASEAN. ASEAN Action Plan for Energy Cooperation (APAEC) 2016–2025; Zamora, C.G., Ed.; ASEAN Centre for Energy: Jakarta, Indonesia, 2015.
- Dewangan, D.; Ekka, J.P.; Arjunan, T.V. Solar photovoltaic thermal system: A comprehensive review on recent design and development, applications and future prospects in research. Int. J. Ambient Energy 2022, 43, 1–25.
- Decker, C. Energy transportation: Electricity. In Handbook of Energy Economics and Policy—Fundamentals and Applications for Engineers and Energy Planners; Rubino, A., Sapio, A., Scala, M.L., Eds.; Academic Press: Cambridge, MA, USA, 2021; pp. 193–238. ISBN 978-0-12-814712-2.
- Paynter, R.T.; Boydell, B.J.T. Power Transmission and Distribution: An Overview. In Introduction to Electricity; Pearson: Upper Saddle River, NJ, USA, 2010; pp. 1095–1097.
- Annestrand, S.A. Power Transmission, High-Voltage. In Encyclopedia of Physical Science and Technology; Academic Press: Cambridge, MA, USA, 2003; pp. 35–55.
- Paynter, R.T.; Boydell, B.J.T. Transmission Lines and Substations. In Introduction to Electricity; Pearson: Upper Saddle River, NJ, USA, 2010; pp. 1102–1104.
- Dhass, A.D.; Beemkumar, N.; Harikrishnan, S.; Ali, H.M. A Review on Factors Influencing the Mismatch Losses in Solar Photovoltaic System. Int. J. Photoenergy 2022, 1–27.
- Engr Alumona, T.L.; Nwosu, M.O.; Ezechukwu, A.O.; Chijioke, J. Overview Of Losses And Solutions In Power Transmission Lines. Netw. Complex Syst. 2014, 4, 24–31.
- Doukas, H.; Karakosta, C.; Flamos, A.; Psarras, J. Electric power transmission: An overview of associated burdens. Int. J. Energy Res. 2011, 35, 979–988.
- Hameiri, Z. Photovoltaics literature survey (no. 172). Prog. Photovolt. 2022, 30, 204–208.
- Sarah, K.E.; Roland, U.; Ci, O.E.N. A Review of Solar Photovoltaic Technologies. Int. J. Eng. Res. Technol. 2020, 9, 741–749.
- IEA. Renewables 2021: Analysis and Forecasts to 2026; OECD Publishing: Paris, France, 2021.
This entry is offline, you can click here to edit this entry!