Your browser does not fully support modern features. Please upgrade for a smoother experience.
Please note this is an old version of this entry, which may differ significantly from the current revision.
Subjects:
Endocrinology & Metabolism
Amyotrophic Lateral Sclerosis (ALS) presentation is within a disorder spectrum with Frontotemporal Dementia (FTD), and many patients present mixed forms of ALS and FTD, thus increasing the variability. Lipid metabolic and other systemic metabolic alterations have not been well studied in FTD, or in ALS–FTD mixed forms, as has been in pure ALS. With the recent development in lipidomics and the integration with other -omics platforms, there is now emerging data that not only facilitates the identification of biomarkers but also enables understanding of the underlying pathological mechanisms.
- lipid metabolism
- ALS
- FTD
- lipidomics
- cholesterol
1. Introduction
Lipids are essential components of life. The great complexity and number of lipid species is a major obstacle for understanding their extensive role in health and disease. The thousands of lipid species are currently classified into eight main families (fatty acyls, glycerolipids, glycerophospholipids, sphingolipids, sterol lipids, prenol lipids, saccharolipids, and polyketides) [1][2]. Fatty acyls are the core of certain complex lipid classes, including glycerolipids, glycerophospholipids and sphingolipids (Figure 1). Their functions and characteristics are mostly determined by their structure, which depends on the number of carbons of the chain (short, medium, long, or very-long fatty acids) and the number of double bonds (saturated, monounsaturated, and polyunsaturated or PUFA). In the brain, the majority of fatty acids are PUFAs that constitute the phospholipids of membranes. Interestingly, eicosanoids are the result of several oxidation processes of PUFAs, including arachidonic acid. These metabolites are involved in several inflammatory responses, directly linking the role of lipids and lipid peroxidation in the inflammatory processes observed in many disorders, including amyotrophic lateral sclerosis (ALS) and Alzheimer disease (AD). Similarly, the sphingolipids and ceramides, which are integral components of cell membranes and rafts, have important structural, signalling, and inflammation roles that depend, partly, on their fatty acyl composition. Fatty acids are stored in glycerolipids (mono-, di-, and triacylglycerols). Most of the triacylglycerols (TG) are composed of three fatty acyls with different carbons chains (16, 18, 20, etc.), thus explaining why many TG in blood have a total of around 52,54,56 carbons, with different quantities of double bonds. The major source of TG in the body is from the diet. Cholesterol levels in the body are tightly regulated, with 80% produced endogenously in the body, plus some coming from external sources. Cholesterol regulation can also be influenced by environmental interaction (diets, lifestyle, sport, etc.). Cholesterol can be found free or in an esterified form with fatty acyls (cholesterol esters, CE), with 18:2 CE and the 20:4 CE being the most abundant in human plasma, affecting the levels of PUFAs, such as arachidonate, in cells. Another lipid class is prenol. The most abundant and known prenol lipids are the benzoquinones CoQ9 and CoQ10, since they are essential for electron transfer in the mitochondria and ATP production. It is important to note that CoQ biosynthesis depends on the mevalonate pathway. HMG-CoA reductase, which is the rate-limiting enzyme in this pathway and in the biosynthesis of cholesterol, is inhibited by statins (cholesterol-lowering drugs), which might influence the reduction in CoQ levels in plasma [3] (Figure 1).
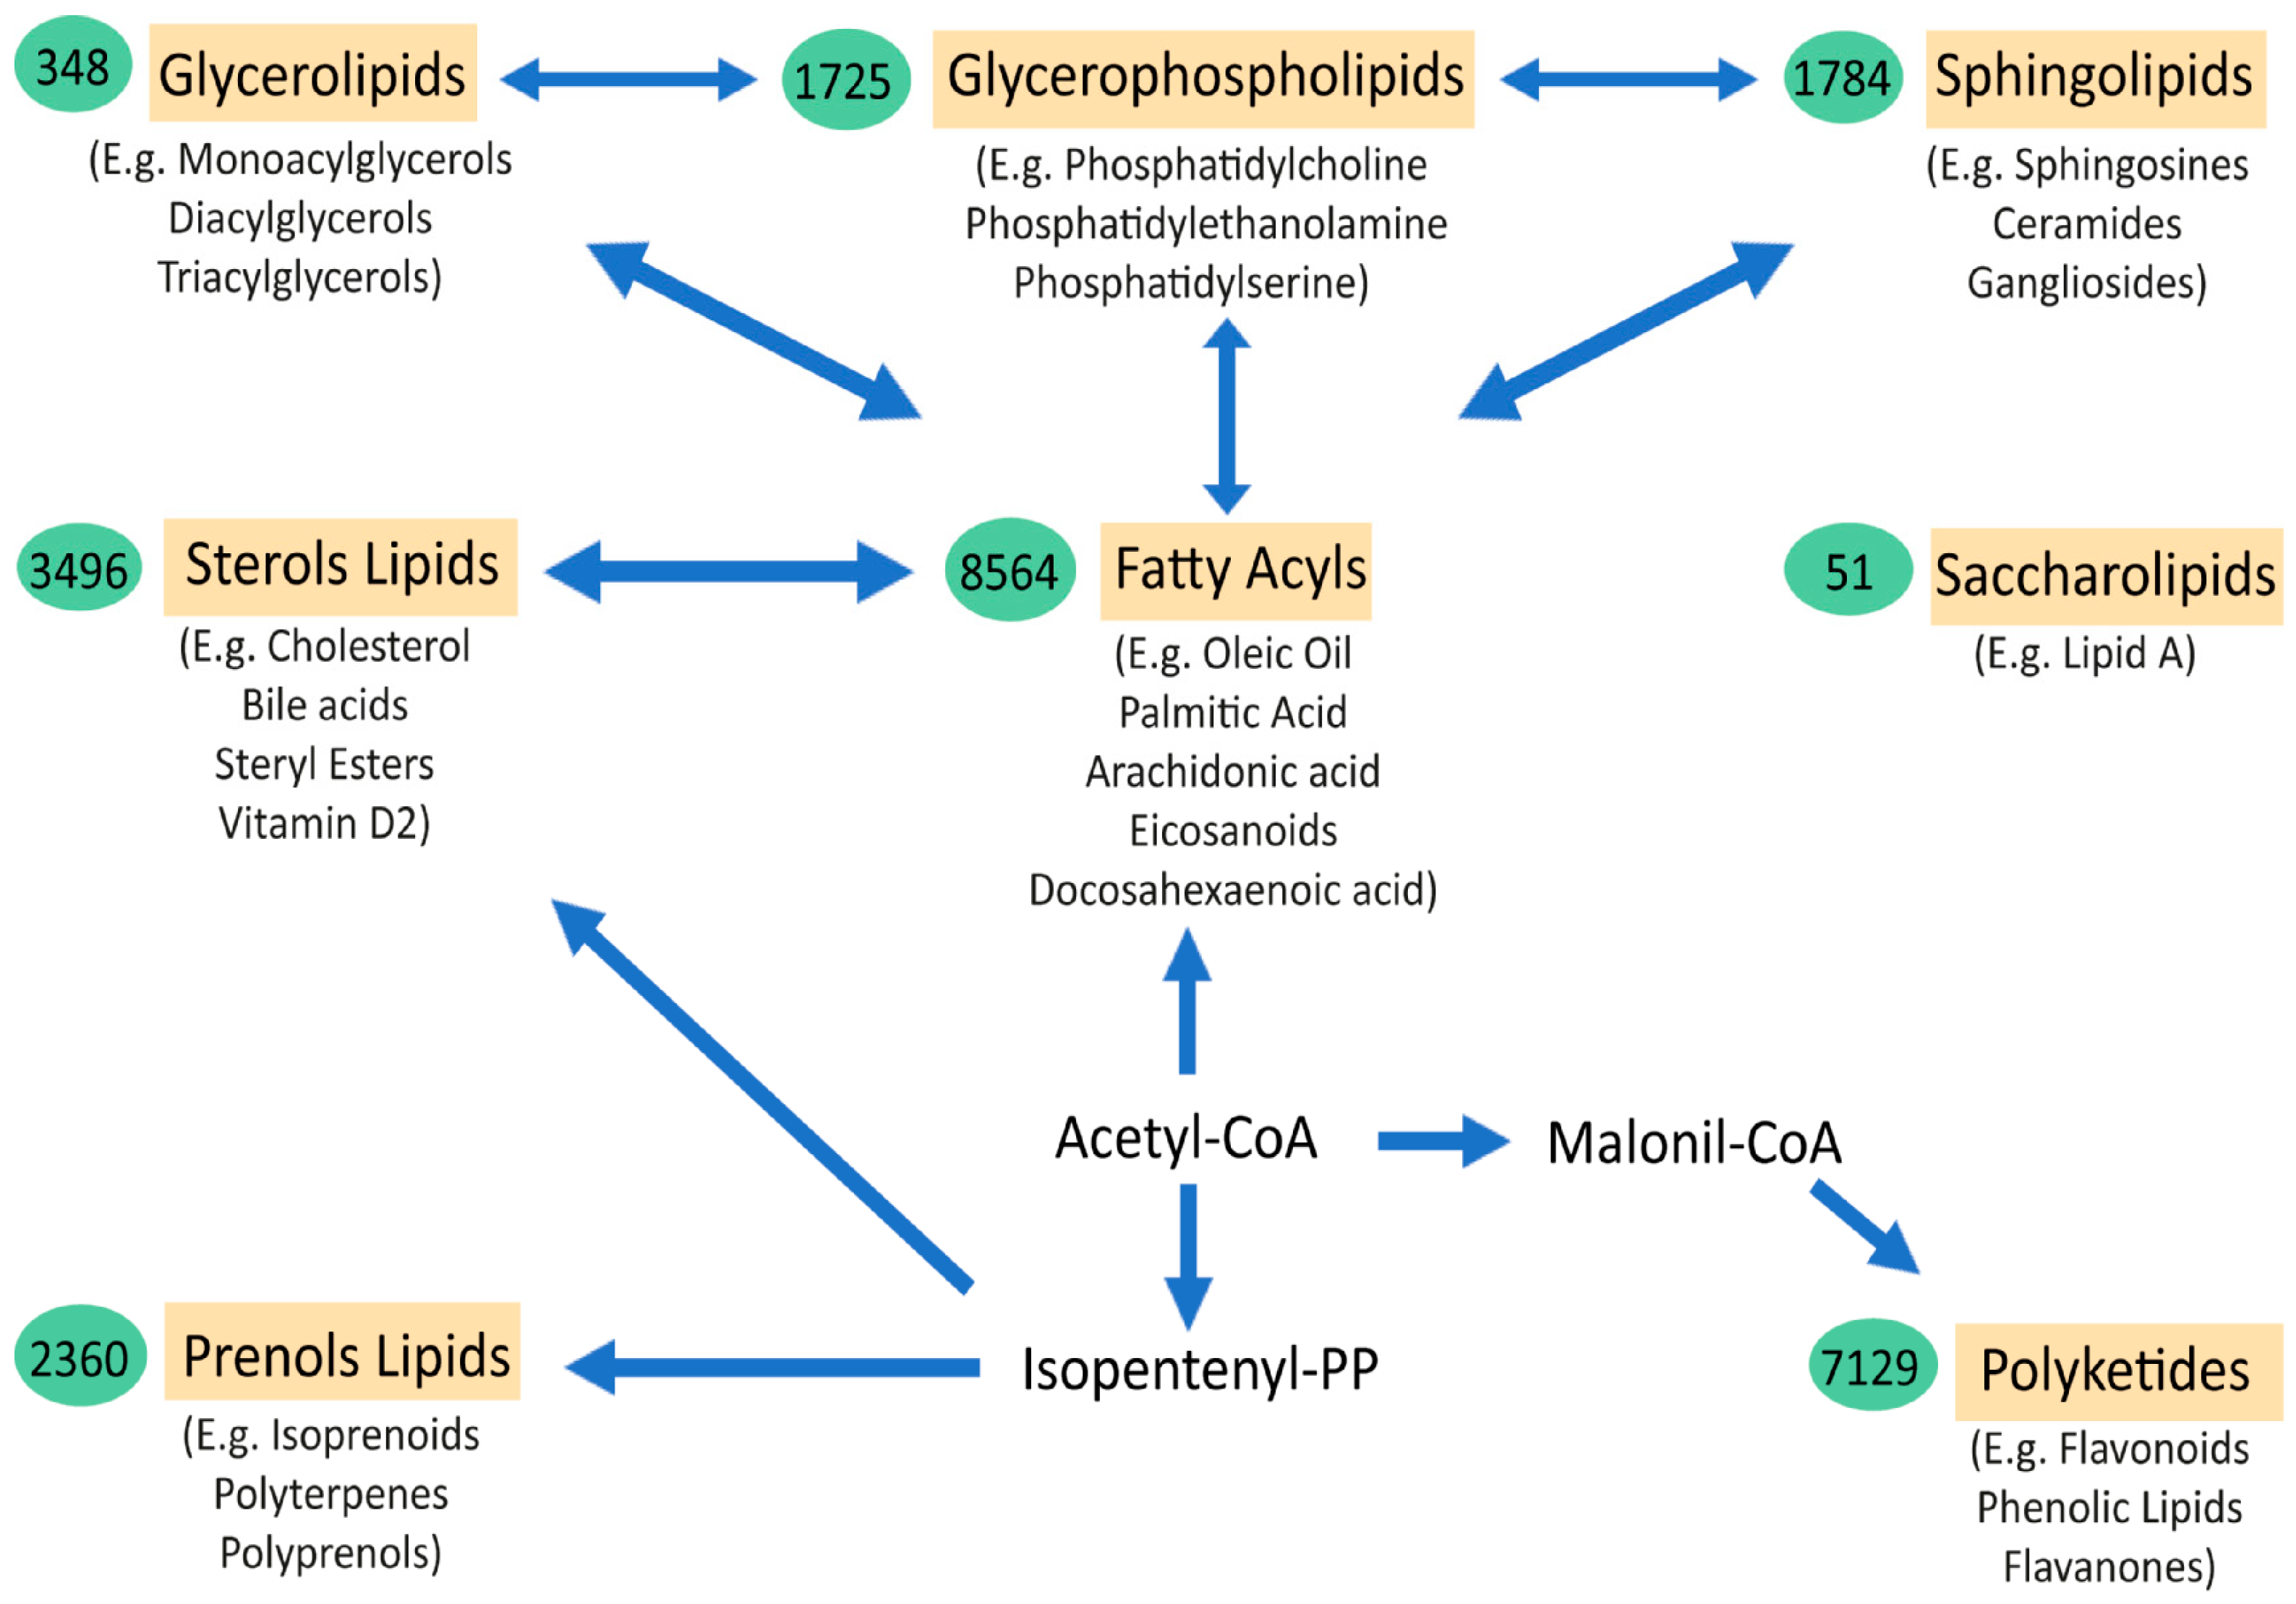
Figure 1. Schematic representation of the major lipid classes and their relations. The relationships between the main categories of mammalian lipids, starting with the 2-carbon precursor acetyl CoA, which is the basis for fatty acid biosynthesis, have been observed. Fatty acyls, in turn, through various modifications, give rise to complex lipids, such as sphingolipids, glycerolipids, glycerophospholipids, and sterols. Another route to generate other classes of lipids from acetyl-CoA is through isopentenyl pyrophosphate, which provides the building blocks for prenols and sterol lipids. Finally, the biosynthesis from acetyl-CoA, via conversion to malonyl-CoA, gives rise to polyketides. Saccharolipids are an unrelated group of lipids that are found in bacteria. The arrows denote multi-step transformations between the main lipid categories from acetyl CoA, isopentenyl pyrophosphate, and malonyl-CoA. The values in the green ovals represent the number of lipid structures curated within each lipid category. Below each lipid class are examples of the most representative molecules of the group [2].
Thus, most lipid classes are interconnected. The study of the complex regulation of lipid metabolism, systemically and in neuronal tissues, has expanded since the introduction of lipidomics and other multiomics approaches in research that are clearly assisting in the understanding of these complex disorders.
In the CNS, lipids, and the fine regulation of lipid metabolism, are central for its correct development and function. Lipids constitute more than half of the dry weight of the brain, which is only second to adipose tissue in lipid content. In the adult brain, the most abundant type of lipid belongs to the glycerophospholipid family, which are the main structural components of cell membranes. These include phosphatidylserine (PS), phosphatidylethanolamine (PE), and phosphatidylcholine (PC), consisting of a head of acylglycerol with two fatty acids. The fatty acids vary among the phospholipids, but the most abundant in the adult brain are the polyunsaturated long fatty acids (PUFAs), such as the omega-3 docosahexaenoic acid (DHA; 22:6n−3) and the omega-6 arachidonic acid (AA; 20:4n−6) [4], e.g., phosphatidylserine (PS) is high in DHA [5]. Changes in the total quantity and the type of fatty acids and PUFAs impact on the properties of membranes, their fluidity, permeability, and signalling. The second most abundant lipid species in the adult brain belong to the cholesterol family. Up to 25% of the total cholesterol of the body is in the brain, and nearly 80% of that cholesterol can be found in myelin in the adult brain [6]. Cholesterol is delivered to the cells by lipoproteins, which are locally synthesised since they cannot pass the blood–brain barrier, especially during the developmental postnatal brain, with synthesis regulated by the myelination rate. Within the CNS, astrocytes and neurons exchange cholesterol thanks to important lipoproteins such as APOE and APOD. Excess cholesterol in the CNS is removed in the form of oxysterols (e.g., 24-hydroxycholesterol). The third most relevant type of lipid in the brain are the sphingolipids, which are mostly derived from the ceramides. Sphingomyelin is the major constituent of the cellular membranes and myelin sheaths. They can also form microdomains and lipid rafts that are crucial for cell communication and signalling.
Therefore, it is not surprising that alterations in the regulation of lipid metabolism in the CNS play major roles in neurological disorders. Lipid metabolism alterations are found in the majority of neurodegenerative disorders (NDDs) [7], including spinal muscular atrophy [8], spinocerebellar ataxia [9], in Huntington’s disease [10], Parkinson’s disease [11], and in Alzheimer’s disease [12][13]. At the same time, the lipidome of a healthy brain also varies with age, and even by brain region and cell type [14][15][16], with higher levels of lipids during the early decades of life and decreased later in aged brains. For example, the amount of total cholesterol is decreased in the healthy ageing brain, and most importantly in the frontal cortex [17]. Curiously, ages 50–55 is the time period when most changes seem to occur [18], which also coincides with whole-body metabolic changes in fat mass, body composition, and energy expenditure [19]. These changes are notable in that they coincide with the average age of onset of neurodegenerative disorders such as amyotrophic lateral sclerosis (ALS) and frontotemporal dementia (FTD).
ALS is a fatal, rapid, progressive neurodegenerative disorder characterised by loss of upper and lower motor neurons of the frontal cortex and spinal cord, leading to a loss of capacity to move, talk (dysarthria), swallow (dysphagia), and ultimately breath (due to weakness of the respiratory muscles), requiring tube feeding and mechanical ventilation at late stages [20][21]. Death typically occurs within 3–5 years from diagnosis and there is no cure [22][23]. Some drugs are clinically available, including riluzole and edaravone, but have shown only a modest effect on survival [24], and no effective disease modifying therapy is available to date. We know of > 30 genes that when mutated can cause dominant or recessive heritable ALS, although this only accounts for ~10% of patients—the cause for the remaining 90% of largely sporadic cases is currently unknown. Frontotemporal dementia is a group of dementias characterised by degeneration of neurons in the frontal and/or anterior temporal lobes of the brain, mainly leading to alterations in behaviour and/or language [25]. In FTD, familial cases are more prevalent (around 30–40%) [26] than in ALS, although most cases are also sporadic. There is a strong overlap in the genes that cause ALS and some forms of FTD; for example, the hexanucleotide GGGGCC (G4C2) repeat expansion in the first intron of the C9ORF72 gene [27][28] is the most common genetic cause of both disorders [28][29]. Conversely, ALS patients with mutations in SOD1 are not expected to develop FTD, whilst FTD tauopathy is not related to motor symptoms. These diseases frequently co-occur in individuals, but the severity of each disorder in individuals varies. For example, some patients present with only motor alterations (pure ALS forms with no apparent dementia associated). At the other end of the spectrum, there are patients with only behavioural and language alterations (pure FTD forms with no apparent motor alterations). In addition, intermediate clinical manifestations occur, with both motor and cognitive-behavioural alterations at different degrees of severity (around 15% of FTD cases show motor alterations [30] and, similarly, more than 50% of ALS cases develop signs of cognitive impairments, with 15% of ALS cases diagnosed with FTD at onset [31][32]). Strikingly, ALS–FTD manifestation can vary within family pedigrees, suggesting non-genetic factors play a part.
Alterations in weight and lipid metabolism are evident in ALS, and it is becoming clear that such alterations are not only a consequence of muscle atrophy and the degenerative process, but are influential in the degree of risk for developing ALS, although underpinning the pathological mechanisms at play requires further research. In relation to FTD, there are now some studies showing metabolic alterations in patients, but the number of studies on lipid metabolism and FTD are much more limited than in ALS (Figure 2).
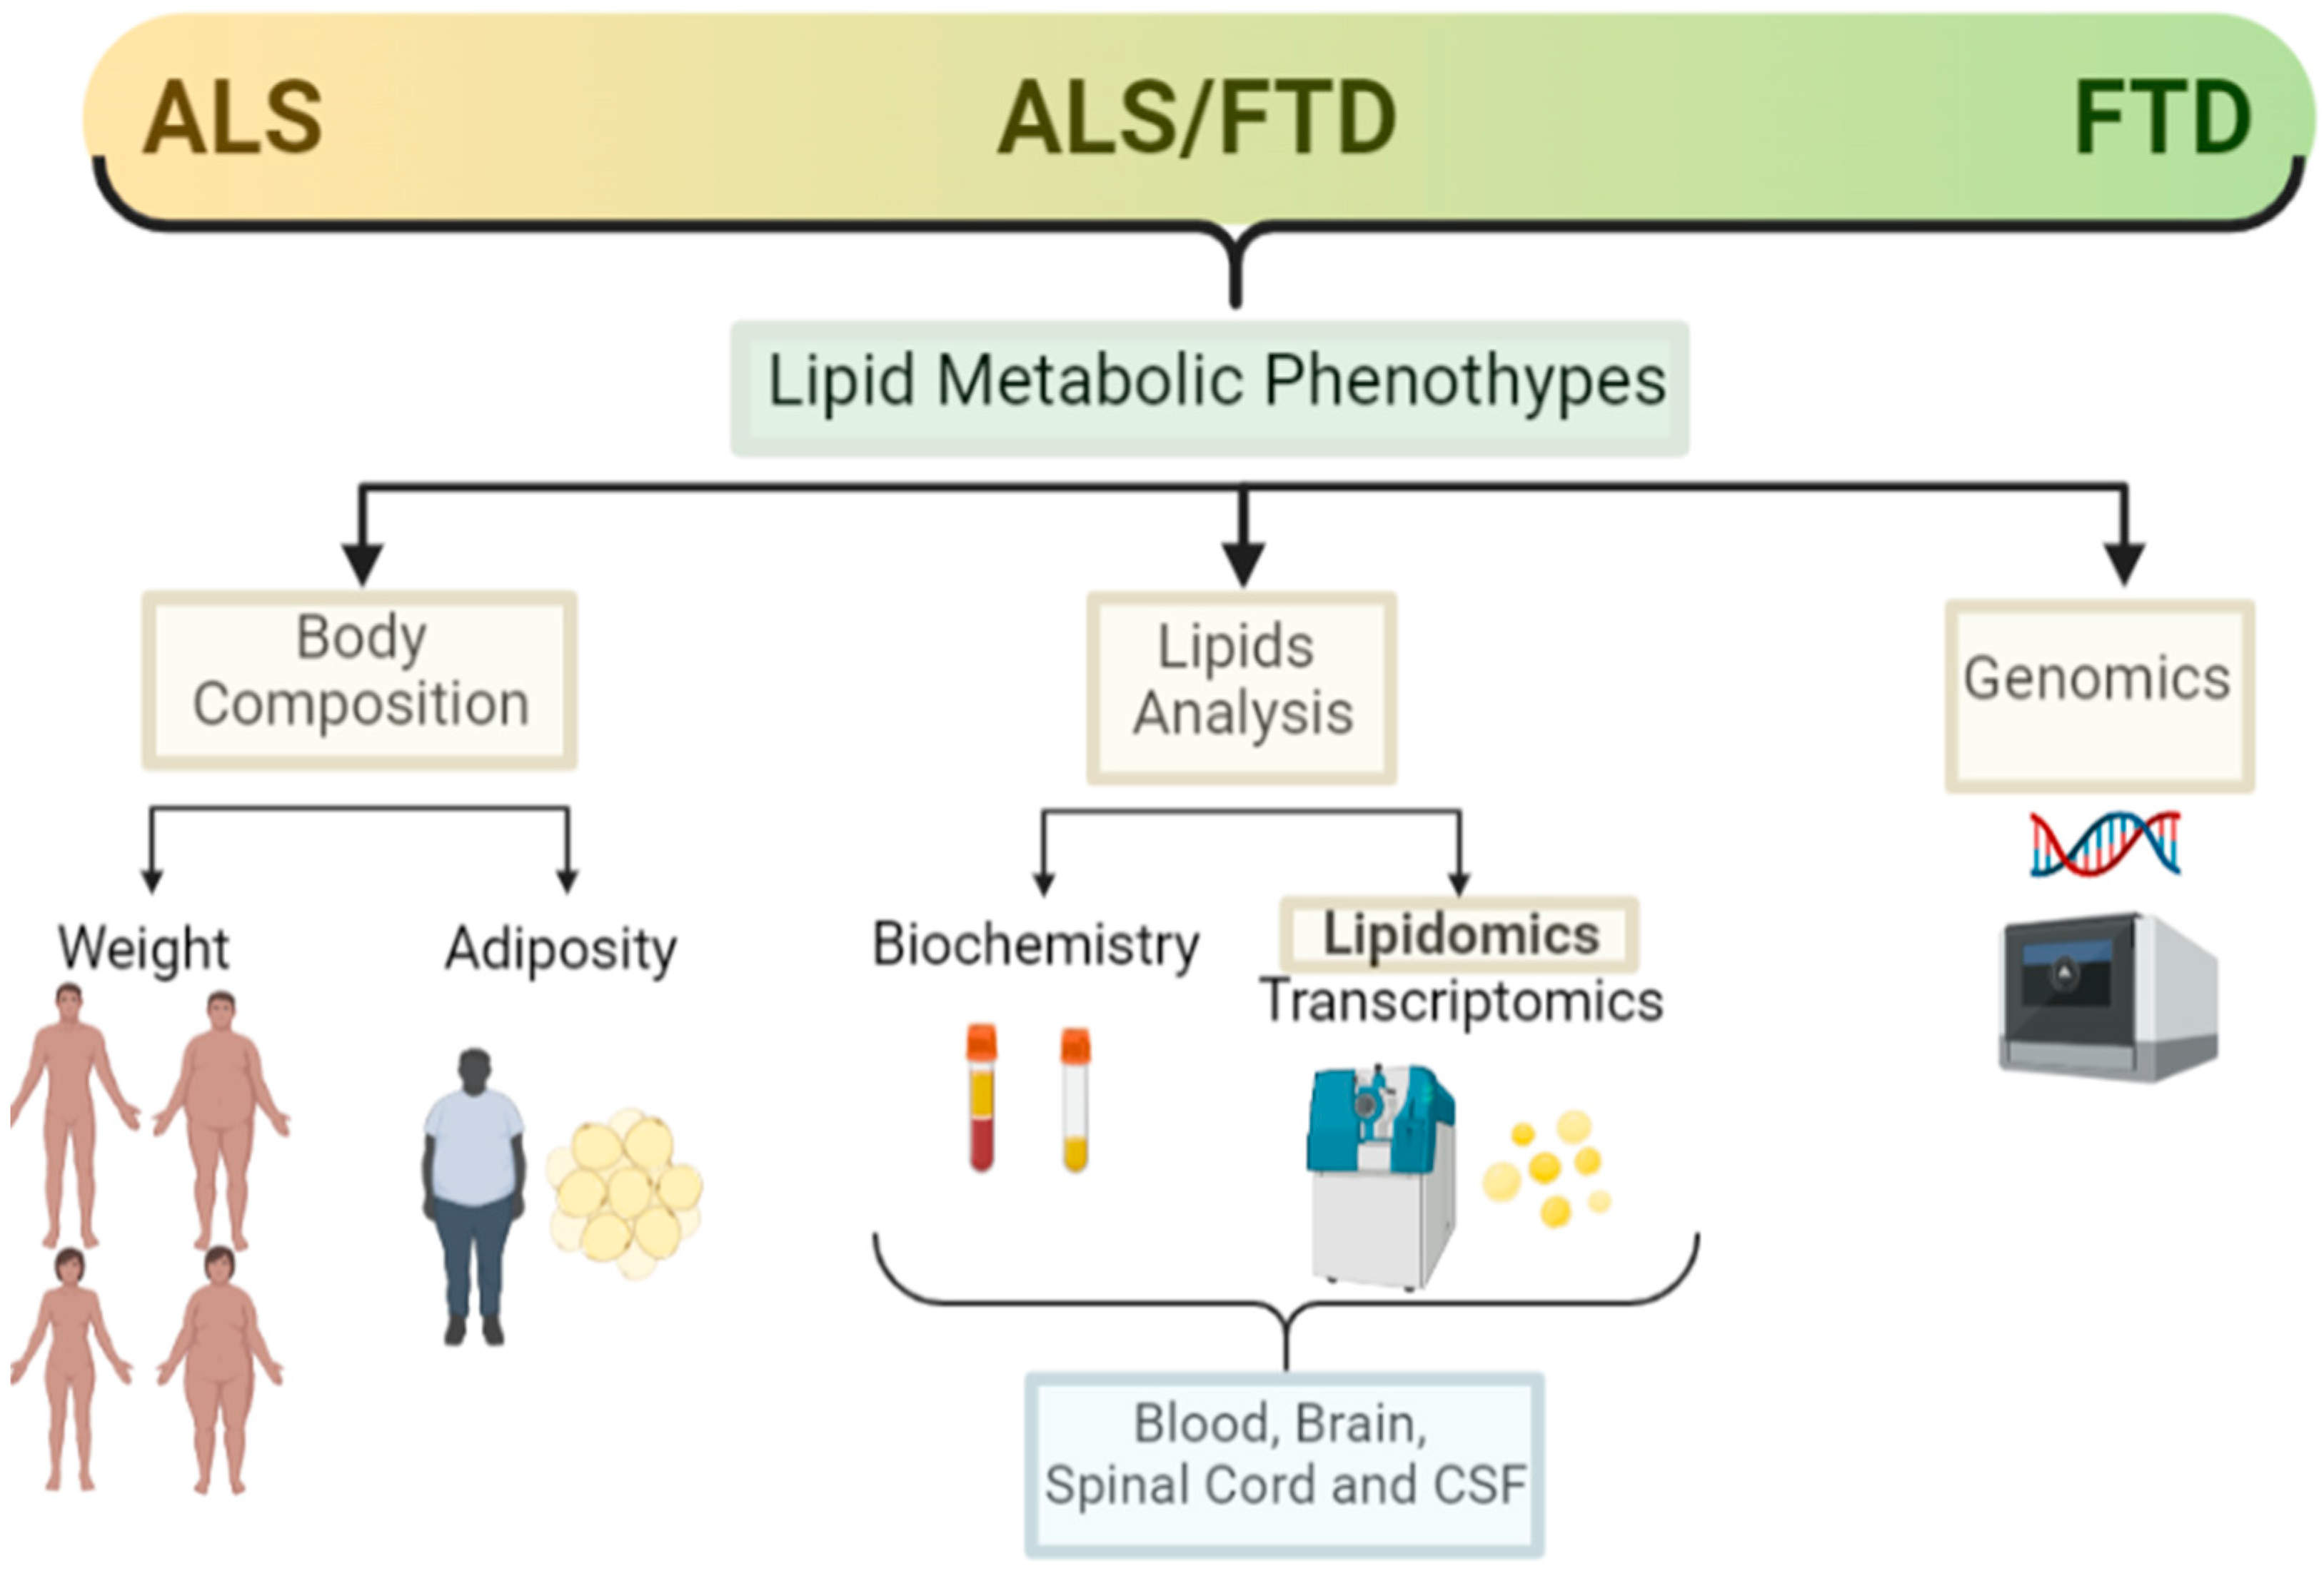
Figure 2. Lipid metabolic clinical features in the ALS–FTD spectrum of disorders. Schematic representation of the main clinical features analysed in ALS and FTD patients in relation to lipid metabolism and the techniques used for those analysis (created with Biorender).
2. Amyotrophic Lateral Sclerosis and Lipid Metabolism
Alterations in the correct regulation of lipid metabolism in ALS are becoming evident [33]. Those alterations can be observed as weight and fat depot changes in patients. Finally, those alterations can be evidenced using more specialised techniques, such as transcriptomics and lipidomics, in blood and in neuronal tissue.
2.1. Weight
Epidemiological studies have revealed that ALS courses with weight loss, even before the onset of motor symptoms in many cases. It has also been shown that BMI is an independent prognostic factor for survival, and the rate of weight loss predicts the progression and severity of the disease [34][35], where more rapid weight loss has a worsening prognosis and survival [34][36][37]. Conversely, patients with no weight loss or weight stabilisation, or patients that were overweight at onset, have a slower disease progression and better prognosis.
Hypermetabolism is present in at least 40% of patients [38][39]. There are increasing studies pointing towards a causal dysregulation of hypothalamic networks that control energy metabolism in the body [40][41], although it warrants further research to draw a conclusive picture. At the same time, ALS patients, especially those with bulbar forms, can progress rapidly due to difficulties with swallowing, chewing, and digestion (dysphagia), resulting in progressive reduced food intake and associated malnutrition that greatly contributes to weight loss at later stages. As expected, there is a negative association between nutritional status and the progression of disease in ALS [42][43].
Whilst the associations of weight loss and ALS prognosis and survival are clear during the course of disease, and can be easily observed and studied, pre-diagnosis association with weight or BMI has been harder to ascertain, relying in part on historical records that may be limited and questionnaires and interviews of the patients. Such studies into pre-symptomatic associations are relatively recent, and many within the control populations are still alive; thus, it is not known whether they could develop ALS later in their lives. Hence, there are some inconsistent conclusions from population studies. Nevertheless, most studies point towards the protective role of a higher BMI before disease onset. Using very large population prospective studies, such as the European Prospective Investigation into Cancer and Nutrition (EPIC) [44] and the Pooling Project of Prospective Studies of Diet and Cancer (DCPP), ALS-research collaboration has been established. In the pan-European prospective cohort (EPIC), out of approximately 500,000 people in the study, 222 developed and died of ALS, and they found a suggestive association between higher BMI at pre-diagnosis and lower risk of ALS [44]. In another collaborative analysis of ten prospective cohorts with 568,070 participants from the general populations of Europe, the US, and Australia, there were 428 women and 204 men who had ALS listed as their cause of death for the analysis, and the pre-diagnostic BMI and waist-to-hip ratio (WHR) were inversely associated with ALS mortality. For a 5 kg/m2 increased BMI, the disease progression rate was 15% lower [45]. From the US National Registry of Veterans, there were 467 patients with ALS and 975 matched controls selected for a study of the impact of pre-diagnosed BMI in ALS, and although there was a positive relation between lower BMI in middle age and higher ALS risk, they found no association between pre-diagnostic BMI and survival [46]. Recently, it has been shown in a longitudinal population-based study (a 30–50 years follow-up study of Norwegian tuberculosis screening program), with nearly 3000 ALS cases detected, that high pre-diagnostic BMI was associated with lower risk of ALS [47]. Thus, it supports previous observations that a higher BMI is a protective factor in ALS (Figure 3).
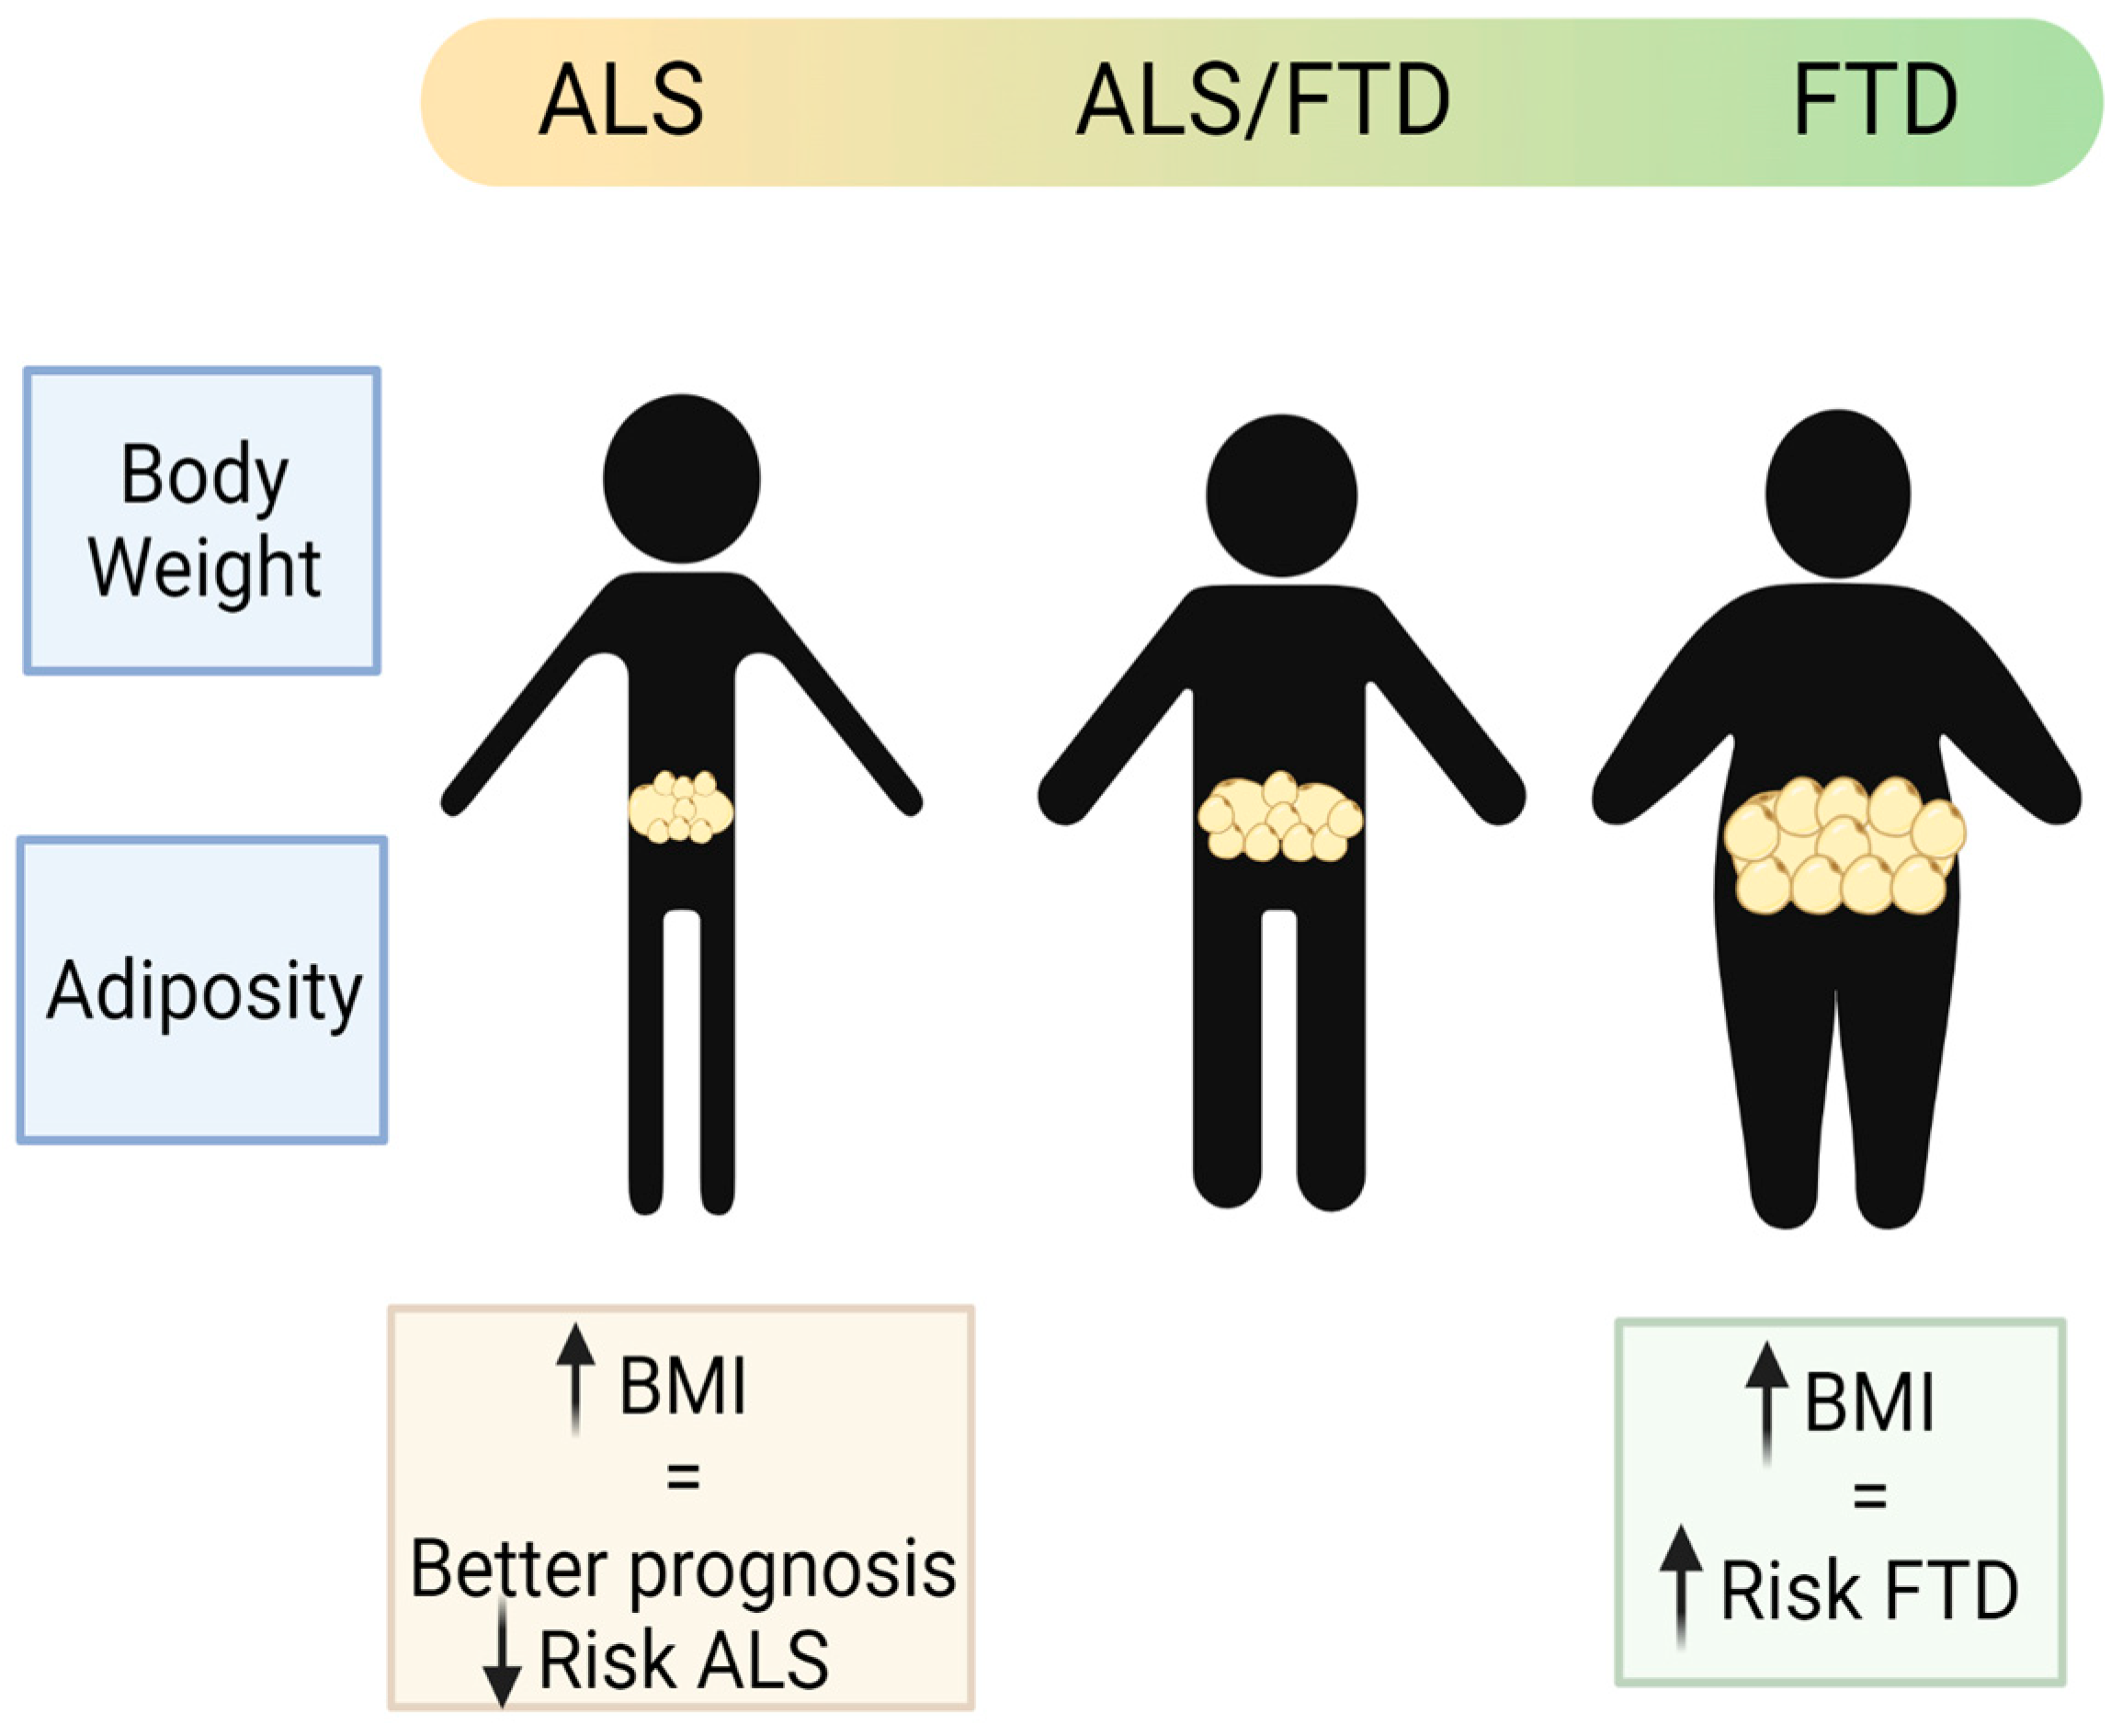
Figure 3. Schematic representation of the main body weight and adiposity features in the patients of the ALS–FTD spectrum of disorders (created with Biorender).
2.2. Adiposity
In terms of adiposity, it has long been accepted that weight loss and lower BMI is strongly correlated with the loss of fat mass (FM). In ALS, there are reports that FM is reduced both in ALS patients and in animal models of ALS [48], and that the rate of this reduction is associated with faster disease progression [49]. This led to studies in mouse models of ALS that found increased lipolysis (mainly in adipose tissue) supported by the finding of elevated plasma free fatty acid (FFA) in patients with ALS. Unfortunately, there are a very few studies that have measured the distribution, amount, and functionality of adipose tissue in ALS patients. Many of those studies in ALS patients are indirect, using body adiposity index, which provides a poor estimate of the fat mass in ALS. Ioannides et al. studied fat mass in ALS by air displacement plethysmography (FM-ADP), describing how loss of BMI is not associated with a loss of FM, but rather with muscle atrophy and fat redistribution [50]. Similarly, another study found that total body fat in ALS patients was not different from healthy controls, but rather the ratio of abdominal subcutaneous versus visceral fat distribution, measured by MRI, was lower. In this study, ALS patients showed a higher proportion of visceral fat than subcutaneous fat [51], resembling the pattern observed in people with higher risk of metabolic disorders. Another observation in some ALS patients is the higher presence of accumulated fat in the liver [52]. All these studies suggest that the total fat mass of the body can be redistributed and differentially accumulated in organs in ALS, contributing to the systemic metabolic alterations observed in these patients (Figure 3).
2.3. Lipid Analysis (Classical, Lipidomic and Other -Omics Analysis)
A major indication of altered metabolism in ALS is the altered levels of circulating lipids; studying such changes may not only provide clues to better understand disease pathomechanisms but also identify biomarkers useful in a clinical setting.
There are many lipid species and intermediates that are not detected by conventional analytical tools. The development of quantitative lipidomics clearly aids the understanding of their characterization and functions. Until the recent development of lipidomics, the reported analysis of altered lipid species in disease situations have been limited to the easily detected and known major lipids, such as total cholesterol (TC), low-density lipoprotein (LDL), high-density lipoprotein (HDL), or triglycerides (TG), and in the great majority of cases those were analysed in the accessible plasma samples of patients.
In recent years, more in-depth lipidomic studies have allowed for identification of a more complex profile from patient blood, cerebrospinal fluid (CSF), and even neuronal tissue samples.
2.4. Genetics
Several genome-wide association studies (GWAS) and exome and whole genome sequencing studies have been conducted in ALS, providing a large amount of information that can be used to identify lipid metabolic genes associated with ALS risk. We can use an informatics tool named mendelian randomization to infer causal relation between a risk factor and disease by using summary statistical results from different genome-wide association studies (GWAS). Using mendelian randomization studies to evaluate the causal relation of particular blood lipid levels (total cholesterol, LDL, HDL and TG) and the risk of sporadic ALS in the European and East Asian populations, only higher LDL levels are positively causally associated with an increased risk of ALS in several studies [53][54][55]. There are some other studies reporting an increasing association of risk-susceptible genes in sporadic ALS, such as the CYP27A1 gene in the cholesterol pathway [56]. The importance of this finding is that it suggests that amongst the dyslipidaemia found in ALS patients, high LDL levels could have a genetic component, suggesting causation rather than correlation. This goes in agreement with the finding that a one-unit increase in LDL cholesterol was associated with a higher incidence of ALS in a population-based study in Sweden [57].
In relation to body weight and weight loss in ALS, single nucleotide polymorphisms (SNPs) in the ACSL5 gene have been associated with lower fat-free mass in ALS patients [58]. This gene encodes a long-chain fatty acid coenzyme A ligase, important for fatty acid degradation that has previously been associated with weight loss in the general population [59]. Similarly, using mendelian randomization analysis, it has been shown that genetically determined higher adiposity and BMI suggestively decreases the risk of developing ALS [60], although these results have not been supported so far by others [55].
Recently, an epigenome wide association study (EWAS) using blood samples from 6763 ALS patients and 2943 controls, identified around 43 methylated loci that were associated to genes that participate in the cholesterol biosynthesis process, metabolism and inflation [61]. Since DNA methylation could be the result of gene-environmental complex interactions and disease progression, those findings support the concept that the metabolic changes observed in ALS patients could be the combination of previous exposures to environmental risk factors and the degenerative disease.
Altogether, it seems that there may still be some hidden complex genetic factors that could influence lipid metabolism and infer altered ALS risk. In this regard, LDL levels of cholesterol and body composition seem to be more genetically determined in ALS patients rather than only a mere consequence of the degenerative process.
3. FTD, Mixed Forms (ALS/FTD) and Lipid Metabolism
There are three clinical subtypes of FTD: the behavioural variant (bvFTD), the non-fluent/non-grammatical progressive primary aphasias (PPA), and the semantic dementia. Not all the clinical FTD forms are part of the dementia-motor neuron disease continuum. The bvFTD is the one that is more frequently found in that continuum. Pathologically, there are TDP43, C9ORF72 and FUS protein aggregate hallmarks that can be found in the bvFTD and FTD-ALS mixed forms. On the contrary, FTD with TAU pathology are not related to motor neuron diseases and are not considered part of the spectrum ALS–FTD [62]. Some studies concerning metabolism in FTD made no distinction in the clinical forms selected in their analysis, or the predominant pathological protein (TDP43 or TAU). Thus, the interpretation of lipid metabolism results in relation to FTD/ALS spectrum might be limited.
3.1. Weight
Contrary to observations in ALS, patients suffering FTD, in particular the behavioural variant (bvFTD), showed increased weight (predominantly reported as BMI) [63]. Comparing AD with the two forms of FTD (bvFTD and semantic variant FTD), and with a group of healthy people, the bvFTD patients had higher BMI than any of the other groups in the study [64]. Interestingly, there are significant differences in BMI across the ALS–FTD spectrum with higher BMI (overweight or obese) in bvFTD patients at one end of the spectrum; low BMI (underweight or normal weight) at the other end of the spectrum in patients with pure ALS forms; and a tendency to overweight in the mixed forms including the ALS-plus and the mixed ALS–FTD group [65] (Figure 3). The higher weight observed in the bvFTD patients is partly attributed to the associated hyperphagic phenotype, even though some might also present hypermetabolism at rest [66]. Supporting this idea, atrophied neuronal networks have been found to be associated with bvFTD patients, which could be directly associated with such hyperphagic behaviour [63].
Unfortunately, FTD has not been as extensively studied as ALS, and so there are less epidemiological studies that could reveal the role of lifelong weight and other lipid metabolic factors associated with disease risk. In one population-based, longitudinal nested case–control study, with 90 patients with FTD, 654 patients with AD, and 116 individuals in the control group, weight data prior to the debut of the disease was recorded with self-assessment questionnaires. There was a significant association of obesity (especially in the middle age) and the risk of FTD [67]. However, the data were related to the prodromal phase; this association may be explained by the data that were related, where there were already changes in food preference and eating habits. Another case–control study, with around 100 FTD patients and 200 healthy age–sex matching controls, found no cardiovascular risk factors associated with FTD, except for diabetes mellitus [68].
Thus, the association of higher BMI and FTD is clear, but it seems as one of the consequences for the hyperphagic and eating habits observed in these patients, whereas the role of high BMI as a risk factor for FTD is not that clear and needs further research.
3.2. Adiposity
bvFTD patients have a higher weight and BMI and that promotes bigger fat depots, measured by indirect impedance [63], in particular visceral fat accumulation. Thus, FTD patients seem to have increased adiposity. It would be interesting to conduct further analysis on different types of bvFTD, stratifying patients by their genetic cause, where known, or by pathological protein hallmarks (e.g., TDP-43, TAU), and certainly by clinical presentation, and whether patients suffer from pure bvFTD or mixed forms with additional motor alterations (ALS–FTD mixed forms).
3.3. Lipid Analysis (Classical, Lipidomic, and Other -Omics Analysis)
The analysis of general lipids by classical clinical biochemistry in blood and plasma has shown that patients with bvFTD present higher levels of TGs, which seems to be correlated with higher BMI [64]. The levels of TGs in blood are not only a consequence of the body’s lipid metabolic regulation but also a reflection of the person’s diet, since nearly two thirds of TGs are diet derived. Since TGs can pass the blood–brain barrier, it is important to consider their levels in blood and reflect the impact that those might have on the brain. Contrary to ALS, LDL cholesterol levels are not altered in the blood of FTD patients. On the other hand, there is some evidence that HDL cholesterol levels are decreased in bvFTD patients [66][69]. Unfortunately, another study could not corroborate these findings and reported higher levels of all cholesterol species analysed in blood [70]. There is therefore controversy between the results obtained in the different studies, indicating that there may be other factors contributing at the population level.
There are very few comprehensive unbiased lipidomics analyses conducted in FTD patients to date. One of the earliest unbiased lipidomic analyses was conducted on blood samples of 16 bvFTD patients compared to 14 AD and 22 healthy controls [71]. This lipidomic analysis corroborated not only the higher TG levels previously described in blood with classical methods but also determined a more descriptive paradigm of the lipid species in bvFTD patients. Those include mainly five lipid classes: for the TGs (16:0) then DGs (18:1/22:0), phosphatidylcholine PC (32:0), phosphatidylserine PS (41:5), and sphingomyelin SM (36:4). Those changes were suggested by the authors as potential biomarkers for bvFTD [71]. A follow-up lipidomic analysis, from blood samples of nearly 40 patients of bvFTD and 22 healthy controls, corroborated the higher levels of total TG in bvFTD patients, and identified differences in other lipid species; in particular, lower levels of cardiolipin and higher levels of inflammatory lipids [72]. Regarding fatty acids, which are the main components of the TGs, they found higher levels of unsaturated fatty acids, both in blood samples and post-mortem brains of FTD patients versus the controls. Since these fatty acids are more prone to lipid peroxidation, the authors then analysed lipid aldehyde by-products, detecting higher levels of proteins conjugated with acrolein (a lipid aldehyde) in blood and brain samples of bvFTD patients [72].
Another targeted lipidomic study, this time directly in post-mortem brain samples from FTD patients, was investigating very-long fatty acid lipids (VLCFA lipids, contain > 26 carbon atoms in the fatty acid chain) in FTD, since higher levels of VLCFA lipids are toxic and can cause early dementia [73][74]. This study found that FTD patients do have higher VLCFA lipid levels in the brain, plus the two enzymes that metabolise them (ELOVL4 and the transporter ABCD1), suggesting that such alterations in lipid metabolic regulation could be a central pathogenic mechanism of this disorder [75].
An interesting study aimed to evaluate whether there is a pattern in relation to alterations in lipid metabolic pathways among the spectrum of TDP43 proteinopathies and their corresponding clinical phenotypes: ALS patients, sporadic FTLD, c9FTLD patients, and compared to healthy controls [76]. The authors analysed post-mortem cerebral cortex tissue from these patients and tried to match findings from transcriptomic analysis of lipid metabolic pathways with lipidomics screening. From the transcriptomic analysis, these authors identified alterations in peroxisome b-oxidation (higher levels of ACAA1 and ACOX3 mRNA in c9FTLD group compared to controls), bile acid biosynthesis (lower levels of CYP27A1 mRNA in sALS and sFTLD-TDP, and much higher in c9FTLD, compared to controls), and biosynthesis of acylcarnitine (higher levels of ACOT mRNA in c9FTLD group compared to controls). Peroxisomes are an important site for cellular lipid metabolism, including β-oxidation of very-long fatty acids (VLCFA) and bile acid production. In the lipidomic analysis, there were higher levels of acylcarnitine, which links β-oxidation in the peroxisome and mitochondria, but the analysis failed to detect differential levels of VLCFA (22:0, 24:0), or bile acid. In general, not many differential lipid species were detected in the frontal cortex of these TDP43 proteinopathies; just 63 out of the total of 1119 lipid species identified were significantly different, and most of them showed decreased levels versus the controls; mainly, glycerophospholipids (phosphocholine PC; phosphoethanolamine PE) and sphingomyelin SM, which might reflect the neurodegenerative process in the brain. The main differences found among the different forms of TDP43 proteinopathies in the frontal cortex were in TG levels (mostly 18:1 oleic acid), which was higher in the ALS group compared to the FTLD-TDP group, and the increased levels of cholesterol ester CE (20:1) in the c9FTLD group. Interestingly, the two branched fatty acid esters of hydroxy fatty acids (FAHFAs) were decreased, which are related to glucose homeostasis and oxidative stress.
In the neuronal tissue studies reported increased levels of TGs and MUFAs, and decreased levels of PC. However, some of these alterations could be a consequence of neurodegenerative process rather than a specific feature of the ALS–FTD spectrum. For example, the increase in TGs in the neuronal tissue found in ALS and FTD also has been described in AD [77]. Furthermore, in ALS there is an increase in the Cer levels in blood, as what happens in PD [78], as well as an increase in post-mortem brain tissue from AD patients [77][79].
3.4. Genetics
Genetic variants are found causally linked to FTD more often than in ALS, with up to 40% of FTD cases of familial, genetic origin and mostly of autosomal dominant inheritance. As in most complex neurodegenerative disorders, there is wide genetic heterogeneity between patients, with several genes and variants implicated, including mutations in the microtubule-associated protein tau gene (MAPT), the progranulin gene (GRN), and repeat expansion in the C9ORF72 gene; these three genes account for nearly 75% of all familial FTD cases. The pathological hexanucleotide repeat expansion in the C9ORF72 gene is the most common causal mutation in ALS, FTD, and mixed forms.
It is very intriguing to observe that patients carrying the exact same mutation, even within families, can develop ALS, bvFTD, or mixed forms. Thus, the genetic background of an individual, together with environmental risk factors, likely contribute to the manifestation of the different clinical forms observed, in both the genetic and sporadic forms.
GWAS studies and other association studies have been able to describe many modifiers or common variants with small effects that contribute to risk. In particular, regarding genes in relation to lipid metabolic regulation, the genetic variants for the APOE gene [80] have a role in determining clinical forms of FTD, with APOE2 being protective and APOE4 increasing the risk of FTD, although these associations have not been entirely reproducible [81].
This entry is adapted from the peer-reviewed paper 10.3390/biomedicines10051105
References
- Fahy, E.; Cotter, D.; Sud, M.; Subramaniam, S. Lipid classification, structures and tools. Biochim. Biophys. Acta Mol. Cell Biol. Lipids 2011, 1811, 637–647.
- Quehenberger, O.; Armando, A.M.; Brown, A.H.; Milne, S.B.; Myers, D.S.; Merrill, A.H.; Bandyopadhyay, S.; Jones, K.N.; Kelly, S.; Shaner, R.L.; et al. Lipidomics reveals a remarkable diversity of lipids in human plasma. J. Lipid Res. 2010, 51, 3299–3305.
- Ghirlanda, G.; Oradei, A.; Manto, A.; Lippa, S.; Uccioli, L.; Caputo, S.; Greco, A.V.; Littarru, G.P. Evidence of Plasma CoQ10-Lowering Effect by HMG-CoA Reductase Inhibitors: A Double-Blind, Placebo-Controlled Study. J. Clin. Pharmacol. 1993, 33, 226–229.
- Martínez, M.; Mougan, I. Fatty acid composition of human brain phospholipids during normal development. J. Neurochem. 2002, 71, 2528–2533.
- Kim, H.-Y.; Huang, B.X.; Spector, A.A. Phosphatidylserine in the brain: Metabolism and function. Prog. Lipid Res. 2014, 56, 1–18.
- Saher, G.; Quintes, S.; Nave, K.-A. Cholesterol: A Novel Regulatory Role in Myelin Formation. Neuroscientist 2011, 17, 79–93.
- Hussain, G.; Wang, J.; Rasul, A.; Anwar, H.; Imran, A.; Qasim, M.; Zafar, S.; Kamran, S.K.S.; Razzaq, A.; Aziz, N.; et al. Role of cholesterol and sphingolipids in brain development and neurological diseases. Lipids Health Dis. 2019, 18, 26.
- Deguise, M.; Baranello, G.; Mastella, C.; Beauvais, A.; Michaud, J.; Leone, A.; De Amicis, R.; Battezzati, A.; Dunham, C.; Selby, K.; et al. Abnormal fatty acid metabolism is a core component of spinal muscular atrophy. Ann. Clin. Transl. Neurol. 2019, 6, 1519–1532.
- Darios, F.; Mochel, F.; Stevanin, G. Lipids in the Physiopathology of Hereditary Spastic Paraplegias. Front. Neurosci. 2020, 14, 74.
- González-Guevara, E.; Cárdenas, G.; Pérez-Severiano, F.; Martínez-Lazcano, J.C. Dysregulated Brain Cholesterol Metabolism Is Linked to Neuroinflammation in Huntington’s Disease. Mov. Disord. 2020, 35, 1113–1127.
- Fanning, S.; Selkoe, D.; Dettmer, U. Parkinson’s disease: Proteinopathy or lipidopathy? NPJ Park. Dis. 2020, 6, 3.
- Luchsinger, J.A.; Cheng, D.; Tang, M.X.; Schupf, N.; Mayeux, R. Central Obesity in the Elderly is Related to Late-onset Alzheimer Disease. Alzheimer Dis. Assoc. Disord. 2012, 26, 101–105.
- Tolppanen, A.-M.; Ngandu, T.; Kåreholt, I.; Laatikainen, T.; Rusanen, M.; Soininen, H.; Kivipelto, M. Midlife and Late-Life Body Mass Index and Late-Life Dementia: Results from a Prospective Population-Based Cohort. J. Alzheimer’s Dis. 2013, 38, 201–209.
- Segatto, M.; Di Giovanni, A.; Marino, M.; Pallottini, V. Analysis of the protein network of cholesterol homeostasis in different brain regions: An age and sex dependent perspective. J. Cell. Physiol. 2012, 228, 1561–1567.
- Fitzner, D.; Bader, J.M.; Penkert, H.; Bergner, C.G.; Su, M.; Weil, M.-T.; Surma, M.A.; Mann, M.; Klose, C.; Simons, M. Cell-Type- and Brain-Region-Resolved Mouse Brain Lipidome. Cell Rep. 2020, 32, 108132.
- Miranda, A.M.; Bravo, F.V.; Chan, R.B.; Sousa, N.; Di Paolo, G.; Gil Oliveira, T. Differential lipid composition and regulation along the hippocampal longitudinal axis. Transl. Psychiatry 2019, 9, 144.
- Jové, M.; Mota-Martorell, N.; Torres, P.; Portero-Otin, M.; Ferrer, I.; Pamplona, R. New insights into human prefrontal cortex aging with a lipidomics approach. Expert Rev. Proteom. 2021, 18, 333–344.
- Yu, Q.; He, Z.; Zubkov, D.; Huang, S.; Kurochkin, I.; Yang, X.; Halene, T.; Willmitzer, L.; Giavalisco, P.; Akbarian, S.; et al. Lipidome alterations in human prefrontal cortex during development, aging, and cognitive disorders. Mol. Psychiatry 2018, 25, 2952–2969.
- Speakman, J.R.; Westerterp, K.R. Associations between energy demands, physical activity, and body composition in adult humans between 18 and 96 y of age. Am. J. Clin. Nutr. 2010, 92, 826–834.
- Kiernan, M.C.; Vucic, S.; Talbot, K.; McDermott, C.J.; Hardiman, O.; Shefner, J.M.; Al-Chalabi, A.; Huynh, W.; Cudkowicz, M.; Talman, P.; et al. Improving clinical trial outcomes in amyotrophic lateral sclerosis. Nat. Rev. Neurol. 2020, 17, 104–118.
- Lamas, N.J.; Roybon, L. Harnessing the Potential of Human Pluripotent Stem Cell-Derived Motor Neurons for Drug Discovery in Amyotrophic Lateral Sclerosis: From the Clinic to the Laboratory and Back to the Patient. Front. Drug Discov. 2021, 1.
- Taylor, J.P.; Brown, R.H., Jr.; Cleveland, D.W. Decoding ALS: From genes to mechanism. Nature 2016, 539, 197–206.
- Brown, R.H.; Al-Chalabi, A. Amyotrophic Lateral Sclerosis. N. Engl. J. Med. 2017, 377, 162–172.
- Chiò, A.; Mazzini, L.; Mora, G. Disease-modifying therapies in amyotrophic lateral sclerosis. Neuropharmacology 2020, 167, 107986.
- Faber, R.; Neary, D. Frontotemporal lobar degeneration: A consensus on clinical diagnostic criteria. Neurology 1999, 53, 1158.
- Seltman, R.E.; Matthews, B.R. Frontotemporal Lobar Degeneration. CNS Drugs 2012, 26, 841–870.
- DeJesus-Hernandez, M.; Mackenzie, I.R.; Boeve, B.F.; Boxer, A.L.; Baker, M.; Rutherford, N.J.; Nicholson, A.M.; Finch, N.A.; Flynn, H.; Adamson, J.; et al. Expanded GGGGCC Hexanucleotide Repeat in Noncoding Region of C9ORF72 Causes Chromosome 9p-Linked FTD and ALS. Neuron 2011, 72, 245–256.
- Renton, A.E.; Majounie, E.; Waite, A.; Simon-Saánchez, J.; Rollinson, S.; Gibbs, J.R.; Schymick, J.C.; Laaksovirta, H.; van Swieten, J.C.; Myllykangas, L.; et al. A Hexanucleotide Repeat Expansion in C9ORF72 Is the Cause of Chromosome 9p21-Linked ALS-FTD. Neuron 2011, 72, 257–268.
- Pytel, V.; Hernández-Lorenzo, L.; Torre-Fuentes, L.; Sanz, R.; González, N.; Cabrera-Martín, M.N.; Delgado-Álvarez, A.; Gómez-Pinedo, U.; Matías-Guiu, J.; Matias-Guiu, J.A. Whole-Exome Sequencing and C9orf72 Analysis in Primary Progressive Aphasia. J. Alzheimer’s Dis. 2021, 80, 985–990.
- Ling, S.-C.; Polymenidou, M.; Cleveland, D.W. Converging Mechanisms in ALS and FTD: Disrupted RNA and Protein Homeostasis. Neuron 2013, 79, 416–438.
- Ringholz, G.M.; Appel, S.H.; Bradshaw, M.; Cooke, N.A.; Mosnik, D.M.; Schulz, P.E. Prevalence and patterns of cognitive impairment in sporadic ALS. Neurology 2005, 65, 586–590.
- Huynh, W.; Ahmed, R.; Mahoney, C.J.; Nguyen, C.; Tu, S.; Caga, J.; Loh, P.; Lin, C.S.-Y.; Kiernan, M.C. The impact of cognitive and behavioral impairment in amyotrophic lateral sclerosis. Expert Rev. Neurother. 2020, 20, 281–293.
- Tracey, T.; Kirk, S.; Steyn, F.; Ngo, S. The role of lipids in the central nervous system and their pathological implications in amyotrophic lateral sclerosis. Semin. Cell Dev. Biol. 2020, 112, 69–81.
- Shimizu, T.; Nakayama, Y.; Matsuda, C.; Haraguchi, M.; Bokuda, K.; Ishikawa-Takata, K.; Kawata, A.; Isozaki, E. Prognostic significance of body weight variation after diagnosis in ALS: A single-centre prospective cohort study. J. Neurol. 2019, 266, 1412–1420.
- Paganoni, S.; Deng, J.; Jaffa, M.; Cudkowicz, M.E.; Wills, A.-M. Body mass index, not dyslipidemia, is an independent predictor of survival in amyotrophic lateral sclerosis. Muscle Nerve 2011, 44, 20–24.
- Van Mantgem, M.R.J.; van Eijk, R.P.; van der Burgh, H.K.; Tan, H.H.; Westeneng, H.J.; van Es, M.A.; Veldink, J.H.; van den Berg, L.H. Prognostic value of weight loss in patients with amyotrophic lateral sclerosis: A population-based study. J. Neurol. Neurosurg. Psychiatry 2020, 91, 867–875.
- Moglia, C.; Calvo, A.; Grassano, M.; Canosa, A.; Manera, U.; D’Ovidio, F.; Bombaci, A.; Bersano, E.; Mazzini, L.; Mora, G.; et al. Early weight loss in amyotrophic lateral sclerosis: Outcome relevance and clinical correlates in a population-based cohort. J. Neurol. Neurosurg. Psychiatry 2019, 90, 666–673.
- Steyn, F.J.; Ioannides, Z.A.; Van Eijk, R.P.; Heggie, S.; Thorpe, K.A.; Ceslis, A.; Heshmat, S.; Henders, A.K.; Wray, N.R.; van den Berg, L.H.; et al. Hypermetabolism in ALS is associated with greater functional decline and shorter survival. J. Neurol. Neurosurg. Psychiatry 2018, 89, 1016–1023.
- Jésus, P.; Fayemendy, P.; Nicol, M.; Lautrette, G.; Sourisseau, H.; Preux, P.-M.; Desport, J.-C.; Marin, B.; Couratier, P. Hypermetabolism is a deleterious prognostic factor in patients with amyotrophic lateral sclerosis. Eur. J. Neurol. 2017, 25, 97–104.
- Gorges, M.; Vercruysse, P.; Müller, H.-P.; Huppertz, H.-J.; Rosenbohm, A.; Nagel, G.; Weydt, P.; Petersén, Å.; Ludolph, A.C.; Kassubek, J.; et al. Hypothalamic atrophy is related to body mass index and age at onset in amyotrophic lateral sclerosis. J. Neurol. Neurosurg. Psychiatry 2017, 88, 1033–1041.
- Bayer, D.; Antonucci, S.; Müller, H.P.; Saad, R.; Dupuis, L.; Rasche, V.; Böckers, T.M.; Ludolph, A.C.; Kassubek, J.; Roselli, F. Disruption of orbitofrontal-hypothalamic projections in a murine ALS model and in human patients. Transl. Neurodegener. 2021, 10, 17.
- López-Gómez, J.J.; Ballesteros-Pomar, M.D.; Torres-Torres, B.; De la Maza, B.P.; Penacho-Lázaro, M.; Palacio-Mures, J.M.; Abreu-Padín, C.; López-Guzmán, A.; De Luis-Román, D.A. Malnutrition at diagnosis in amyotrophic lateral sclerosis (als) and its influence on survival: Using glim criteria. Clin. Nutr. 2020, 40, 237–244.
- Park, Y.; Park, J.; Kim, Y.; Baek, H.; Kim, S.H. Association between nutritional status and disease severity using the amyotrophic lateral sclerosis (ALS) functional rating scale in ALS patients. Nutrition 2015, 31, 1362–1367.
- Gallo, V.; Wark, P.A.; Jenab, M.; Pearce, N.; Brayne, C.; Vermeulen, R.; Andersen, P.M.; Hallmans, G.; Kyrozis, A.; Vanacore, N.; et al. Prediagnostic body fat and risk of death from amyotrophic lateral sclerosis: The EPIC cohort. Neurology 2013, 80, 829–838.
- O’Reilly, J.; Wang, M.; Adami, H.-O.; Alonso, A.; Bernstein, L.; Brandt, P.V.D.; Buring, J.; Daugherty, S.; Deapen, D.; Freedman, D.M.; et al. Prediagnostic body size and risk of amyotrophic lateral sclerosis death in 10 studies. Amyotroph. Lateral Scler. Front. Degener. 2018, 19, 396–406.
- Mariosa, D.; Beard, J.; Umbach, D.M.; Bellocco, R.; Keller, J.; Peters, T.L.; Allen, K.D.; Ye, W.; Sandler, D.P.; Schmidt, S.; et al. Body Mass Index and Amyotrophic Lateral Sclerosis: A Study of US Military Veterans. Am. J. Epidemiol. 2017, 185, 362–371.
- Nakken, O.; Meyer, H.E.; Stigum, H.; Holmøy, T. High BMI is associated with low ALS risk. Neurology 2019, 93, e424–e432.
- Dupuis, L.; Oudart, H.; René, F.; de Aguilar, J.-L.G.; Loeffler, J.-P. Evidence for defective energy homeostasis in amyotrophic lateral sclerosis: Benefit of a high-energy diet in a transgenic mouse model. Proc. Natl. Acad. Sci. USA 2004, 101, 11159–11164.
- Lee, I.; Kazamel, M.; McPherson, T.; McAdam, J.; Bamman, M.; Amara, A.; Smith, D.L., Jr.; King, P.H. Fat mass loss correlates with faster disease progression in amyotrophic lateral sclerosis patients: Exploring the utility of dual-energy x-ray absorptiometry in a prospective study. PLoS ONE 2021, 16, e0251087.
- Ioannides, Z.A.; Steyn, F.; Henderson, R.D.; McCombe, P.A.; Ngo, S. Anthropometric measures are not accurate predictors of fat mass in ALS. Amyotroph. Lateral Scler. Front. Degener. 2017, 18, 486–491.
- Lindauer, E.; Dupuis, L.; Müller, H.-P.; Neumann, H.; Ludolph, A.C.; Kassubek, J. Adipose Tissue Distribution Predicts Survival in Amyotrophic Lateral Sclerosis. PLoS ONE 2013, 8, e67783.
- Dupuis, L.; Corcia, P.; Fergani, A.; De Aguilar, J.-L.G.; Bonnefont-Rousselot, D.; Bittar, R.; Seilhean, D.; Hauw, J.-J.; Lacomblez, L.; Loeffler, J.-P.; et al. Dyslipidemia is a protective factor in amyotrophic lateral sclerosis. Neurology 2008, 70, 1004–1009.
- Chen, X.; Yazdani, S.; Piehl, F.; Magnusson, P.K.; Fang, F. Polygenic link between blood lipids and amyotrophic lateral sclerosis. Neurobiol. Aging 2018, 67, 202.e1–202.e6.
- Bandres-Ciga, S.; Noyce, A.J.; Hemani, G.; Nicolas, A.; Calvo, A.; Mora, G.; Arosio, A.; Barberis, M.; Bartolomei, I.; Battistini, S.; et al. Shared polygenic risk and causal inferences in amyotrophic lateral sclerosis. Ann. Neurol. 2019, 85, 470–481.
- Esteban-García, N.; Fernández-Beltrán, L.C.; Godoy-Corchuelo, J.M.; Ayala, J.L.; Matias-Guiu, J.A.; Corrochano, S. Body Complexion and Circulating Lipids in the Risk of TDP-43 Related Disorders. Front. Aging Neurosci. 2022, 14, 838141.
- Diekstra, F.P.; Saris, C.G.J.; Van Rheenen, W.; Franke, L.; Jansen, R.C.; Van Es, M.A.; Van Vught, P.W.J.; Blauw, H.M.; Groen, E.J.N.; Horvath, S.; et al. Mapping of Gene Expression Reveals CYP27A1 as a Susceptibility Gene for Sporadic ALS. PLoS ONE 2012, 7, e35333.
- Mariosa, D.; Hammar, N.; Malmström, H.; Ingre, C.; Jungner, I.; Ye, W.; Fang, F.; Walldius, G. Blood biomarkers of carbohydrate, lipid, and apolipoprotein metabolisms and risk of amyotrophic lateral sclerosis: A more than 20-year follow-up of the Swedish AMORIS cohort. Ann. Neurol. 2017, 81, 718–728.
- Iacoangeli, A.; Lin, T.; Al Khleifat, A.; Jones, A.R.; Opie-Martin, S.; Coleman, J.R.; Shatunov, A.; Sproviero, W.; Williams, K.L.; Garton, F.; et al. Genome-wide Meta-analysis Finds the ACSL5-ZDHHC6 Locus Is Associated with ALS and Links Weight Loss to the Disease Genetics. Cell Rep. 2020, 33, 108323.
- Adamo, K.; Dent, R.; Langefeld, C.D.; Cox, M.; Williams, K.; Carrick, K.M.; Stuart, J.S.; Sundseth, S.S.; Harper, M.-E.; McPherson, R.; et al. Peroxisome Proliferator-activated Receptor γ 2 and Acyl-CoA Synthetase 5 Polymorphisms Influence Diet Response. Obesity 2007, 15, 1068–1075.
- Zhang, L.; Tang, L.; Huang, T.; Fan, D. Life Course Adiposity and Amyotrophic Lateral Sclerosis: A Mendelian Randomization Study. Ann. Neurol. 2020, 87, 434–441.
- Hop, P.J.; Zwamborn, R.A.; Hannon, E.; Shireby, G.L.; Nabais, M.F.; Walker, E.M.; van Rheenen, W.; van Vugt, J.J.; Dekker, A.M.; Westeneng, H.-J.; et al. Genome-wide study of DNA methylation shows alterations in metabolic, inflammatory, and cholesterol pathways in ALS. Sci. Transl. Med. 2022, 14, eabj0264.
- Burrell, J.R.; Halliday, G.M.; Kril, J.J.; Ittner, L.M.; Götz, J.; Kiernan, M.C.; Hodges, J.R. The frontotemporal dementia-motor neuron disease continuum. Lancet 2016, 388, 919–931.
- Ahmed, R.M.; Landin-Romero, R.; Liang, C.T.; Keogh, J.M.; Henning, E.; Strikwerda-Brown, C.; Devenney, E.M.; Hodges, J.R.; Kiernan, M.C.; Farooqi, S.; et al. Neural networks associated with body composition in frontotemporal dementia. Ann. Clin. Transl. Neurol. 2019, 6, 1707–1717.
- Ahmed, R.M.; MacMillan, M.; Bartley, L.; Halliday, G.M.; Kiernan, M.C.; Hodges, J.R.; Piguet, O. Systemic metabolism in frontotemporal dementia. Neurology 2014, 83, 1812–1818.
- Ahmed, R.M.; Mioshi, E.; Caga, J.; Shibata, M.; Zoing, M.; Bartley, L.; Piguet, O.; Hodges, J.R.; Kiernan, M.C. Body mass index delineates ALS from FTD: Implications for metabolic health. J. Neurol. 2014, 261, 1774–1780.
- Ahmed, R.M.; Highton-Williamson, E.; Caga, J.; Thornton, N.; Ramsey, E.; Zoing, M.; Kim, W.S.; Halliday, G.M.; Piguet, O.; Hodges, J.R.; et al. Lipid Metabolism and Survival Across the Frontotemporal Dementia-Amyotrophic Lateral Sclerosis Spectrum: Relationships to Eating Behavior and Cognition. J. Alzheimer’s Dis. 2017, 61, 773–783.
- Eid, H.R.; Rosness, T.A.; Bosnes, O.; Salvesen, Ø.; Knutli, M.; Stordal, E. Smoking and Obesity as Risk Factors in Frontotemporal Dementia and Alzheimer’s Disease: The HUNT Study. Dement. Geriatr. Cogn. Disord. Extra 2019, 9, 1–10.
- Golimstok, A.; Cámpora, N.; Rojas, J.I.; Fernandez, M.C.; Elizondo, C.M.; Soriano, E.; Cristiano, E. Cardiovascular risk factors and frontotemporal dementia: A case–control study. Transl. Neurodegener. 2014, 3, 13.
- Kim, W.S.; He, Y.; Phan, K.; Ahmed, R.M.; Rye, K.-A.; Piguet, O.; Hodges, J.R.; Halliday, G.M. Altered High Density Lipoprotein Composition in Behavioral Variant Frontotemporal Dementia. Front. Neurosci. 2018, 12, 847.
- Wang, P.; Zhang, H.; Wang, Y.; Zhang, M.; Zhou, Y. Plasma cholesterol in Alzheimer’s disease and frontotemporal dementia. Transl. Neurosci. 2020, 11, 116–123.
- Kim, W.S.; Jary, E.; Pickford, R.; He, Y.; Ahmed, R.M.; Piguet, O.; Hodges, J.R.; Halliday, G.M. Lipidomics Analysis of Behavioral Variant Frontotemporal Dementia: A Scope for Biomarker Development. Front. Neurol. 2018, 9, 104.
- Phan, K.; He, Y.; Pickford, R.; Bhatia, S.; Katzeff, J.S.; Hodges, J.R.; Piguet, O.; Halliday, G.M.; Kim, W.S. Uncovering pathophysiological changes in frontotemporal dementia using serum lipids. Sci. Rep. 2020, 10, 3640.
- Schönfeld, P.; Reiser, G. Brain Lipotoxicity of Phytanic Acid and Very Long-chain Fatty Acids. Harmful Cellular/Mitochondrial Activities in Refsum Disease and X-Linked Adrenoleukodystrophy. Aging Dis. 2016, 7, 136–149.
- Hopiavuori, B.R.; Deák, F.; Wilkerson, J.L.; Brush, R.S.; Rocha-Hopiavuori, N.A.; Hopiavuori, A.R.; Ozan, K.G.; Sullivan, M.T.; Wren, J.D.; Georgescu, C.; et al. Homozygous Expression of Mutant ELOVL4 Leads to Seizures and Death in a Novel Animal Model of Very Long-Chain Fatty Acid Deficiency. Mol. Neurobiol. 2017, 55, 1795–1813.
- He, Y.; Phan, K.; Bhatia, S.; Pickford, R.; Fu, Y.; Yang, Y.; Hodges, J.R.; Piguet, O.; Halliday, G.M.; Kim, W.S. Increased VLCFA-lipids and ELOVL4 underlie neurodegeneration in frontotemporal dementia. Sci. Rep. 2021, 11, 21348.
- Andrés-Benito, P.; Gelpi, E.; Jové, M.; Mota-Martorell, N.; Obis, È.; Portero-Otin, M.; Povedano, M.; Pujol, A.; Pamplona, R.; Ferrer, I. Lipid alterations in human frontal cortex in ALS-FTLD-TDP43 proteinopathy spectrum are partly related to peroxisome impairment. Neuropathol. Appl. Neurobiol. 2020, 47, 544–563.
- Akyol, S.; Ugur, Z.; Yilmaz, A. Lipid profiling of Alzheimer’s disease brain highlights enrichment in glycer-ol(Phospho)lipid, and sphingolipid metabolism. Cells 2021, 10, 2591.
- Serum Lipid Alterations in GBA—Associated Parkinson’s Disease—ClinicalKey. Available online: https://www.clinicalkey.es/#!/content/playContent/1-s2.0-S135380201730322X?returnurl=https:%2F%2Flinkinghub.elsevier.com%2Fretrieve%2Fpii%2FS135380201730322X%3Fshowall%3Dtrue&referrer=https:%2F%2Fpubmed.ncbi.nlm.nih.gov%2F (accessed on 29 April 2022).
- Filippov, V.; Song, M.A.; Zhang, K.; Vinters, H.V.; Tung, S.; Kirsch, W.M.; Yang, J.; Duerksen-Hughes, P.J. Increased Ceramide in Brains with Alzheimer’s and Other Neurodegenerative Diseases. J. Alzheimer’s Dis. 2012, 29, 537–547.
- Mishra, A.; Ferrari, R.; Heutink, P.; Hardy, J.; Pijnenburg, Y.; Posthuma, D. Gene-based association studies report genetic links for clinical subtypes of frontotemporal dementia. Brain 2017, 140, 1437–1446.
- Su, W.-H.; Shi, Z.-H.; Liu, S.-L.; Wang, X.-D.; Liu, S.; Ji, Y. Updated meta-analysis of the role of APOE ε2/ε3/ε4 alleles in frontotemporal lobar degeneration. Oncotarget 2017, 8, 43721–43732.
This entry is offline, you can click here to edit this entry!