Your browser does not fully support modern features. Please upgrade for a smoother experience.
Please note this is an old version of this entry, which may differ significantly from the current revision.
There are insufficient accurate biomarkers and effective therapeutic targets in current cancer treatment. Multi-omics regulatory networks in patient bulk tumors and single cells can shed light on molecular disease mechanisms. Integration of multi-omics data with large-scale patient electronic medical records (EMRs) can lead to the discovery of biomarkers and therapeutic targets.
- biomarkers
- therapeutic targets
- multi-omics regulatory networks
- single cells
- Prediction Logic Boolean Implication Networks (PLBINs)
1. Introduction
The Cancer Moonshot project was launched in 2016 to accelerate scientific discovery, foster collaboration, and improve data sharing in cancer research[1]. The current unmet clinical needs in cancer treatment include a lack of biomarkers for precise assessment of cancer risk, tumor progression, recurrence, and treatment response in individual patients. More effective therapeutic targets are needed to improve patient survival outcomes.
The advent of high-throughput sequencing technology has led to the discovery of abnormal genomic variants in cancer patients as novel therapeutic targets, such as the EML4-ALK fusion gene in non-small-cell lung cancer (NSCLC)[2]. In addition, the blockade of immune checkpoint inhibitors (ICIs), including PD1, PDL1, and CTLA4, has improved cancer patient survival outcomes[3][4][5][6][7][8][9]. However, there are currently no established predictive biomarkers in immunotherapy, as PDL1 and tumor mutational burdens are not proven indicators[10]. Systematic disease mechanisms underlying cancer remain elusive.
The tumor immune microenvironment is a multidimensional system of immune cells, stromal cells, and host factors. Complex and interweaving signaling pathways and networks of genes and proteins function in these various cell types[11]. In the tumor microenvironment, the presence of tertiary lymphoid structures (TLSs) is linked to good cancer prognosis[12]. TLSs comprise B cells and adjacent clusters of dendritic cells and T cells[13]. TLSs and tumor-infiltrating B cells improve ICIs responses in cancer immunotherapy[14][15][16][17]. Recent studies suggest an essential role of B cells in antitumor immunity, including the determination of protective T cell responses in cancer patients[18][19][20]. T-cell dysfunction and therapy have been established for cancer treatment[21][22][23][24][25][26][27]. However, B-cell biology and therapeutic potential have not been substantiated[28][29][30]. The emerging single-cell sequencing technique is an effective method to better understand disease mechanisms and develop novel therapeutic interventions.
Genes and proteins form complex gene regulatory networks (GRN) in living organisms[31][32]. Perturbed gene regulation is closely related to disease and its revelation is important for developing intervention strategies[33][34][35][36]. Molecular network analysis is crucial to decipher cancer mechanisms and advance precision oncology[37]. Artificial intelligence (AI) methods are needed to reveal essential GRNs and essential hub genes at multiple regulatory levels by analyzing emerging multi-modal data in patient bulk tumors and single cells for the discovery of biomarkers and therapeutic targets.
To achieve optimal treatment selection in individual patients, it is essential to integrate patient multi-omic biomarkers with clinical, pathological, demographic, and comorbid factors using electronic medical records (EMRs)[38]. Retrospective analysis of EMRs has led to the discovery of new and repositioning drugs[39][40][41].
2. Bulk Tumor and Single-Cell Multi-Omics Data Analysis
2.1. Multi-Omics Data Processing and Integration
With the rapid development of high-throughput technology, genomic, transcriptomic, proteomic, and metabolomic profiles have provided ample sources of information for researchers to understand molecular disease mechanisms. Nevertheless, data generated from various commercially available platforms and customized arrays pose tremendous challenges for processing, analysis, and integration. The Genome Analysis Toolkit (GATK) is the industry standard for processing multi-omics data in bulk tumors and single cells, including identifying single nucleotides (SNPs) and indels, somatic short variants, copy number variations (CNV), and structural variations (SV) in germline DNA and RNAseq data[42]. In addition to data generated from current sequencing technology, a huge amount of high-throughput data was generated from legacy DNA microarrays. A research group from the FDA reported that biomarkers and predictive models derived from legacy microarray data can accurately predict phenotypes in samples profiled with RNA sequencing, whereas RNA-seq-based models are less accurate in predicting microarray data[43]. This section provides a brief overview of some software packages and methods used for bulk tumor multi-omics data processing and integration.
2.1.1. Copy Number Variation
Copy number variation (CNV) is a structural variation that is either a duplication or deletion event affecting a large number of base pairs. Deletions, amplifications, gains, and losses collectively termed CNVs, are found in all humans and other mammals[44]. The number of CNVs can make up as much as 5–15% of the human genome[45]. CNVs are a significant source of genomic diversity and driver of somatic and hereditary human diseases including cancer. However, compared to single-nucleotide variations (SNVs), CNVs are still under-investigated, despite their evolutionary significance and clinical relevance. This is a consequence of the inherent challenges in identifying CNVs in diverse populations of cells at low-to-intermediate frequencies[46]. Using a recent method of a fluorescent gene functioning as a single-cell CNV reporter, CNVs are found to occur frequently and undergo selection with predictable dynamics across independently evolving replicate populations[46]. CNVs have been applied in the molecular diagnosis of many diseases and non-invasive prenatal care. Nevertheless, CNVs have not reached their full potential as emerging biomarkers. Cancer immunotherapy targets, including PD1, PDL1, CD27, and CD20 have more CNVs than SNVs in NSCLC tumors in The Cancer Genome Atlas (TCGA)[47]. Tumor mutation burdens are used in cancer management, but not CNVs. The screening, diagnosis, prognosis, and monitoring of several illnesses, including cancer and cardiovascular disease, are likely to be significantly impacted by CNVs[48].
Genomic alterations in DNA might interfere with the normal function of the genes. The genomic instability and structural dynamics of cancer cells require that CNV data be examined to discover the underlying associations between CNVs, gene/protein expression, and functional aberrations. Different platforms were used to profile genome-scale CNVs, including high-resolution SNP arrays (GeneChip Mapping 250K-Nsp array, Affymetrix), whole-genome tiling path aCGH (BCCRC whole genome tilling path array v2), and whole exome sequencing (SOLiD 5500xl)[49]. Various CNV data processing methods were developed as described below.
PennCNV-Affy[50], a Perl/C-based software tool, is the most commonly used method for CNV calling for data produced with SNP genotyping arrays. The first step is to process the raw CEL files and generate the signal intensity data. The second step is to split the signal file generated from step 1 into individual files. After the file splitting is completed, CNV calls will be generated by PennCNV. The output provides information on the CN state for each SNP probe. Normally, a CN < 2 indicates a deletion in copy number, and a CN > 2 indicates a duplication. For the SNP probes located within the same gene, the probe with the maximum intensity is used to represent the CN state for the gene.
Bioconductor packages CGHbase[51] and CGHcall[52] are often used to call the CNV in the aCGH data. The log2 normalized ratios of Cy3/Cy5 are used as inputs. In CGHcall, the number of output classes can be selected among 3 classes (loss, normal, gain), 4 classes (loss, normal, gain, amplification), or 5 classes (double deletion, loss, normal, gain, amplification).
GISTIC2.0 is a pipeline used to find genes targeted by somatic copy-number alterations (SCNAs) in human cancers[53]. GISTIC2.0 uses an iterative optimization algorithm to deconstruct each segmented copy-number profile into its most likely set of SCNAs. Compared with other methods, GISTIC2.0 is advantageous in separating arm-level and focal SCNAs explicitly by length.
CNV data generated by various platforms provide the corresponding chromosome location of each SNP. To harmonize the CNV data from various platforms, we can convert the genome assembly version from earlier versions, such as hg17, to hg38 by using the Python package CruzDB, a fast and intuitive tool for the UCSC genome browser[54]. Using the latest reference genome is an important step to ensure compatibility in the CNV data integration.
2.1.2. Categorization of Gene Regulation
Cancer is caused by dysregulated tumor suppressor genes or oncogenes. Due to genetic mutations or alterations in gene regulation, such genes are switched on or off and are expressed at abnormally high or low levels in tumor initiation and progression. It is important to define the up-regulation, normal, and down-regulation ranges by categorizing the gene expression data generated from high-throughput microarray or RNA sequencing. Housekeeping genes are generally used to categorize gene expression data.
Housekeeping genes are essential for the existence of the cell, regardless of their specific role in the tissue or organism. Housekeeping genes are expressed in all cells of an organism regardless of conditions (normal or pathophysiological), tissue type, developmental stage, cell cycle status, or external signals. Unlike in qRT-PCR, housekeeping genes are not generally used for normalization in RNA sequencing analysis. Therefore, the variation in gene expression measurements due to different sample preparation techniques is not accounted for in the RNA expression analysis. A set of stably expressed housekeeping genes in particular tissue types should be used for the corresponding research. For instance, a set of housekeeping genes were used for NSCLC[55][56][57][58][59], including ACTB, B2M, CDKN1B, ESD, FLOT2, GAPDH, GRB2, GUSB, HMBS, HPRT1, HSP90AB1, IPO8, LDHA, NONO, PGK1, POLR2A, PPIA, PPIH, PPP1CA, RHOA, RPL13A, SDCBP, TBP, TFRC, UBC, YAP1, and YWHAZ to define the threshold of gene expression level in multi-omics regulatory network studies[47][60]. Specifically, the total percentage of up-regulated and down-regulated samples was fixed for all the housekeeping genes to be 30%, and the average standard deviation of the normal range for the selected housekeeping genes was calculated. This average standard deviation was applied to all other genes in the genome to define their normal, up-regulation, or down-regulation ranges[47][60]. “Half SAM score” is recommended for differential gene expression analysis of data generated from microarrays and next-generation sequencing (NGS)[61]. DEseq2 is commonly used for fold change and differential gene expression analysis of NGS data[62].
2.1.3. Categorization of Protein Regulation
Protein expression represents how proteins are synthesized, modified, and regulated in an organism. The synthesis and regulation of proteins depend on the functional requirements in the cell. The blueprint for proteins is stored in DNA and decoded by a highly regulated transcriptional process that produces messenger RNA (mRNA). The information encoded by mRNA is subsequently translated into proteins as functional units of biological processes. Protein expression data generated from AQUA[55] and Nano-LC-MS/MS[63] are often log-transformed for differential expression analysis and Cox survival modeling.
The up-regulation, normal, and down-regulation ranges of protein expression also need to be defined, similar to gene expression. In a regulatory network analysis of NSCLC tumors[63], the categorization of protein regulation was performed by using the normal range defined with NSCLC housekeeping genes[55][56][57][58][59], including B2M, ESD, FLOT2, GAPDH, GRB2, HPRT1, HSP90AB1, LDHA, NONO, POLR2A, PPP1CA, RHOA, SDCBP, and TFRC, based on their protein expression in NSCLC tumors and non-cancerous adjacent tissues in Xu’s cohort[64]. The total percentage of up-regulated and down-regulated samples was fixed for all the housekeeping proteins, and the average standard deviation of the normal range for the selected housekeeping proteins was calculated and applied to all other proteins in the genome to define their normal, up-regulation, or down-regulation ranges[63].
2.2. Single-Cell Muti-Omics Data Processing
Each cell type has its distinct function. The single-cell analysis allows the study within a cell population to reveal how cell networks function[65][66]. Ginkgo[67] is an open-source web-based platform for single-cell CNV analysis. Single-cell transcriptomics simultaneously measures the gene expression level of individual cells in a given population[68]. Single-cell whole-genome analyses by Linear Amplification via Transposon Insertion (LIANTI) can generate sufficient DNA for next-generation sequencing[69]. In processing the single-cell gene expression data from Illumina HiSeq 2000, gene features are counted with the featureCounts method[70] based on the Gencode v19 transcriptome annotation. In processing the data from Illumina HiSeq 4000, the reads are mapped with STAR aligner[71] based on human genome reference GRCh38, and SAMtools[72] is used to sort and index the mapped reads.
The dropout phenomenon, i.e., the RNA in the cell is not detected due to limitations of current experimental protocols, is severe in single-cell transcriptomic data. As a result, a large number of genes are expressed with a value of 0 in many cells. This makes it difficult to classify single-cell gene expression as in bulk tumors, and the housekeeping gene technique described above cannot achieve usable results. Thus, single-cell gene expression data is generally classified into two categories, “not expressed” for genes with a feature count of 0, and “expressed” for genes with a future count greater than 0 in regulatory networks[73]. DEsingle[74] in Bioconductor is a common method for single-cell differential expression analysis.
3. Hub Genes in Multi-Omics and Single-Cell Networks
Some hub genes in multi-omics networks were shown to be promising cancer biomarkers and therapeutic targets[75][76]. Nevertheless, there were insufficient genome-scale investigations on multi-omics network hub genes and their biological and clinical relevance in human cancers. Graph theory centrality metrics can characterize hub genes. Common metrics include degree centrality (in-degree and out-degree centralities)[77], eigenvector centrality[78][79][80], betweenness centrality[81][82], closeness centrality[83][84][85], and VoteRank centrality[86]. Degree centrality is simply the total number of neighbors of each node. The eigenvector centrality of a node is the sum of the centrality of its neighbors. Betweenness centrality is the frequency of a node appearing on the shortest paths of all node pairs in the entire network. Closeness centrality is the average length of the shortest paths between the node and all other nodes in the network. VoteRank centrality is selected with a voting score that is calculated by the sum of all neighbors’ voting abilities. Degree centrality and eigenvector centrality are also classified as local centrality metrics because only neighbors of each node are included in the calculation. Betweenness centrality, closeness centrality, and VoteRank centrality are categorized as global centrality metrics since the connectivity of the entire graph is used in the metrics computation. These centrality metrics are correlated in many cases[85][87]. A Python package NetworkX[88][89][90][91] calculates centrality metrics.
A barrier to this systematic evaluation is the limitations of existing computational methodologies in constructing genome-scale multi-omics GRNs, as summarized above. In a recent study[89], our Prediction Logic Boolean Implication Networks (PLBINs) were used to construct 12 genome-scale GRNs of CNV, mRNA, and protein expression in NSCLC tumors. Seven centrality metrics were correlated with NSCLC tumorigenesis measured with T-statics in differential gene/protein expression between tumors vs. non-cancerous adjacent tissues (NATs), proliferation quantified with dependency scores from CRISPR-Cas9/RNAi screening of human NSCLC cell lines, and patient survival with hazard ratios from Cox modeling of The Cancer Genome Atlas (TCGA)[89]. Hub genes in multi-omics networks involving gene/protein expression were found to be associated with oncogenic, proliferative potentials and poor patient survival. Hub genes with higher co-occurrences of CNV aberrations seemed to have tumor-suppressive and anti-proliferative properties. Regulated genes in hubs were linked to proliferative potential and worse patient survival, whereas regulatory genes in hubs were linked to anti-proliferative potential and better patient survival. Established cancer immunotherapy targets PD1, PDL1, CTLA4, and CD27 were top hub genes in most constructed multi-omics GRNs[89]. These results show that multi-omics network centrality in bulk tumors can be used in the prioritization of biomarkers and therapeutic targets.
Similarly, our PLBINs[73] were applied to genome-wide transcriptomic profiles of B cells from tumors and NATs[90], T cells from peripheral blood lymphocytes (PBL)[91], and tumor-infiltrating T-cell gene expression data of NSCLC patients. In each cell sample, a gene was defined as expressed (with a feature count > 0) or not-expressed (with a feature count = 0). The details of single-cell network construction were provided in our previously published study[73].
Figure 1 shows the centrality distribution of the ICIs that were within the top 10th percentile in the constructed networks. PD1 was ranked as a top hub gene in the T-cell PBL gene co-expression network in healthy donors. CTLA4 was ranked as a top hub gene in the T-cell PBL gene co-expression network in NSCLC tumors. CD27 was ranked as a top hub gene in the T-cell PBL gene co-expression network in NSCLC patients. These results are consistent with their functional involvements in T-cell immunity. PDL1 was not ranked within the top 10th percentile of any of the examined centrality metrics in the constructed networks. None of these ICIs were ranked as top hub genes in B-cell gene co-expression networks in tumors or NATs.
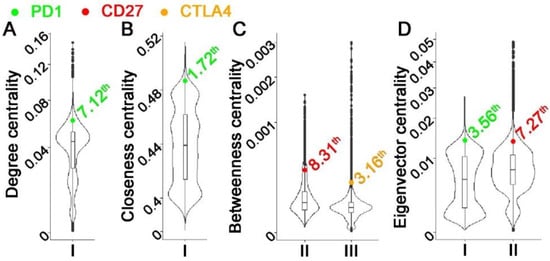
Figure 1. Distribution of centrality metrics in single-cell gene co-expression networks with CD27, CTLA4, or PD1 ranked within the top 10th percentile. Each subplot represented a centrality metric: (A). Degree centrality; (B). Closeness centrality; (C). Betweenness centrality; (D). VoteRank centrality. Each violin plot showed the distribution of the centrality metric in one specific network: I. T-cell PBL gene co-expression network in normal samples. II. T-cell PBL gene co-expression network in NSCLC patients. III. T-cell gene co-expression network in NSCLC tumors.
In a previous study, we identified a gene co-expression network missing in NSCLC tumor B cells using PLBINs[73]. Genes in this network either promote proliferation in human NSCLC epithelial cells or are indicative of NSCLC patient outcomes at both mRNA and protein expression levels in bulk tumors. These network genes were associated with drug response to 10 therapeutic regimens in 135 human NSCLC cell lines. Based on this single B-cell co-expression network, we discovered tyrosine kinase inhibitor lestaurtinib as a new drug option for treating NSCLC[73]. Here, we examined if this clinically relevant single B-cell network had higher average centrality compared with 1000 random networks with the same number of genes selected from the genome. The results showed that the previously published B-cell network had significantly higher average centrality (p < 0.05) than 1000 random networks selected from genome-scale single B-cell networks in tumors and NATs, single T-cell PBL networks in NSCLC patients and healthy donors, and T-cell network in NSCLC tumors (Figure 2). These results support the relevance of single-cell network hub genes in tumor biology.
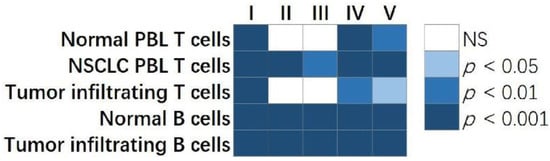
Figure 2. The comparison of centrality metrics of our published single B-cell network vs. randomly selected networks with the same number of genes. The p values showed the percentage of randomly selected genes having a higher ranked average centrality metric than the clinically relevant single B-cell network. Each column in the plot showed a centrality metric: I. Degree centrality; II. Eigenvector centrality; III. Closeness centrality; IV. Betweenness centrality; V. VoteRank centrality. Each row represented a single-cell gene co-expression network constructed in normal PBL T cells, NSCLC PBL T cells, tumor infiltrating T cells, normal B cells, and tumor infiltrating B cells, respectively. NS: not statistically significant.
This entry is adapted from the peer-reviewed paper 10.3390/cells12010101
References
- Cancer Moonshot℠. Available online: https://www.cancer.gov/research/key-initiatives/moonshot-cancer-initiative (accessed on December 4, 2022).
- Soda, M.; Choi, Y.L.; Enomoto, M.; Takada, S.; Yamashita, Y.; Ishikawa, S.; Fujiwara, S.; Watanabe, H.; Kurashina, K.; Hatanaka, H.; et al. Identification of the transforming EML4-ALK fusion gene in non-small-cell lung cancer. Nature 2007, 448, 561-566, doi:10.1038/nature05945.
- Patsoukis, N.; Wang, Q.; Strauss, L.; Boussiotis, V.A. Revisiting the PD-1 pathway. Science advances 2020, 6, doi:10.1126/sciadv.abd2712.
- Chaft, J.E.; Rimner, A.; Weder, W.; Azzoli, C.G.; Kris, M.G.; Cascone, T. Evolution of systemic therapy for stages I-III non-metastatic non-small-cell lung cancer. Nature reviews. Clinical oncology 2021, 18, 547-557, doi:10.1038/s41571-021-00501-4.
- Forde, P.M.; Chaft, J.E.; Smith, K.N.; Anagnostou, V.; Cottrell, T.R.; Hellmann, M.D.; Zahurak, M.; Yang, S.C.; Jones, D.R.; Broderick, S.; et al. Neoadjuvant PD-1 Blockade in Resectable Lung Cancer. The New England journal of medicine 2018, doi:10.1056/NEJMoa1716078.
- Hellmann, M.D.; Rizvi, N.A.; Goldman, J.W.; Gettinger, S.N.; Borghaei, H.; Brahmer, J.R.; Ready, N.E.; Gerber, D.E.; Chow, L.Q.; Juergens, R.A.; et al. Nivolumab plus ipilimumab as first-line treatment for advanced non-small-cell lung cancer (CheckMate 012): results of an open-label, phase 1, multicohort study. The Lancet. Oncology 2017, 18, 31-41, doi:10.1016/s1470-2045(16)30624-6.
- Reck, M.; Rodríguez-Abreu, D.; Robinson, A.G.; Hui, R.; Csőszi, T.; Fülöp, A.; Gottfried, M.; Peled, N.; Tafreshi, A.; Cuffe, S.; et al. Pembrolizumab versus Chemotherapy for PD-L1-Positive Non-Small-Cell Lung Cancer. The New England journal of medicine 2016, 375, 1823-1833, doi:10.1056/NEJMoa1606774.
- Reck, M.; Rodríguez-Abreu, D.; Robinson, A.G.; Hui, R.; Csőszi, T.; Fülöp, A.; Gottfried, M.; Peled, N.; Tafreshi, A.; Cuffe, S.; et al. Updated Analysis of KEYNOTE-024: Pembrolizumab Versus Platinum-Based Chemotherapy for Advanced Non-Small-Cell Lung Cancer With PD-L1 Tumor Proportion Score of 50% or Greater. Journal of clinical oncology : official journal of the American Society of Clinical Oncology 2019, 37, 537-546, doi:10.1200/jco.18.00149.
- Mok, T.S.K.; Wu, Y.L.; Kudaba, I.; Kowalski, D.M.; Cho, B.C.; Turna, H.Z.; Castro, G., Jr.; Srimuninnimit, V.; Laktionov, K.K.; Bondarenko, I.; et al. Pembrolizumab versus chemotherapy for previously untreated, PD-L1-expressing, locally advanced or metastatic non-small-cell lung cancer (KEYNOTE-042): a randomised, open-label, controlled, phase 3 trial. Lancet (London, England) 2019, 393, 1819-1830, doi:10.1016/s0140-6736(18)32409-7.
- Doroshow, D.B.; Sanmamed, M.F.; Hastings, K.; Politi, K.; Rimm, D.L.; Chen, L.; Melero, I.; Schalper, K.A.; Herbst, R.S. Immunotherapy in Non-Small Cell Lung Cancer: Facts and Hopes. Clinical cancer research : an official journal of the American Association for Cancer Research 2019, 25, 4592-4602, doi:10.1158/1078-0432.ccr-18-1538.
- Emens, L.A. Predictive Biomarkers: Progress on the Road to Personalized Cancer Immunotherapy. Journal of the National Cancer Institute 2021, doi:10.1093/jnci/djab068.
- Sautès-Fridman, C.; Petitprez, F.; Calderaro, J.; Fridman, W.H. Tertiary lymphoid structures in the era of cancer immunotherapy. Nature reviews. Cancer 2019, 19, 307-325, doi:10.1038/s41568-019-0144-6.
- Dieu-Nosjean, M.-C.; Antoine, M.; Danel, C.; Heudes, D.; Wislez, M.; Poulot, V.; Rabbe, N.; Laurans, L.; Tartour, E.; de Chaisemartin, L. Long-term survival for patients with non–small-cell lung cancer with intratumoral lymphoid structures. Journal of Clinical Oncology 2008, 26, 4410-4417.
- Xia, L.; Guo, L.; Kang, J.; Yang, Y.; Yao, Y.; Xia, W.; Sun, R.; Zhang, S.; Li, W.; Gao, Y.; et al. Predictable Roles of Peripheral IgM Memory B Cells for the Responses to Anti-PD-1 Monotherapy Against Advanced Non-Small Cell Lung Cancer. Front Immunol 2021, 12, 759217, doi:10.3389/fimmu.2021.759217.
- Cabrita, R.; Lauss, M.; Sanna, A.; Donia, M.; Skaarup Larsen, M.; Mitra, S.; Johansson, I.; Phung, B.; Harbst, K.; Vallon-Christersson, J.; et al. Tertiary lymphoid structures improve immunotherapy and survival in melanoma. Nature 2020, 577, 561-565, doi:10.1038/s41586-019-1914-8.
- Helmink, B.A.; Reddy, S.M.; Gao, J.; Zhang, S.; Basar, R.; Thakur, R.; Yizhak, K.; Sade-Feldman, M.; Blando, J.; Han, G.; et al. B cells and tertiary lymphoid structures promote immunotherapy response. Nature 2020, 577, 549-555, doi:10.1038/s41586-019-1922-8.
- Petitprez, F.; de Reyniès, A.; Keung, E.Z.; Chen, T.W.; Sun, C.M.; Calderaro, J.; Jeng, Y.M.; Hsiao, L.P.; Lacroix, L.; Bougoüin, A.; et al. B cells are associated with survival and immunotherapy response in sarcoma. Nature 2020, 577, 556-560, doi:10.1038/s41586-019-1906-8.
- Stankovic, B.; Bjørhovde, H.A.K.; Skarshaug, R.; Aamodt, H.; Frafjord, A.; Müller, E.; Hammarström, C.; Beraki, K.; Bækkevold, E.S.; Woldbæk, P.R.; et al. Immune Cell Composition in Human Non-small Cell Lung Cancer. Front Immunol 2018, 9, 3101, doi:10.3389/fimmu.2018.03101.
- Germain, C.; Gnjatic, S.; Tamzalit, F.; Knockaert, S.; Remark, R.; Goc, J.; Lepelley, A.; Becht, E.; Katsahian, S.; Bizouard, G.; et al. Presence of B cells in tertiary lymphoid structures is associated with a protective immunity in patients with lung cancer. American journal of respiratory and critical care medicine 2014, 189, 832-844, doi:10.1164/rccm.201309-1611OC.
- Germain, C.; Devi-Marulkar, P.; Knockaert, S.; Biton, J.; Kaplon, H.; Letaïef, L.; Goc, J.; Seguin-Givelet, A.; Gossot, D.; Girard, N.; et al. Tertiary Lymphoid Structure-B Cells Narrow Regulatory T Cells Impact in Lung Cancer Patients. Front Immunol 2021, 12, 626776, doi:10.3389/fimmu.2021.626776.
- Thommen, D.S.; Schumacher, T.N. T Cell Dysfunction in Cancer. Cancer cell 2018, 33, 547-562, doi:10.1016/j.ccell.2018.03.012.
- Labanieh, L.; Majzner, R.G.; Mackall, C.L. Programming CAR-T cells to kill cancer. Nature biomedical engineering 2018, 2, 377-391, doi:10.1038/s41551-018-0235-9.
- Depil, S.; Duchateau, P.; Grupp, S.A.; Mufti, G.; Poirot, L. 'Off-the-shelf' allogeneic CAR T cells: development and challenges. Nature reviews. Drug discovery 2020, 19, 185-199, doi:10.1038/s41573-019-0051-2.
- Manfredi, F.; Cianciotti, B.C.; Potenza, A.; Tassi, E.; Noviello, M.; Biondi, A.; Ciceri, F.; Bonini, C.; Ruggiero, E. TCR Redirected T Cells for Cancer Treatment: Achievements, Hurdles, and Goals. Front Immunol 2020, 11, 1689, doi:10.3389/fimmu.2020.01689.
- van der Leun, A.M.; Thommen, D.S.; Schumacher, T.N. CD8(+) T cell states in human cancer: insights from single-cell analysis. Nature reviews. Cancer 2020, 20, 218-232, doi:10.1038/s41568-019-0235-4.
- Yazdanifar, M.; Barbarito, G.; Bertaina, A.; Airoldi, I. γδ T Cells: The Ideal Tool for Cancer Immunotherapy. Cells 2020, 9, doi:10.3390/cells9051305.
- Singh, A.K.; McGuirk, J.P. CAR T cells: continuation in a revolution of immunotherapy. The Lancet. Oncology 2020, 21, e168-e178, doi:10.1016/s1470-2045(19)30823-x.
- Wang, S.S.; Liu, W.; Ly, D.; Xu, H.; Qu, L.; Zhang, L. Tumor-infiltrating B cells: their role and application in anti-tumor immunity in lung cancer. Cellular & molecular immunology 2019, 16, 6-18, doi:10.1038/s41423-018-0027-x.
- Patel, A.J.; Richter, A.; Drayson, M.T.; Middleton, G.W. The role of B lymphocytes in the immuno-biology of non-small-cell lung cancer. Cancer immunology, immunotherapy : CII 2020, 69, 325-342, doi:10.1007/s00262-019-02461-2.
- Leong, T.L.; Bryant, V.L. B cells in lung cancer-not just a bystander cell: a literature review. Translational lung cancer research 2021, 10, 2830-2841, doi:10.21037/tlcr-20-788.
- Parikshak, N.N.; Gandal, M.J.; Geschwind, D.H. Systems biology and gene networks in neurodevelopmental and neurodegenerative disorders. Nature Reviews Genetics 2015, 16, 441-458.
- Stuart, J.M.; Segal, E.; Koller, D.; Kim, S.K. A gene-coexpression network for global discovery of conserved genetic modules. Science (New York, N.Y.) 2003, 302, 249-255, doi:10.1126/science.1087447.
- Lee, T.I.; Young, R.A. Transcriptional regulation and its misregulation in disease. Cell 2013, 152, 1237-1251.
- Emmert-Streib, F.; Dehmer, M.; Haibe-Kains, B. Gene regulatory networks and their applications: understanding biological and medical problems in terms of networks. Frontiers in cell and developmental biology 2014, 2, 38.
- Singh, A.J.; Ramsey, S.A.; Filtz, T.M.; Kioussi, C. Differential gene regulatory networks in development and disease. Cellular and Molecular Life Sciences 2018, 75, 1013-1025.
- Budczies, J.; Bockmayr, M.; Denkert, C.; Klauschen, F.; Gröschel, S.; Darb-Esfahani, S.; Pfarr, N.; Leichsenring, J.; Onozato, M.L.; Lennerz, J.K.; et al. Pan-cancer analysis of copy number changes in programmed death-ligand 1 (PD-L1, CD274) - associations with gene expression, mutational load, and survival. Genes, chromosomes & cancer 2016, 55, 626-639, doi:10.1002/gcc.22365.
- Kuenzi, B.M.; Ideker, T. A census of pathway maps in cancer systems biology. Nature reviews. Cancer 2020, 20, 233-246, doi:10.1038/s41568-020-0240-7.
- Abul-Husn, N.S.; Kenny, E.E. Personalized Medicine and the Power of Electronic Health Records. Cell 2019, 177, 58-69, doi:10.1016/j.cell.2019.02.039.
- Yao, L.; Zhang, Y.; Li, Y.; Sanseau, P.; Agarwal, P. Electronic health records: Implications for drug discovery. Drug discovery today 2011, 16, 594-599, doi:10.1016/j.drudis.2011.05.009.
- Ashburn, T.T.; Thor, K.B. Drug repositioning: identifying and developing new uses for existing drugs. Nature reviews. Drug discovery 2004, 3, 673-683, doi:10.1038/nrd1468.
- Pushpakom, S.; Iorio, F.; Eyers, P.A.; Escott, K.J.; Hopper, S.; Wells, A.; Doig, A.; Guilliams, T.; Latimer, J.; McNamee, C.; et al. Drug repurposing: progress, challenges and recommendations. Nature reviews. Drug discovery 2019, 18, 41-58, doi:10.1038/nrd.2018.168.
- Van der Auwera, G.A.; O'Connor, B.D. Genomics in the Cloud: Using Docker, GATK, and WDL in Terra (1st Edition); O'Reilly Media: 2020.
- Su, Z.; Fang, H.; Hong, H.; Shi, L.; Zhang, W.; Zhang, W.; Zhang, Y.; Dong, Z.; Lancashire, L.J.; Bessarabova, M.; et al. An investigation of biomarkers derived from legacy microarray data for their utility in the RNA-seq era. Genome biology 2014, 15, 523.
- Freeman, J.L.; Perry, G.H.; Feuk, L.; Redon, R.; McCarroll, S.A.; Altshuler, D.M.; Aburatani, H.; Jones, K.W.; Tyler-Smith, C.; Hurles, M.E.; et al. Copy number variation: new insights in genome diversity. Genome Res 2006, 16, 949-961, doi:10.1101/gr.3677206.
- Redon, R.; Ishikawa, S.; Fitch, K.R.; Feuk, L.; Perry, G.H.; Andrews, T.D.; Fiegler, H.; Shapero, M.H.; Carson, A.R.; Chen, W.; et al. Global variation in copy number in the human genome. Nature 2006, 444, 444-454, doi:10.1038/nature05329.
- Lauer, S.; Gresham, D. An evolving view of copy number variants. Current genetics 2019, 65, 1287-1295, doi:10.1007/s00294-019-00980-0.
- Ye, Q.; Singh, S.; Qian, P.R.; Guo, N.L. Immune-Omics Networks of CD27, PD1, and PDL1 in Non-Small Cell Lung Cancer. Cancers 2021, 13, 4296, doi:10.3390/cancers13174296.
- Pös, O.; Radvanszky, J.; Buglyó, G.; Pös, Z.; Rusnakova, D.; Nagy, B.; Szemes, T. DNA copy number variation: Main characteristics, evolutionary significance, and pathological aspects. Biomedical journal 2021, 44, 548-559, doi:10.1016/j.bj.2021.02.003.
- de Ligt, J.; Boone, P.M.; Pfundt, R.; Vissers, L.E.; de Leeuw, N.; Shaw, C.; Brunner, H.G.; Lupski, J.R.; Veltman, J.A.; Hehir-Kwa, J.Y. Platform comparison of detecting copy number variants with microarrays and whole-exome sequencing. Genomics data 2014, 2, 144-146, doi:10.1016/j.gdata.2014.06.009.
- Wang, K.; Li, M.; Hadley, D.; Liu, R.; Glessner, J.; Grant, S.F.; Hakonarson, H.; Bucan, M. PennCNV: an integrated hidden Markov model designed for high-resolution copy number variation detection in whole-genome SNP genotyping data. Genome Res 2007, 17, 1665-1674, doi:10.1101/gr.6861907.
- Vosse S, v.d.W.M. CGHbase: CGHbase: Base functions and classes for arrayCGH data analysis, R package version 1.46.0; 2021.
- van de Wiel M, V.S. CGHcall: Calling aberrations for array CGH tumor profiles, R package version 2.48.0; 2021.
- Mermel, C.H.; Schumacher, S.E.; Hill, B.; Meyerson, M.L.; Beroukhim, R.; Getz, G. GISTIC2.0 facilitates sensitive and confident localization of the targets of focal somatic copy-number alteration in human cancers. Genome biology 2011, 12, R41, doi:10.1186/gb-2011-12-4-r41.
- Pedersen, B.S.; Yang, I.V.; De, S. CruzDB: software for annotation of genomic intervals with UCSC genome-browser database. Bioinformatics (Oxford, England) 2013, 29, 3003-3006, doi:10.1093/bioinformatics/btt534.
- Guo, N.L.; Dowlati, A.; Raese, R.A.; Dong, C.; Chen, G.; Beer, D.G.; Shaffer, J.; Singh, S.; Bokhary, U.; Liu, L.; et al. A Predictive 7-Gene Assay and Prognostic Protein Biomarkers for Non-small Cell Lung Cancer. EBioMedicine 2018, 32, 102-110, doi:10.1016/j.ebiom.2018.05.025.
- Zhan, C.; Zhang, Y.; Ma, J.; Wang, L.; Jiang, W.; Shi, Y.; Wang, Q. Identification of reference genes for qRT-PCR in human lung squamous-cell carcinoma by RNA-Seq. Acta Biochim Biophys Sin (Shanghai) 2014, 46, 330-337, doi:10.1093/abbs/gmt153.
- Walter, R.F.; Werner, R.; Vollbrecht, C.; Hager, T.; Flom, E.; Christoph, D.C.; Schmeller, J.; Schmid, K.W.; Wohlschlaeger, J.; Mairinger, F.D. ACTB, CDKN1B, GAPDH, GRB2, RHOA and SDCBP Were Identified as Reference Genes in Neuroendocrine Lung Cancer via the nCounter Technology. PLoS One 2016, 11, e0165181, doi:10.1371/journal.pone.0165181.
- Saviozzi, S.; Cordero, F.; Lo Iacono, M.; Novello, S.; Scagliotti, G.V.; Calogero, R.A. Selection of suitable reference genes for accurate normalization of gene expression profile studies in non-small cell lung cancer. BMC Cancer 2006, 6, 200, doi:10.1186/1471-2407-6-200.
- Chang, Y.C.; Ding, Y.; Dong, L.; Zhu, L.J.; Jensen, R.V.; Hsiao, L.L. Differential expression patterns of housekeeping genes increase diagnostic and prognostic value in lung cancer. PeerJ 2018, 6, e4719, doi:10.7717/peerj.4719.
- Ye, Q.; Falatovich, B.; Singh, S.; Ivanov, A.V.; Eubank, T.D.; Guo, N.L. A Multi-Omics Network of a Seven-Gene Prognostic Signature for Non-Small Cell Lung Cancer. International journal of molecular sciences 2021, 23, doi:10.3390/ijms23010219.
- Tzeng, I.S. Modified Significance Analysis of Microarrays in Heterogeneous Diseases. Journal of personalized medicine 2021, 11, doi:10.3390/jpm11020062.
- Love, M.I.; Huber, W.; Anders, S. Moderated estimation of fold change and dispersion for RNA-seq data with DESeq2. Genome biology 2014, 15, 550, doi:10.1186/s13059-014-0550-8.
- Ye, Q.; Hickey, J.; Summers, K.; Falatovich, B.; Gencheva, M.; Eubank, T.D.; Ivanov, A.V.; Guo, N.L. Multi-Omics Immune Interaction Networks in Lung Cancer Tumorigenesis, Proliferation, and Survival. International journal of molecular sciences 2022, 23, 14978.
- Xu, J.Y.; Zhang, C.; Wang, X.; Zhai, L.; Ma, Y.; Mao, Y.; Qian, K.; Sun, C.; Liu, Z.; Jiang, S.; et al. Integrative Proteomic Characterization of Human Lung Adenocarcinoma. Cell 2020, 182, 245-261.e217, doi:10.1016/j.cell.2020.05.043.
- Hodzic, E. Single-cell analysis: Advances and future perspectives. Bosn J Basic Med Sci 2016, 16, 313-314, doi:10.17305/bjbms.2016.1371.
- Saadatpour, A.; Lai, S.; Guo, G.; Yuan, G.-C. Single-Cell Analysis in Cancer Genomics. Trends in Genetics 2015, 31, 576-586, doi:https://doi.org/10.1016/j.tig.2015.07.003.
- Garvin, T.; Aboukhalil, R.; Kendall, J.; Baslan, T.; Atwal, G.S.; Hicks, J.; Wigler, M.; Schatz, M.C. Interactive analysis and assessment of single-cell copy-number variations. Nature methods 2015, 12, 1058-1060, doi:10.1038/nmeth.3578.
- Kanter, I.; Kalisky, T. Single cell transcriptomics: methods and applications. Front Oncol 2015, 5, 53, doi:10.3389/fonc.2015.00053.
- Chen, C.; Xing, D.; Tan, L.; Li, H.; Zhou, G.; Huang, L.; Xie, X.S. Single-cell whole-genome analyses by Linear Amplification via Transposon Insertion (LIANTI). Science (New York, N.Y.) 2017, 356, 189-194, doi:10.1126/science.aak9787.
- Liao, Y.; Smyth, G.K.; Shi, W. featureCounts: an efficient general purpose program for assigning sequence reads to genomic features. Bioinformatics 2014, 30, 923-930, doi:10.1093/bioinformatics/btt656.
- Dobin, A.; Davis, C.A.; Schlesinger, F.; Drenkow, J.; Zaleski, C.; Jha, S.; Batut, P.; Chaisson, M.; Gingeras, T.R. STAR: ultrafast universal RNA-seq aligner. Bioinformatics 2013, 29, 15-21, doi:10.1093/bioinformatics/bts635.
- Li, H.; Handsaker, B.; Wysoker, A.; Fennell, T.; Ruan, J.; Homer, N.; Marth, G.; Abecasis, G.; Durbin, R.; Genome Project Data Processing, S. The Sequence Alignment/Map format and SAMtools. Bioinformatics 2009, 25, 2078-2079, doi:10.1093/bioinformatics/btp352.
- Ye, Q.; Guo, N.L. Single B Cell Gene Co-Expression Networks Implicated in Prognosis, Proliferation, and Therapeutic Responses in Non-Small Cell Lung Cancer Bulk Tumors. Cancers 2022, 14, 3123.
- Miao, Z.; Deng, K.; Wang, X.; Zhang, X. DEsingle for detecting three types of differential expression in single-cell RNA-seq data. Bioinformatics 2018, 34, 3223-3224, doi:10.1093/bioinformatics/bty332.
- Wang, Z.; Wei, Y.; Zhang, R.; Su, L.; Gogarten, S.M.; Liu, G.; Brennan, P.; Field, J.K.; McKay, J.D.; Lissowska, J.; et al. Multi-Omics Analysis Reveals a HIF Network and Hub Gene EPAS1 Associated with Lung Adenocarcinoma. EBioMedicine 2018, 32, 93-101, doi:10.1016/j.ebiom.2018.05.024.
- Fan, Y.; Kao, C.; Yang, F.; Wang, F.; Yin, G.; Wang, Y.; He, Y.; Ji, J.; Liu, L. Integrated Multi-Omics Analysis Model to Identify Biomarkers Associated With Prognosis of Breast Cancer. Front Oncol 2022, 12, 899900, doi:10.3389/fonc.2022.899900.
- Krackhardt, D. Assessing the Political Landscape: Structure, Cognition, and Power in Organizations. Administrative Science Quarterly v35, p342-369.
- Bonacich, P.; Lloyd, P. Eigenvector centrality and structural zeroes and ones: When is a neighbor not a neighbor? Social Networks 2015, 43, 86-90, doi:https://doi.org/10.1016/j.socnet.2015.04.006.
- Aguirre, J.; Papo, D.; Buldú, J.M. Successful strategies for competing networks. Nature Physics 2013, 9, 230-234, doi:10.1038/nphys2556.
- Bonacich, P.; Lloyd, P. Eigenvector-Like Measures of Centrality for Asymmetric Relations. Social Networks 2001, 23, 191-201, doi:10.1016/S0378-8733(01)00038-7.
- Freeman, L.C. Centrality in social networks conceptual clarification. Social Networks 1978, 1, 215-239, doi:https://doi.org/10.1016/0378-8733(78)90021-7.
- Brandes, U. A faster algorithm for betweenness centrality. The Journal of Mathematical Sociology 2001, 25, 163-177, doi:10.1080/0022250X.2001.9990249.
- Bolland, J.M. Sorting out centrality: An analysis of the performance of four centrality models in real and simulated networks. Social Networks 1988, 10, 233-253, doi:https://doi.org/10.1016/0378-8733(88)90014-7.
- Brandes, U.; Hildenbrand, J.A.N. Smallest graphs with distinct singleton centers. Network Science 2014, 2, 416-418, doi:10.1017/nws.2014.25.
- Coscia, M. The Atlas for the Aspiring Network Scientist. . arXiv. https://doi.org/10.48550/arXiv.2101.00863 2021.
- Zhang, J.-X.; Chen, D.-B.; Dong, Q.; Zhao, Z.-D. Identifying a set of influential spreaders in complex networks. Scientific reports 2016, 6, 27823, doi:10.1038/srep27823.
- Schoch, D.; Valente, T.W.; Brandes, U. Correlations among centrality indices and a class of uniquely ranked graphs. Social Networks 2017, 50, 46-54, doi:https://doi.org/10.1016/j.socnet.2017.03.010.
- Hagberg, A.; Swart, P.; S Chult, D. Exploring network structure, dynamics, and function using NetworkX; Los Alamos National Lab.(LANL), Los Alamos, NM (United States): 2008.
- Ye, Q.; Guo, N.L. Hub Genes in Non-Small Cell Lung Cancer Regulatory Networks. Biomolecules 2022, 12, 1782.
- Lizotte, P.H.; Ivanova, E.V.; Awad, M.M.; Jones, R.E.; Keogh, L.; Liu, H.; Dries, R.; Almonte, C.; Herter-Sprie, G.S.; Santos, A.; et al. Multiparametric profiling of non-small-cell lung cancers reveals distinct immunophenotypes. JCI Insight 2016, 1, e89014, doi:10.1172/jci.insight.89014.
- Chiou, S.H.; Tseng, D.; Reuben, A.; Mallajosyula, V.; Molina, I.S.; Conley, S.; Wilhelmy, J.; McSween, A.M.; Yang, X.; Nishimiya, D.; et al. Global analysis of shared T cell specificities in human non-small cell lung cancer enables HLA inference and antigen discovery. Immunity 2021, 54, 586-602 e588, doi:10.1016/j.immuni.2021.02.014.
This entry is offline, you can click here to edit this entry!