Your browser does not fully support modern features. Please upgrade for a smoother experience.
Please note this is an old version of this entry, which may differ significantly from the current revision.
Subjects:
Oncology
Selective internal radiation therapy (SIRT) is one of the treatment options for liver tumors. Microspheres labelled with a therapeutic radionuclide (90Y or 166Ho) are injected into the liver artery feeding the tumor(s), usually achieving a high tumor absorbed dose and a high tumor control rate. This treatment adopts a theranostic approach with a mandatory simulation phase, using a surrogate to radioactive microspheres (99mTc-macroaggregated albumin, MAA) or a scout dose of 166Ho microspheres, imaged by SPECT/CT.
- SIRT
- MAA
- 166Ho
1. Introduction
Selective internal radiation therapy (SIRT) is a treatment option for liver tumors by delivering radioactive microspheres in the tumors’ feeding arteries, leading to very high absorbed doses to tumors and usually achieving a high tumor control rate [1]. Hepatic tumors are mainly vascularized by the liver artery as opposed to the healthy liver, whose blood supply is preferentially ensured by the portal vein [2]. This unique characteristic is the milestone of SIRT efficacy. By injecting radioactive microspheres in the liver artery or any of its branches, tumor(s) receive very high absorbed doses while sparing the healthy liver.
Three types of radioactive microspheres are commercially available, differing by their physical and radioactive characteristics: yttrium-90 (90Y)-resin microspheres (Sir-Spheres®, Sirtex Medical GmbH, Sydney, Australia), 90Y-glass microspheres (Therasphere®, Boston Scientific, Boston, MA, USA), and holmium-166 (166Ho)-poly-L-lactic acid (PLLA) microspheres (QuiremSpheres®, Quirem Medical B.V., Deventer, The Netherlands) [3]. Only Sir-Spheres® and Therasphere® have FDA approval for the U.S. market.
The SIRT procedure applies a theranostic approach by using similar radiopharmaceuticals agents for both therapy planning and treatment [4]. During the first step, the treatment is simulated using a surrogate: 99mTc-macroaggregated albumin (MAA) or a scout dose of the radioactive microspheres (166Ho-scout dose), enabling a selection of patients who have good tumor targeting and no absolute contraindications for treatment such as excessive lung shunt and digestive uptake. These radionuclides emit low energy gamma rays, allowing for detection by nuclear imaging systems to precisely localize the distribution in the liver or in non-targeted tissues. In particular, 3D imaging using single photon emission computed tomography combined with CT scan (SPECT/CT) allows an accurate evaluation of the MAA distribution (MAA SPECT/CT) for evaluating extra hepatic arterial shunting to limit the risks of lung and gastrointestinal complications during treatment [5,6].
2. MAA Particles as a Surrogate to Radioactive Microspheres: Physical and Technical Limitations
Prior to SIRT, a mandatory simulation phase is performed with diagnostic liver arteriography for mapping the tumor vascularization coil embolization if needed (e.g., in case of proximity to arterial digestive branches) and ends with the injection of MAA particles through the angiographic catheter, well positioned in the vascular territory of the tumor(s). This angiographic procedure is followed by planar and SPECT/CT imaging of the MAA distribution. Like 90Y or 166Ho microspheres, MAA is trapped in the arterial microvasculature of the liver and can therefore simulate the distribution of the microspheres. Nevertheless, MAA is not the perfect surrogate because of their physical characteristics, which differ from those of the therapeutic microspheres.
Compared to microspheres, MAA particles have a variable shape, a different size distribution (90% within 10 to 90 μm) with a lower mean size (15 μm versus 25–32 μm), and are injected in much smaller numbers (Table 2) [3,18,19,20]. These differences can explain some discrepancy between the MAA and the microsphere biodistribution, especially the risk of increased shunt to the lungs with MAA.
Table 2. Main physical characteristics of MAA and radioactive microspheres.
| Characteristics | 99mTc-MAA Particles | 90Y-Resin Microspheres |
90Y-Glass Microspheres |
166Ho-PLLA Microspheres |
|---|---|---|---|---|
| Diameter (mean) | 15 μm | 32 μm | 25 μm | 30 μm |
| Usual number of injected particles (in millions) | 0.3–0.7 | 50 * | 4 * | 30 * |
* For a 3 GBq activity at usual calibration time.
The smallest MAA particles can pass through the liver capillaries and be responsible for over-estimation of the lung shunt [21]. Nevertheless, an excessive MAA uptake in the lungs indicates high hepato-pulmonary shunting and hence a relative contraindication for SIRT (risks of radiation-induced pneumonitis and fibrosis) [22]. A lung shunt superior to 20% or an estimated lung absorbed dose in excess of 30 Gy are contraindications for SIRT [23]. Moreover, these physical differences can be responsible for distribution variations in the healthy and tumor(s) compartments. More precisely, the variable size of MAA particles seems to be a limiting factor in tumor absorbed dose prediction. Indeed, by simulating the treatment with a scout dose of microspheres instead of MAA particles, tumor absorbed doses were more precisely predicted [24,25].
In addition, the lack of precise replication of positioning between the liver arteriographies at the time of simulation and treatment can result in a mismatch between liver distribution of MAA and microspheres. Both procedures require the use of similar angiographic catheters and positioning as well as a well-matched orientation in the artery lumen, and end with an injection of particles at a distance from arterial bifurcations, after controlling for the absence of any vasospasm [26,27]. In addition, MAA particles must also be injected slowly (over 20 s) to better match with the treatment procedure [28].
3. Accuracy of MAA SPECT/CT for Predicting Tumor and Non-Tumoral Whole Liver Absorbed Doses
Some previous studies compared the simulated MAA tumor and non-tumoral liver absorbed doses to the real absorbed doses calculated with post-therapy 90Y imaging. The non-tumoral whole liver absorbed dose (NTWLD) refers to the whole healthy liver (targeted or not by SIRT) as defined recently by the EANM dosimetry committee [18]. In these studies, the strength of the correlation between the MAA absorbed doses and the 90Y absorbed doses was assessed and quantified using the Pearson coefficient R, ranging from 0 (no linear correlation) to 1 (perfect linear correlation) [29]. Figure 2 represents the results of previous studies where the Pearson test was used for comparing the biodistribution of MAA and the radioactive microspheres (more details in Supplementary Materials Table S1). Regarding the estimate of tumor absorbed doses, they demonstrated a variable correlation, with a Pearson coefficient ranging from 0.56 to 0.91. Nevertheless, a large majority of these studies demonstrated a moderate correlation (R < 0.7), and only two studies with a small number of patients showed a higher correlation (R close to 0.9). Another parameter was also compared, i.e., tumor to liver ratio (TNR), and will be discussed further.
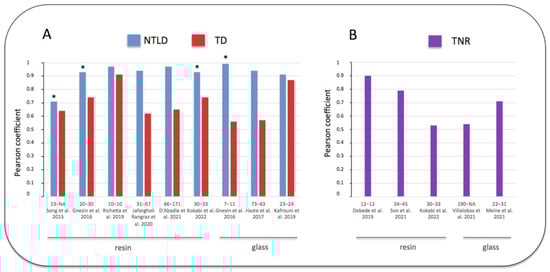
Figure 2. Pearson coefficient correlations between doses estimated by MAA SPECT/CT and post 90Y SIRT imaging [25,30,31,32,33,34,35,36,37,38,39,40]. (A) blue: non-tumoral liver absorbed dose (NTLD), referring to the non-tumoral whole liver or to the non-tumoral liver targeted by SIRT (*). (A) red: tumor absorbed dose (TD). (B) purple: tumor to normal liver ratio uptake (TNR). Abscissa legend: patients and tumor numbers of each study referenced in bracket. Tables in Supplementary Materials provide additional information. Note the better correlation obtained for the NTLD versus TD or TNR.
Some studies also measured the agreement between these absorbed doses using Bland–Altman analyses [41]. By measuring the differences between these pairs, this statistical test evaluated the risk of errors in MAA imaging for calculating the absorbed doses, after defining the limits of agreement (95% confidence interval). Table 3 summarizes studies performing Bland–Altman analyses and where the relative confidence intervals were available or estimated from absolute values. All these studies demonstrated a similar risk of under- and over-estimation of the tumor absorbed dose (similar plotting over and under the reference X axis). Moreover, the limits of agreement were large in a majority of these studies, with a maximum error over 100% of the tumor absorbed dose estimation in 3 studies.
Table 3. Predictive value of pre-therapy MAA imaging for estimating TD and NTWLD (using Bland–Altman analyses for measuring the extremes).
| Studies | Type of Microspheres | Post Therapy Imaging | Type of Tumors | Nb of Patients | Nb of Tumors | TD Estimation (Relative 95% CI) + |
NTWLD Estimation (Relative 95% CI) + |
|---|---|---|---|---|---|---|---|
| Kafrouni et al. 2019 [36] | glass | 90Y PET/CT | HCC | 23 | 24 | −29%; +29% | −34%; +34% |
| Richetta et al. 2019 [32] | resin | 90Y PET/CT | HCC | 10 | 10 | −39%; +33% | −24%; +31% |
| Jafargholi Rangraz et al. 2020 [33] | resin | 90Y PET/CT | HCC and mets | 31 | 67 | −169%; +146% | −30%, +23% |
| Jadoul et al. 2020 [42] |
resin and glass | 90Y PET/CT | HCC and mets | 57 | 137 | −100%; +100% | −36%, +36% |
| d’Abadie et al. 2021 [34] | resin | 90Y PET/CT | HCC and mets | 66 | 171 | −76%; +320% | −19%, +24% |
HCC: hepatocellular carcinoma; mets: metastases; TD: Tumor absorbed dose; Nb: number; NTWLD: non-tumoral whole liver absorbed dose; + In some studies, absolute 95% CI were converted in relative 95% CI (comparison to the mean).
Regarding the prediction of the normal liver absorbed dose, all studies were congruent and demonstrated the accuracy of MAA SPECT/CT. The NTWLD calculated with pre-therapy MAA SPECT/CT was strongly correlated with the NTWLD calculated with post-therapy 90Y PET/CT, with a Pearson coefficient over 0.9 in all studies (Figure 2, Supplementary Materials: Table S1). Moreover, Bland–Altman analyses confirmed this good agreement with a maximal deviation ranging from −36% to +36% (Table 3).
Using alternative methods of comparison in 16 patients, Thomas et al. showed similar results, demonstrating a lack of prediction of the tumor absorbed dose but a highly reliable prediction of the normal liver absorbed dose with MAA imaging [43].
4. Value of MAA SPECT/CT to Predict the Tumor to Normal Liver Uptake Ratio
Some recent studies compared pre-therapy MAA imaging to post-therapy 90Y imaging using the tumor to normal liver uptake ratio (TNR). As previously mentioned, tumors are preferentially vascularized by the liver artery while the healthy liver is vascularized by the portal vein; therefore, TNR is usually greater than 1 [44]. This ratio is also directly correlated to the tumor absorbed dose [45]. The results of these studies are summarized in Figure 2B and detailed in Supplementary Materials (Table S2). They demonstrated results similar to the prediction of tumor absorbed doses. Indeed, TNR was moderately predicted, with a Pearson coefficient ranging from 0.53 to 0.9.
Other studies were performed using an alternative Spearman’s rank test, also demonstrating a moderate correlation in a study analyzing colorectal metastases (ρ = 0.51) and in a study pooling a mix of tumors (ρ = 0.65) [45,46].
Nevertheless, a high TNR uptake seems very well predicted by MAA imaging. In a study evaluating 171 tumors, MAA SPECT/CT predicted a high TNR ratio (≥1.5) with an accuracy of 85% [34]. Moreover, in liver metastases from colorectal cancer (CRC), a TNR ratio superior to 1.7 was a predictor of SIRT efficacy [45]. Therefore, the TNR ratio estimated from MAA imaging can generally select patients suitable for SIRT, avoiding ineffective procedures for patients with TNR ratios close to 1 [13,17].
5. MAA Tumor Absorbed Doses Correlate with Clinical Outcome after SIRT
Despite the low accuracy of MAA SPECT/CT for predicting tumor absorbed doses, numerous data are available for demonstrating a strong relationship between the MAA tumor absorbed dose and SIRT efficacy. In particular, when a certain MAA tumor absorbed dose threshold was achieved, the radiological response and the patient outcome were significantly improved. Table 4 summarizes studies showing this correlation between MAA tumor absorbed doses and the clinical outcome, demonstrating the high significance of this pre-therapy dosimetry. Nevertheless, a distinction must be made between determining an exact tumor absorbed dose and predicting a high level of tumor absorbed dose. Based on previous data, an exact tumor absorbed dose cannot be predicted from MAA imaging, but its level (low versus high) can be determined with high accuracy. When a high tumor absorbed dose is simulated with MAA SPECT/CT, the tumor will receive a high tumor absorbed dose in a large majority of the cases, achieving a threshold of high tumor absorbed dose. In a series of patients treated for HCC by resin microspheres, a threshold dose of 100 Gy simulated with MAA imaging was achieved in 90% of them on 90Y post-therapy imaging [34].
Table 4. MAA tumor absorbed doses thresholds correlated to SIRT efficacy.
| Studies + | Microspheres | Tumors | Number of Patients | Tumor Absorbed Dose Threshold | Predictor of Tumor Response | Predictor of Better Survival (Median) |
|---|---|---|---|---|---|---|
| Chiesa et al. 2011 [47] | glass | HCC | 46 | ≥257 Gy | 85% | NA |
| Garin et al. 2012 [48] | glass | HCC | 36 | ≥205 Gy | 100% | 18 mo ° |
| (vs. 9 mo) | ||||||
| Mazzaferro et al. 2013 [49] | glass | HCC | 52 | ≥500 Gy | 80% | NA |
| Chiesa et al. 2015 [50] | glass | HCC | 52 | ≥217 Gy | 100% | NA |
| Garin et al. 2017 [51] | glass | HCC | 85 | ≥205 Gy | 98% | 21 mo ° |
| (vs. 6.5 mo) | ||||||
| Bourien et al. 2019 [52] | glass | CGC | 64 | ≥260 Gy | 88% * | 28.2 mo ° |
| (vs. 11.4 mo) | ||||||
| Lam et al. 2013 [53] | resin | CRC | 25 | ≥55 Gy | NA | 32.8 mo ° |
| (vs. 7.2 mo) | ||||||
| Chansanti et al. 2017 [54] | resin | NET | 15 | ≥191 Gy | 83% | NA |
| Piasecki et al. 2018 [45] | resin | CRC | 21 | ≥70 Gy | 99% | NA |
| Hermann et al. 2020 [55] | resin | HCC | 121 | ≥100 Gy | 72% | 14.1 mo ° |
| (vs. 6.8 mo) | ||||||
| Son et al. 2021 [38] | resin | HCC | 34 | ≥125 Gy | 86% | NA |
HCC: hepatocellular carcinoma; CGC: cholangiocarcinoma; NET: neuroendocrine tumors; CRC: colorectal cancer; NA: not available; * subgroup of 29 patients; + Studies with mixed tumor types and without distinction of types of treatment (resin or glass) were excluded. ° differences statistically significant (p < 0.05).
This entry is adapted from the peer-reviewed paper 10.3390/jcm11237245
This entry is offline, you can click here to edit this entry!