Your browser does not fully support modern features. Please upgrade for a smoother experience.
Please note this is an old version of this entry, which may differ significantly from the current revision.
The main cause of death worldwide is cardiovascular disease (CVD), which claims more than 17 million lives each year. CVD disease creates other pathological issues with the heart, heart valves, or blood vessels.
- cardiovascular disease
- heart valve disorders
- continuous wavelets transform
- Deep learning
1. Introduction
In this study, the authors describe a cost-effective and non-invasive technique for capturing heart signals through phonocardiography (PCG) [3,4]. It aids in enhancing the diagnosis of cardiac disorders and in creating new perceptions regarding the connection between the signal and the mechanical function of the heart. PCG signals can be used to diagnose a variety of CVD signals, including mitral stenosis (MS), mitral regurgitation (MR), aortic stenosis (AS), and mitral valve prolapse (MVP). A visual example of these PCG signals, categorized into five classes, is shown in Figure 1.
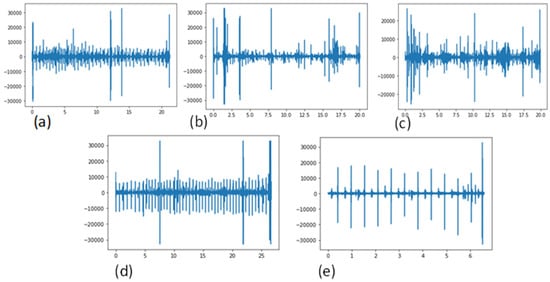
Figure 1. Signals of the existing CVD classes, using a phonogram, (a) Aortic stenosis (AS), (b) Mitral regurgitation (MR), (c) Mitral stenosis (MS), (d) Mitral valve prolapse (MVP) and (e) Normal.
In practice, the visual screening of the PCG signal takes time [5] and is prone to error. Still, the arbitrary PCG signal inspection and analysis required by doctors requires substantial training and expertise. This encouraged the creation of a computer-aided diagnostic (CAD) method for the recognition of PCG signal-based cardiac screening and abnormality detection. CVD classification is currently a promising topic of research, based on biomedical signal processing and artificial intelligence (AI) [6]. Techniques utilizing AI can be utilized to get around these restrictions. Machine learning (ML) is a branch of AI that entails feature selection, statistical analysis, salient feature extraction (SFA), and classification. ML techniques are extensively used in combination with PCG signals to detect heart sounds [7]. Recently published papers for the diagnosis of cardiac illnesses used a variety of suggested research and methodologies [8,9,10]. Unfortunately, accuracy was not adequate, so the focus of attention shifted to developing a very accurate ML or DL for the diagnosing of cardiac problems. In the past, authors used a variety of feature extraction techniques and classifiers. However, these feature selection and classification techniques were hand-crafted, and frequently relied on iterative trial and error. To resolve this issue, deep learning (DL) techniques were developed.
Currently, DL algorithms are still used as the primary approach in detecting heart sounds, because smart detection PCG technology has not yet been widely adopted in actual clinical diagnosis. Therefore, advancements in the field of CVD diagnosis are facilitated by the study of, and deployment of, computer-aided (CAD) heartbeat detection techniques. In the past, cardiovascular disease was mostly detected using the following four steps: (1) preprocessing of the HS signals, (2) feature extraction, (3) feature selection, and (4) identification of normal and abnormal HS recordings.
It is difficult to categorize PCGs into five stages [11,12,13,14,15,16]. It is important to note that during the feature extraction step, several characteristics of one-dimensional signals are shared by various cardiovascular illnesses. The outcome of multi-classification may be impacted by these related properties. Therefore, it is crucial to emphasize the diversity of the various characteristics of heart disorders. There have been numerous manual feature extractions. Most of these hand-crafted features, such as amplitude, time interval, kurtosis, energy ratio, MFCC, entropy, etc., have physiological causes. Previous research often used these parameters to undertake binary categorization (normal PCG vs. abnormal PCG). This feature of manual computation is small and straightforward, but it might not be good enough for multi-classification and new databases.
As a result, there is a need to extract deep features for multi-class recognition. It is difficult to categorize five stages of CVD by using one-dimensional PCG signals. As a result, we employed a technique based on continuous wavelet transform-based spectrogram (CWTS) strategy to transfer energy from the PCG signal into 2D spectrogram images. Moreover, deep features were utilized in this paper to develop a classifier. To automatically extract more detailed information, several researchers have employed deep-learning models like CNN or other ANN models. In this study, we created a CNN model that is trained on discriminant representations of non-segmental PCG frames to offer a useful method for automatic detection.
2. Existing Work for Cardiac Disease Classification
Heart sound segmentation (HSS), feature extraction (FE), and classification are the three phases that traditionally go into heart sound classification. The initial stage aims to locate the location of the basic heart sounds (HS). Each PCG recording is divided into several HD segments. The systolic and diastolic areas of the heart sounds are revealed by the precise localization of the HS. Segmentation is not required because the goal of abnormal HS detection is primarily to identify an abnormality in the heart sound, rather than to detect its presence. Therefore, a variety of strategies for classifying heart sounds without any segmentation have been suggested in the literature. When the segmentation information from the various strategies is used, they can attain equivalent results. A comparative performance of existing work for cardiac disease classification (CDC) is described in Table 1.
Table 1. A Comparative performance of existing work for cardiac disease classification (CDC).
| Cited Reference | * Dataset | Feature Extraction | Classification | Results | Limitations |
|---|---|---|---|---|---|
| Z.H. Wang et al. [17] | PRV | CWT + Spectrogram | LSTM-RNN | ACC: 93% | Five Classes |
| A.M. Alqudah [18] | PhysioNet and GitHub dataset | Instantaneous frequency-based features | RF and KNN | ACC: 95% | Five Classes |
| X. Cheng et al. [19] | Open Heart sound dataset | Heart sound segmentation features | Fisher ratio (FR). Finally, the Euclidean distance (ED) and the close principle | ACC: 96% | Two Classes |
| A. Rath et al. [20] | Pascal CHSE dataset | DWT and MFCC features | RF-MFO-XGB ensemble | ACC: 89% | Three Classes |
| J. Li et al. [21] | PRV | Multidimensional Scattering transform | PCA and Twin SVM | ACC: 98% | Two Classes |
| F. Khan et al. [22] | PhysioNet | Mel Frequency Cepstral Coefficients (MFCC) | ANN + LSTM | AUC: 91% | Two Classes |
| A.T. Saputra et al. [24] | - | PCA data correlation | NN and PSO | AUC: 98% | Two Classes |
| O. Arslan [25] | PRV | PWPT + EMD features | RF | ACC: 99% | Two Classes |
| J.S. Khan [26] | PhyioNet | Power Spectrum discriminating features | CNN | ACC: 98.89% | Two Classes |
| A. Yadav [29] | NIH | Spectral Statistical Features | SVM, k-NN, random forest, Naïve Byes | ACC: 97% | Two Classes |
| P. Dhar [34] | PhyioNet | Cross-wavelet transform (XWT) | Cross-wavelet transform (XWT) assisted Convolution neural network (CNN) utilizing the AlexNet model | ACC: 98% | Two classes |
* PRV: Private dataset, DWT: Discrete wavelet transform, RF: Random Forest, CNN: Convolutional neural network, NN: neural network, PSO: Particle swarm optimization, SVM: Support vector machine, AUC: area under the curve, LSTM-RNN: long-term short-term memory recurrent neural network, CWT: continuous wavelets transform, PCA: principal component analysis.
Regarding the second stage, numerous feature extraction algorithms have been proposed in the literature, falling into the following three primary categories: time domain [17], frequency domain [18], and time-frequency complexity domain [19]. Due to the physiological properties of the PCG signals, the time or frequency domain features are straightforward, simple to grasp, and easy to calculate. However, it can be challenging to quantify certain critical PCG signal information independently in the time or frequency domain. As a result, time–frequency (TF) domain feature extraction is growing in popularity. The TF-based features can offer more thorough information about the PCG signal and better feature extraction performance results, even though they require greater computing complexity than features based just on time or frequency [20]. Wavelet transformation, discrete and packet wavelet transform (DPWT), Hilbert transform (HT), empirical wavelet transform (EWT), variational mode decomposition (VMD), and adjustable Q-wavelet transform are some of the popular TF feature extraction techniques for PCG signals (TQWT). When the PCG signal’s TF matrix is generated using spine CT, it can more accurately capture pathological changes and offer superior resolution in the TF domain. However, due to the nonstationary and varied properties of PCG signals, such manually created features have their constraints, and feature extraction is still a difficult operation.
The final stage involves training a classifier on the retrieved characteristics to produce predictions for each PCG signal [21,22,23,24,25,26]. To categorize the HS based on extracted features, several machine learning-based classifiers have been proposed, such as the support vector machine (SVM), decision tree (DT), K-nearest neighbor (KNN), artificial neural network (ANN), multi=layer extreme learning machine (ML-ELM), hidden Markov model (HMM), etc. An ensemble of various classifiers was also used to further enhance classification performance. In [27], the authors suggested a tent-pooling decomposition and a graph-based feature generator to extract features. Five classes of PCG signals were classified using DT, linear discriminant, bagged tree, and SVM classifiers after iterative neighborhood component analysis (NCA) was used to determine the features. In [28], the authors chose the most discriminative features for NCA using a one-dimensional (1D) binary pattern with three kernels. For the classification of PCG signals, KNN and SVM were used. In [29], the authors took six audio variables from audio samples of PCG signals, including spectral centroid, zero crossing rate, energy entropy, spectral roll-off, volume, and spectral flux, and submitted them to four conventional machine learning-based classifiers for classification. Although PCG categorization has greatly improved thanks to machine learning-based techniques, these methods are still subjective and time-consuming [30]. Convolutional neural networks (CNNs) and long short-term memory (LSTM) are two deep learning models that have recently been used for the classification of heart sounds [30,31,32,33,34]. They have drawn more attention because of their automatic analysis and extraction of high-level representations from heart sounds. Additionally, it is becoming popular to identify PCG signals directly from entire audio recordings without first segmenting them.
Time, frequency, time–frequency (TF) features, energy features, and entropy features were all merged into feature vectors by the authors. For PCG classification, they were combined with the deep learning features that CNN had previously collected from pictures with Mel frequency cepstral coefficients (MFCCs). According to the authors, handcrafted characteristics could only reflect the differences in PCG signals brought on by HVDs from specific angles in practical applications. More thorough disease-related data could be gathered when deep learning characteristics, having good representation capabilities, were combined. In [35], the authors developed a new 2D CNN architecture for HS classification that could extract more discriminative features while using fewer parameters. This architecture included spatial and channel-wise attention methods. In addition, more recent studies have been reported to use PCG signals, spectrogram and deep learning techniques [36,37,38,39,40,41].
This entry is adapted from the peer-reviewed paper 10.3390/diagnostics12123109
This entry is offline, you can click here to edit this entry!