A description of standard NMR experiments along with some examples.
- NMR
- Nuclear Magnetic Resonance
- pulse sequences
- 1D NMR
- 2D NMR
- relaxation
- T1
- T2
- drugs
- drug design
- drug discovery
1. Introduction
NMR is a versatile tool for studying biomolecules of all kinds and is a unique regarding the biophysical analysis of drugs[1][2][3][4]. The basic feature of NMR lies in the fact that it inductively detects the Larmor precession of individual nuclei (i.e. spins) which vary because of different atomic, electronic, and chemical environments (i.e. structural atomic relationships). Initially, the sample is placed in a strong, static, and homogeneous magnetic field. Because spins contain angular momentum, they exhibit Larmor precessions around this static magnetic field. A net magnetization builds up over time as the spin population (represented by different energy levels) is minutely differential in the presence of the magnetic field. These levels are dictated by the spin quantum number and can be roughly thought of as different orientations with respect to the static field. Subsequently, induced electromagnetic fields at radiofrequencies (called RF pulses) are applied transverse to the plane of the static magnetic field, and the net or bulk magnetization undergoes an effective rotation. The bulk coherence moves into the transverse plane and the subsequent coherently precessing magnetization vectors induce a detectable alternating voltage in the NMR receiver coil. This tiny alternating voltage is amplified and converted from an analog time domain signal to a frequency reading via Fourier transformation. These signals are recorded in response to the induced radio-wave pulses (Figure 1) and are representative of the Larmor frequencies that are converted into normalized values termed chemical shifts in order to be field independent.
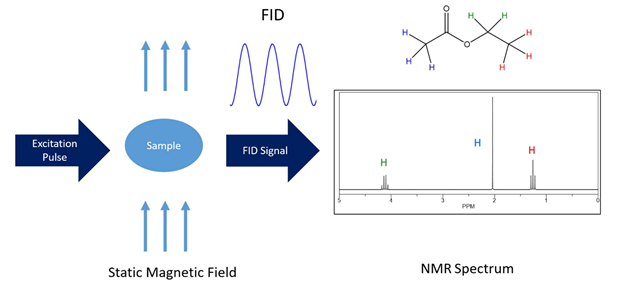
Figure 1. The most simplified layout of an NMR experiment. The NMR spectrum of ethyl acetate Table 1. H chemical shift assignments is shown as an example. The chemical structure and simulated 1H-NMR spectrum were created using ChemDraw 18.1.
As NMR is non-destructive in nature, the same sample can be analyzed repeatedly. NMR can be performed first and then submitted to mass spectrometry (MS); however, the addition of common deuterated NMR solvents (such as D2O) can perturb MS results and should be avoided (e.g. tube-in-tube or by using non-deuterated solvent and running the NMR unlocked). In fact, high-performance liquid chromatography (HPLC), ion-trap MS and NMR have been combined to detect the effects of drugs demonstration in urine and blood serum samples[5][6][7]. Corcoran and Spraul[8] emphasize that liquid chromatography (LC), MS, and NMR utilized in parallel give comprehensive structural data on molecules of novel drugs in development.
2. One Dimensional NMR Spectroscopy
The one-dimensional (1D) experiment is by far the most common NMR experiment used for drug studies. The 1D acquisition takes the least amount of time, has one of the simplest hardware requirements, and therefore, in most cases, 1D-NMR is more attractive for high throughput studies. One dimensional NMR spectroscopy normally incorporates a preparation period, some form of induced excitation to form coherence, and lastly, a signal “read” detection period. The preparation period can be modified according to the needs of the experiment or the specifics of the sample. Simple 1D NMR is capable of rapidly producing high-quality spectra of drugs and their targets while revealing how the drugs and targets may interact at the atomic level. 1D 1H-NMR is extremely effective in drug design studies because it has a (relatively) high sensitivity, it is non-destructive, and because hydrogen atoms are extremely abundant in most molecules of interest. Therefore the resulting spectra usually contains a large amount of relevant information and this wealth of data can be acquired in a relatively short period of time. The basic 1D 1H-NMR, along with 1D 13C-NMR, 1D 15N-NMR, and 1D 31P-NMR, and their respective uses in drug design/discovery are briefly discussed below.
2.1. 1D 1H-NMR
The 1H hydrogen isotope is NMR visible, has the highest gyromagnetic ratio (apart from tritium) of all of NMR active nuclei, and is combined with a vast natural abundance in organic chemical compounds. This makes the 1D-1H-NMR experiment the most commonly applied NMR approach. Moreover, many software databases[9][10][11][12] are well established for 1H-NMR spectra therefore assisting with processing, analyzing, and identifying the detected molecules automatically. Since almost all drug discovery and drug development studies are performed on samples dissolved in water, many different solvent suppression methods have been applied. The most common is presaturation[13][14]. The key point of this method is to use a low power induced field at the specific frequency of water. This effectively averages out any coherence of the water resonance. The experiment is simple for common hardware to perform and easy to set up; however, presaturation has a substantial disadvantage in that signals resonating close to the solvent signal will show decreased intensity[13][14] or may be lost entirely. This is due to the fact the even selective pulses or very low power pulses also excite some area around the water signal. Also suppressed hydrogen from H2O in solution can exchange with atoms of interest in the molecule and effectively bleed the suppressive spin state to any neighboring atoms. The water signal itself is usually broad, so a wider area of suppression is not necessarily undesirable but affects more of the molecule(s) of interest. More recent water suppression techniques have been developed such as those based on a scheme known as excitation sculpting[15][16]. The basic pulse sequence consists of a double pulsed field gradient echo (DPFGE) in each of which a selective component pulse is flanked by two pulsed field gradients[17]. The particular elements differ for different applications. In the case of water suppression known as WATER suppression by GrAdient Tailored Excitation (WATERGATE), this involves an initial encoding gradient along with the middle element; a combination of two selective 90° rotations on the water along with a central non-selective 180° excitation of all resonances[18]. This is predicated in that water experiences a 360° rotation (effectively nothing) while all other spins experience 180° rotation. The application of the second refocusing gradient does not rephase the water and therefore removes the signal. The reader is referred to the detailed literature[3][4][19] for further information. In principle, a water suppression element (or many elements combined) can be incorporated in any existing pulse sequence to enhance the performance, and it has been implemented in various 1D, 2D, and triple resonance 3D/4D experiments. Although 1H is the most sensitive nucleus for NMR yielding strong, sharp signals within a few minutes[20], chemical shift dispersion of 1H is quite narrow (only around 10 ppm). This has prompted the consideration of other nuclei such as 13C, 15N, or 31P for resolution improvements.
2.2. 1D 13C-NMR
Compared with 1H, 13C has a much higher chemical shift dispersion (~200 ppm), however the natural abundance of 13C is low (1.1%). Additionally, the gyromagnetic ratio is ~4 times weaker than 1H and therefore 13C spectra are far more difficult to obtain especially for less concentrated samples. There are some polarization transfer techniques such as Distortionless Enhancement by Polarization Transfer (DEPT) or Insensitive Nuclei Enhanced by Polarization Transfer (INEPT), which can enhance signal intensity by starting the magnetization on a higher sensitivity and abundance proton and then transferring magnetization to the less sensitive carbon nuclei for subsequent direct detection[21], but this requires additional hardware and acquisition times. The use of 1D 13C in drug design studies was illustrated by Tsujimoto et al. [22]. The goal of the study was to examine if a metabolomics approach based on 1H and 13C offers significant improvements when comparing potential drugs. The authors prepared a total of 40 samples with five different citrus-type crude drugs (kijitsu, tohi, chimpi, kippi and seihi) and measured 1D 1H and 1D 13C for each sample. While 1H-NMR spectra allowed the identification of three compounds (naringin, sucrose, and β-glucose), using 13C-NMR allowed unambiguous identification of eight additional compounds (naringin, neohesperidin, a- and β-glucose, sucrose, limonene, narirutin, and synephrine). The added signal resolution from 13C-NMR spectra allowed researchers to obtain better structural information about the compounds than from 1H-NMR spectra alone.
2.3. 1D 15N-NMR
In comparison to the previous example, 15N has a lower shift dispersion (~100ppm) than 13C, but higher than that of 1H. Here, the situation is unfortunately severely limited due to an even lower natural abundance (0.37%) and a gyromagnetic ratio ~10 times smaller than 1H. This means that 15N’s combined sensitivity is around 260,000 times lower than 1H. As a result, isotopic enrichment of 15N combined with 1H-mediated enhancement via indirect detection is often needed in order to obtain a satisfactory 1D 15N spectra. Similar to 13C, a few methods are available to overcome such low sensitivity. One of them focuses on tagging molecules with carboxyl groups using 15N-ethanolamine and later detecting the signal using a 2D heteronuclear correlation NMR experiment[23]. Currently, novel approaches such as “smart isotope labeling” have been developed[24]. Also, the SOFAST (Band-Selective Optimized Flip Angle Short Transient) technique can help but results in substantial hardware considerations/drawbacks and often increased concentrations, and/or dramatically longer experiments are still required[25][26][27].
2.4. 1D 31P-NMR
With a natural abundance of 100% and a gyromagnetic ratio of about 2.5 times smaller than 1H, one may think that phosphorus could be broadly used for NMR experiments regarding the drug discovery and development. However, the application of 31P is limited due to the fact that most of the molecules of interest simply do not contain a phosphorus atom. Therefore 31P-NMR is usually applicable for studies related to energy, phospholipid metabolism (ATP, NADP), and/or characterization of changes in DNA[28][29][30]. For example, Overall et al. conducted an experiment in which they showed that 31P solid-state NMR can be used for quantitative analysis of DNA dynamics within live bacteria[28]. For that, the researchers first prepared untreated cultures of E. coli, and measured them using a Hartmann-Hahn 1H to 31P cross-polarization (31P CP) experiment. Afterwards, they measured E. coli treated with ampicillin and maculatin 1.1 (Mac1.1) in a similar manner. Spectra obtained from treated bacteria compared to those obtained from untreated bacteria showed alterations in the lineshape, reduced signal intensity at the spectrum’s edges, and a shift in spectral density towards 0 ppm which indicated the increased dynamics of the phosphorus from nucleic acids[28].
Over time, several innovations have been applied to expand the usage of 31P. Like in 13C and 15N labeling of specific biological compounds, incorporation of 31P can also be used. In order to achieve that, 2-chloro-4,4,5,5-tetramethyldioxaphospholane (CTMDP) can be used for tagging lipids containing hydroxyl, aldehyde, and carboxyl groups that can later be detected with better resolution[31]. Another fairly recent method enables toxicological screening of 31P in living cells for several hours without affecting cell viability[32]. This specific method can be used to observe the changes in energy metabolism in real-time while enabling the evaluation of the effects of administered drugs.
3. Multi-dimensional NMR Spectroscopy
NMR experiments are not limited to one-dimensional direct acquisition; they can be extended to multidimensional methods including 2D, 3D, 4D, and even higher dimensionality.
3.1. 2D 1H,1H-COSY
COSY is one of the simplest and most frequently used 2D NMR experiment[33]. It shows the homonuclear coupling of nuclei (i.e. 1H-1H) separated by up to several covalent bonds. The pulse sequence consists of a 90° excitation pulse followed by a specific evolution time (t1), a second pulse, and finally a measurement period (t2, not to be confused with relaxation rates or times). The second pulse can be 90° or 45° or 135°, depending upon the specific requirements, and respectively yield COSY[34], COSY-45 or COSY-135 functionality (see[35][36][37]). A two-dimensional Fourier Transform (FT) yields the final spectra and shows the frequencies for proton (1H) or carbon (in the case of carbon detection) along both axes. There are two types of peaks; (I) Diagonal peaks, which represent the peaks of the conventional 1D spectra, and (II) cross-peaks, which have different values in the two frequency axes and are therefore off the diagonal. These off diagonal cross-peaks are the most important pieces of information as they mark correlations between pairs of nuclei due to through bond magnetization transfer. This helps in identifying which atoms are connected[38], critical for structural elucidation of both known molecules and unknown molecules in solution[39]. By implementing phase-cycling[40][41], it is also possible to distinguish different types of coupling and yields further helpful information about the chemical structure of a molecule[42]. As an example, the use of the COSY experiment was presented in the work of Zheng et al.[43]. The main goal of their work was to investigate potential biological differences and compare the pharmacological effects between Danggui (an herbal drug used in traditional Chinese medicine) and European Danggui. For that, Zheng et al. treated blood deficiency rats with Danggui and European Danggui and collected samples of their serum and urine. The samples were later measured using 1H-CPMG-NMR, 1H-NOESYPRESAT-1D, 1H,1H-COSY, and 1H,13C-HSQC, and then compared to equivalent spectra from untreated rats. The results showed that exposure to Danggui and European Danggui altered the levels of 18 different metabolites, such as lactate, nicotinamide, glycerol and formate, which were involved in a total of seven different metabolism pathways. Additionally, it was proven that Danggui and European Danggui have different chemical compositions, with Danggui having better blood-enriching effects than European Danggui.
3.2. 2D 1H,1H-TOCSY
Total Correlation Spectroscopy (TOCSY) also originally known as the Homonuclear Hartmann Hahn (HOHAHA) experiment can be considered an extension of the 2D 1H,1H-COSY experiment. The difference between the two experiments is that a TOCSY experiment will show multiple cross-peaks including indirectly coupled nuclei (i.e. longer range via scalar coupling) throughout the J-coupled spin system of a chemical compound. The basic pulse sequence of the TOCSY consists of excitation by a 90° pulse, followed by a free variable evolution period which encodes the indirect dimension. This is normally followed by an isotropic mixing sequence to transfer magnetization between spins via the strong scalar coupling. The mixing generates in-phase magnetization throughout a spin coupled network of the associated nuclei during the mixing time. Lastly, a direct detection is performed. A major advantage of the TOCSY experiment is that it detects in-phase magnetization (i.e. pure absorptive line-shape) which is far easier to analyze compared to the anti-phase information in the phase sensitivity COSY-type experiment. The isotropic mixing is usually performed using a composite pulse scheme such as WALTZ, MLEV or DIPSI[44][45] pulse train, and can be sandwiched between two z-filters[46] where isotropic mixing is performed on the longitudinal magnetization. The most obvious advantage of TOCSY is that all cross-peaks of the same spin system can be observed for whole spin system at once. This is useful for identifying the complete network of spins and reducing the ambiguity of any spectral overlap. The TOCSY experiment can be produced as 1D with a relatively shorter time and easier analysis compared to 2D but lacks the benefit of multi-dimensional resolution. The 2D TOCSY is usually done to resolve spectra overlap [50] when first identifying molecules[47][48][49]. For example, Jiang et al. used this to predict the response to gemcitabine-carboplatin (GC) chemotherapy in patients with metastatic breast cancer who were previously exposed to treatment with both anthracyclines and taxanes[48]. For that, researchers collected serum samples from 29 patients prior to treatment and measured them using 1D 1H-NMR. Additionally, they conducted 2D NMR experiments such as the 1H,1H-COSY, 1,1H-TOCSY, 1H,13C-HSQC, and 1H,13C-HMBC to help assign serum metabolites. After receiving the treatment with gemcitabine-carboplatin, patients were divided into four groups based on the results from the computed tomography: complete response (CR), partial response (PR), stable disease (SD), or progressive disease (PD). After comparing NMR results prior to the treatment with the outcome of chemotherapy, the researchers observed lower baseline levels of serum format and acetate in breast cancer patients who progressed with the disease than in those who achieved a clinical benefit from therapy, indicating that those two biomarkers could be used to distinguish between patients who will benefit from GC treatment from those who do not[48].
3.3. 2D 1H,13C-HSQC
2D- Heteronuclear Single Quantum Coherence (HSQC) experiments are commonly used to help resolve spectral overlap[50] while providing 13C information without the inherent sensitivity losses involved in 13C direct detection (see below). HSQC shows the correlations between directly coupled nuclei[51], e.g. 1H-13C or 1H-15N[51]. As such, an HSQC spectrum will show clean peaks for each unique proton directly connected to the heteronuclear nuclear atom of interest[51][52]. In 1H,13C/15N HSQC experiments, the magnetization is transferred from the more sensitive nucleus (I:1H) to the less sensitive nucleus (S:13C/15N)[53][54][55] (Figure 2). This is especially useful when applying NMR spectroscopy to drug design, as most drugs are organic (i.e., contain carbon atoms), and the relative abundance of 13C (1.1%) is quite low[54]. By transferring sensitivity from 1H to 13C, one can circumvent the long experimental time required for 1D 13C experiments[54].
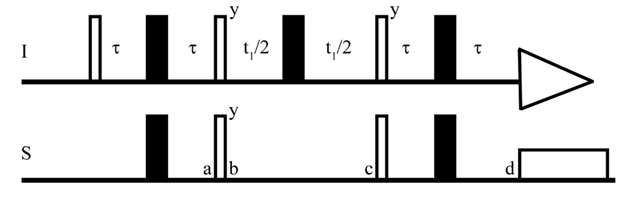
Figure 2. The pulse sequence of HSQC. I and S represent two heteronuclear spins. The τ is (1/4J) where J is the coupling constant. The thick and thin bars represent the 180° and 90° pulse respectively[53].
3.4. 2D 1H, 13C-HMBC
Heteronuclear 2D experiments are useful for transferring magnetization from sensitive nuclei (i.e. 1H) to less sensitive nuclei (i.e. 13C)[56] thereby reducing the time needed for the acquisition of spectra[57]. Heteronuclear Single Quantum Coherence (HSQC) will only show one cross peak for each coupled pair[38][58] of nuclei. This makes HSQCs useful for assigning the backbone of proteins[59] and in metabolites of complex biofluids[60] [149], whose 1D 1H-NMR spectra can suffer from severe spectral overlap.
3.5. Relaxation-Edited NMR Spectroscopy
Relaxation in NMR is a phenomenon describing the time dependence involved in signal intensity after an induced RF (radiofrequency) pulse is applied[61]. After application of a 90° RF pulse, the bulk magnetization will move to the transverse (xy) plane and will gradually return to its original equilibrium position along the longitudinal (z) axis[62]. This process is described in Figure 3, and is termed T1 relaxation. The details are beyond the scope of the manuscript and interested readers are directed to[63] and references therein. Relaxation times for NMR are even more complicated and exist in two categories: T1 and T2. T1 refers to the rate of longitudinal (or spin-lattice) Z-axis relaxation as the system returns to equilibrium. A second component also contributes, i.e. T2 relaxation and refers to the rate of transverse (or spin-spin) relaxation[62], which occurs in the XY plane. T2 is independent of the longitudinal relaxation (T1) and represents the loss of coherence in the precessing spins. Therefore NMR relaxation spectroscopy can be based on T1 and/or T2[64], and is collectively referred to as “relaxation edited NMR”[65].
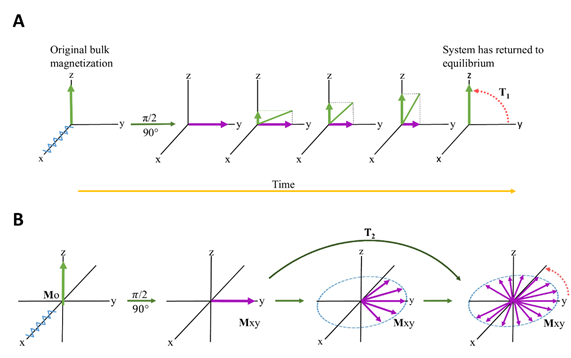
Figure 3. RF (radiofrequency) pulse causes the bulk magnetization to move to the transverse plane. Over time (ms to seconds, and in extreme cases, minutes[63]), the bulk magnetization will decrease in the transverse plane, and increase in the longitudinal axis, returning to its original, equilibrium value. (A) represents T1 relaxation and (B) represents T2 relaxation.
T1-based methods typically measure and compare the T1 times of the free and bound ligands. A common way to measure the T1 value of a small molecule is the inversion recovery experiment[66][67], although other experiments are also available such as ultrafast NMR T1[68]and saturation inversion recovery[69]. In general, the shorter T1 the relaxation time the less intense the peak signal will be and the broader the signal linewidth[70]. The T1 values of free and bound ligand will differ depending on how strongly the ligand binds because molecular interactions with the target will influence the ligand’s molecular motion, and hence, its longitudinal relaxation[64]. Bound ligands will have smaller T1 values than in their free form because, overall, they will experience slower molecular motion upon interacting with a target [71] therefore behaving like a much larger molecule. They can (depending on molecule size) also display a negative NOE difference spectrum (transferred NOE)[72], whereas non-binding ligands normally show small-positive NOEs[64]. For binding ligands to display negative NOEs, their T1 values must be comparatively longer than the 1/koff value of the target[64].
T1 relaxation times can be easily used to screen small molecules as ligands for DNA[73] and serve as a basis for HTS experiments[74]. An experiment related to drug design that utilized 1D and 2D relaxation edited NMR was done by Hajduk et al.[75] in which he and others used 1D and 2D relaxation edited NMR techniques to detect ligands that bind to FK506 binding protein and stromelysin. One year earlier, Liu et al.[65] [157] used relaxation edited one-and two-dimensional 1H-NMR spectroscopy to characterize biological fluids. Tang et al.[76] extended this by applying relaxation edited NMR Spectroscopy to improve the detection of metabolites in blood plasma. More recently, Jaremko et al. commented on available models used to interpret 15N protein relaxation data[77], and even used deficient 15N relaxation data to rapidly calculate the dynamics of proteins[78].
The T2 relaxation experiment relies on so-called Carr–Purcell–Meiboom–Gill (CPMG) building blocks (Figure 4).
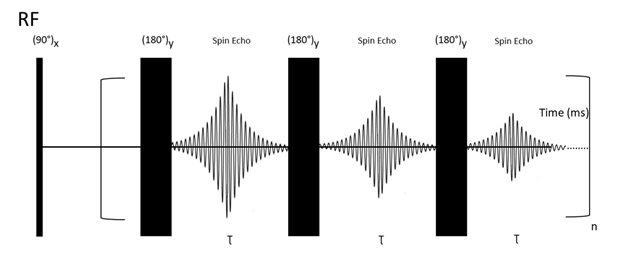
Figure 4. CPMG pulse sequence. First, a 90° RF pulse is applied and results in transverse magnetization in the xy plane. Then a 180°y pulse is applied to re-phase the magnetization vectors. After 180°y, the vectors who were faster during the dephasing are overtaken by the slower vectors, which results in re-phasing and generation of a spin-echo signal. This process is repeated several times.
This pulse sequence is explained with the following steps: First, application of a 90° RF pulse creates a transverse (xy plane) magnetization. Second, a spin-echo period (delay-180°-delay block) is responsible for Mx/y magnetization decay. This period is repeated “n’’ times (CPMG building blocks). It is essential to point out that every NMR experiment involving a large number of pulses (e. g. due to the repeating building blocks) is likely to be sensitive to hardware restrictions and small miscalibrations of the duration of the applied pulses. To attenuate the unwanted effects of miscalibrations, Meiboom and Gill modified the previously used Carr–Purcell sequence[79] by changing the phase of the applied 180° pulses from x to y[80]. This procedure can be used to measure T2 relaxation times of any type of nuclei. For instance, in the case of 13C, all pulses and acquisitions are applied on 13C channel, while broadband proton decoupling is applied during all pulse sequences. It works analogically for different NMR-active nuclei[81].
In a typical CPMG experiment, the effective transverse relaxation rate, R2,eff, is typically measured by fitting the signal decay as a function of a variable number of CPMG blocks[82]. The experimental half-height linewidth (d) of a given resonance signal is directly related to T2* (also called as ‘effective’ or “observed’’) by the following equation:
T2 represents the transverse relaxation times, and additional broadening comes from the magnetic field inhomogeneities (T2inh), which must be taken into account.
T2 measurements of ligands are also useful for determining the binding nature of a small molecule. The T2 values of small molecules are quite large compared to those of bigger molecules (i.e. proteins) mostly because macromolecules have more spin-spin diffusion[83]. Bound ligands will, therefore, display shorter T2 values than non-binding ligands because they interact with the target (i.e. protein), adopting similar vibrational and rotational energies to the target[84]. This interaction is represented by the resonance line broadening in the binding ligand’s spectrum when a receptor is introduced into the sample[64]. Given the sizable difference of T2 values of binding and non-binding ligands, one can utilize 1D relaxation-edited experiments to distinguish the binding ligands from the non-binding ligands efficiently and effectively based on the differences in the T2 values[75]. These and other related relaxation edited experiments prove useful in drug design.
This entry is adapted from the peer-reviewed paper 10.3390/molecules25204597
References
- Ziarek, J.J.; Peterson, F.C.; Lytle, B.L.; Volkman, B.F. Chapter ten—Binding Site Identification and Structure Determination of Protein–Ligand Complexes by NMR: A Semiautomated Approach. In Methods in Enzymology; Fragment-Based Drug Design; Kuo, L.C., Ed.; Academic Press: San Diego, CA, USA, 2011; Volume 493, pp. 241–275. ISBN 978-0-12-381274-2.
- Keiffer, S.; Carneiro, M.G.; Hollander, J.; Kobayashi, M.; Pogoryelev, D.; AB, E.; Theisgen, S.; Müller, G.; Siegal, G. NMR in target driven drug discovery: Why not? J. Biomol. NMR 2020.
- Marshall, C.B.; KleinJan, F.; Gebregiworgis, T.; Lee, K.-Y.; Fang, Z.; Eves, B.J.; Liu, N.F.; Gasmi-Seabrook, G.M.C.; Enomoto, M.; Ikura, M. NMR in integrated biophysical drug discovery for RAS: Past, present, and future. J. Biomol. NMR 2020.
- Norton, R.S.; Jahnke, W. NMR in pharmaceutical discovery and development. J. Biomol. NMR 2020.
- Zeyad Al-Talla; Sabah H. Akrawi; Abdul-Hamid M. Emwas; Solid state NMR and bioequivalence comparison of the pharmacokinetic parameters of two formulations of clindamycin. Int. Journal of Clinical Pharmacology and Therapeutics 2011, 49, 469-476, 10.5414/cp201478.
- Shockcor, J.P.; Unger, S.E.; Wilson, I.D.; Foxall, P.J.D.; Nicholson, J.K.; Lindon, J.C. Combined HPLC, NMR Spectroscopy, and Ion-Trap Mass Spectrometry with Application to the Detection and Characterization of Xenobiotic and Endogenous Metabolites in Human Urine. Anal. Chem. 1996, 68, 4431–4435.
- Al-Talla, Z.A.; Akrawi, S.H.; Tolley, L.T.; Sioud, S.H.; Zaater, M.F.; Emwas, A.-H.M. Bioequivalence assessment of two formulations of ibuprofen. Drug Des. Devel. Ther. 2011, 5, 427–433.
- Olivia Corcoran; Manfred Spraul; LC–NMR–MS in drug discovery. Drug Discovery Today 2003, 8, 624-631, 10.1016/s1359-6446(03)02749-1.
- Tardivel, P.J.C.; Canlet, C.; Lefort, G.; Tremblay-Franco, M.; Debrauwer, L.; Concordet, D.; Servien, R. ASICS: An automatic method for identification and quantification of metabolites in complex 1D 1H-NMR spectra. Metabolomics 2017, 13, 109.
- Cui, Q.; Lewis, I.A.; Hegeman, A.D.; Anderson, M.E.; Li, J.; Schulte, C.F.; Westler, W.M.; Eghbalnia, H.R.; Sussman, M.R.; Markley, J.L. Metabolite identification via the Madison Metabolomics Consortium Database. Nat. Biotechnol. 2008, 26, 162–164.
- Cañueto, D.; Gómez, J.; Salek, R.M.; Correig, X.; Cañellas, N. rDolphin: A GUI R package for proficient automatic profiling of 1D 1H-NMR spectra of study datasets. Metabolomics 2018, 14, 24.
- Lewis, I.A.; Schommer, S.C.; Markley, J.L. rNMR: Open source software for identifying and quantifying metabolites in NMR spectra. Magn. Reson. Chem. 2009, 47, S123–S126.
- Cavanagh, J.; Fairbrother, W.J.; Palmer, A.G.; Rance, M.; Skelton, N.J. Chapter 3—experimental aspects of NMR spectroscopy. In Protein NMR Spectroscopy. Principles and Practice, 2nd ed.; Cavanagh, J., Fairbrother, W.J., Palmer, A.G., Rance, M., Skelton, N.J., Eds.; Academic Press: Burlington, MA, USA, 2007; pp. 114–270. ISBN 978-0-12-164491-8.
- Rule, G.S.; Hitchens, T.K. (Eds.) Practical Aspects of N-Dimensional Data Acquisition and Processing. In Fundamentals of Protein NMR Spectroscopy; Focus on Structural Biology; Springer: Dordrecht, The Netherlands, 2006; pp. 313–351. ISBN 978-1-4020-3500-5.
- Tsang-Lin, H.; Shaka, A.J. Water suppression that works. Excitation sculpting using arbitrary waveforms and pulsed field gradients. Water Suppr. Works Excit. Sculpt. Using Arbitr. Waveforms Pulsed Field Gradients 1995, 112, 275–279.
- Callihan, D.; West, J.; Kumar, S.; Schweitzer, B.I.; Logan, T.M. Simple, Distortion-Free Homonuclear Spectra of Peptides and Nucleic Acids in Water Using Excitation Sculpting. J. Magn. Reson. B 1996, 1, 82–85.
- T.L. Hwang; A.J. Shaka; Water Suppression That Works. Excitation Sculpting Using Arbitrary Wave-Forms and Pulsed-Field Gradients. Journal of Magnetic Resonance, Series A 1995, 112, 275-279, 10.1006/jmra.1995.1047.
- Martial Piotto; Vladimir Saudek; Vladimir Sklenář; Gradient-tailored excitation for single-quantum NMR spectroscopy of aqueous solutions. Journal of Biomolecular NMR 1992, 2, 661-665, 10.1007/bf02192855.
- Gang Zheng; William S. Price; Solvent signal suppression in NMR. Progress in Nuclear Magnetic Resonance Spectroscopy 2010, 56, 267-288, 10.1016/j.pnmrs.2010.01.001.
- Levitt, M.H. Experiments on AX systems. In Spin Dynamics: Basics of Nuclear Magnetic Resonance; John Wiley & Son: Hoboken, NJ, USA, 2008; pp. 409–452. ISBN 978-0-470-51117-6.
- D.M Doddrell; D.T Pegg; M.R Bendall; Distortionless enhancement of NMR signals by polarization transfer. Journal of Magnetic Resonance (1969) 1982, 48, 323-327, 10.1016/0022-2364(82)90286-4.
- Takashi Tsujimoto; Taichi Yoshitomi; Takuro Maruyama; Yutaka Yamamoto; Takashi Hakamatsuka; Nahoko Uchiyama; 13C-NMR-based metabolic fingerprinting of Citrus-type crude drugs. Journal of Pharmaceutical and Biomedical Analysis 2018, 161, 305-312, 10.1016/j.jpba.2018.08.044.
- Tao Ye; Huaping Mo; Narasimhamurthy Shanaiah; G. A. Nagana Gowda; Shucha Zhang; Daniel Raftery; Chemoselective15N Tag for Sensitive and High-Resolution Nuclear Magnetic Resonance Profiling of the Carboxyl-Containing Metabolome. Analytical Chemistry 2009, 81, 4882-4888, 10.1021/ac900539y.
- Fariba Tayyari; G. A. Nagana Gowda; Haiwei Gu; Daniel Raftery; 15N-Cholamine—A Smart Isotope Tag for Combining NMR- and MS-Based Metabolite Profiling. Analytical Chemistry 2013, 85, 8715-8721, 10.1021/ac401712a.
- Luo, J.; Zeng, Q.; Wu, K.; Lin, Y. Fast reconstruction of non-uniform sampling multidimensional NMR spectroscopy via a deep neural network. J. Magn. Reson. 2020, 317, 106772.
- Rossi, P.; Xia, Y.; Khanra, N.; Veglia, G.; Kalodimos, C.G. 15N and 13C-SOFAST-HMQC editing enhances 3D-NOESY sensitivity in highly deuterated, selectively [1H,13C]-labeled proteins. J. Biomol. NMR 2016, 66, 259–271.
- Emwas, A.-H.; Alghrably, M.; Al-Harthi, S.; Poulson, B.; Szczepski, K.; Chandra, K.; Jaremko, M. Chapter 5—New Advances in Fast Methods of 2D NMR Experiments. In Nuclear Magnetic Resonance; Khaneja, N., Ed.; IntechOpen: London, UK, 2019; pp. 83–106. ISBN 978-1-83880-420-6.
- Sarah A. Overall; Shiying Zhu; Eric Hanssen; Frances Separovic; Marc-Antoine Sani; In Situ Monitoring of Bacteria under Antimicrobial Stress Using 31P Solid-State NMR. International Journal of Molecular Sciences 2019, 20, 181, 10.3390/ijms20010181.
- Kaplan, O.; van Zijl, P.C.M.; Cohen, J.S. Information from combined 1H and 31P NMR studies of cell extracts: Differences in metabolism between drug-sensitive and drug-resistant MCF-7 human breast cancer cells. Biochem. Biophys. Res. Commun. 1990, 169, 383–390.
- Nunnally, R.L.; Bottomley, P.A. Assessment of pharmacological treatment of myocardial infarction by phosphorus-31 NMR with surface coils. Science 1981, 211, 177–180.
- M. Aruni DeSilva; Narasimhamurthy Shanaiah; G. A. Nagana Gowda; Kellymar Rosa-Pérez; Bryan A. Hanson; Daniel Raftery; Application of 31 P NMR spectroscopy and chemical derivatization for metabolite profiling of lipophilic compounds in human serum. Magnetic Resonance in Chemistry 2009, 47, S74-S80, 10.1002/mrc.2480.
- Josué Carvalho; Sara Alves; M. Margarida C.A. Castro; Carlos F.G.C. Geraldes; João A. Queiroz; Carla P. Fonseca; Carla Cruz; Development of a bioreactor system for cytotoxic evaluation of pharmacological compounds in living cells using NMR spectroscopy. Journal of Pharmacological and Toxicological Methods 2019, 95, 70-78, 10.1016/j.vascn.2018.11.004.
- Findeisen, M.; Berger, S. The organic set of NMR spectra. In 50 and More Essential NMR Experiments: A Detailed Guide; Wiley-VCH: Weinheim, Germany, 2013; pp. 11–16. ISBN 978-3-527-33694-4.
- Jean Jeener; Gerrit G. Alewaeters; “Pulse pair technique in high resolution NMR” a reprint of the historical 1971 lecture notes on two-dimensional spectroscopy. Progress in Nuclear Magnetic Resonance Spectroscopy 2016, 94–95, 75-80, 10.1016/j.pnmrs.2016.03.002.
- Reynolds, W.F.; Enríquez, R.G. Choosing the Best Pulse Sequences, Acquisition Parameters, Postacquisition Processing Strategies, and Probes for Natural Product Structure Elucidation by NMR Spectroscopy. J. Nat. Prod. 2002, 65, 221–244.
- Lewis, P.; Kaltia, S.; Wähälä, K. The phase transfer catalysed synthesis of isoflavone-O-glucosides. J. Chem. Soc. Perkin 1 1998, 2481–2484.
- Fontaine, X.L.R.; Kennedy, J.D.; Shaw, B.L.; Vila, J.M. Determination of the relative signs of 2J(31P–31P) in complexes of tungsten(0) and molybdenum(0) using two-dimensional [31P–31P]-COSY-45 nuclear magnetic resonance chemical shift correlation. J. Chem. Soc. Dalton Trans. 1987, 2401–2405.
- Keeler, J. Two dimentional NMR. In Understanding NMR Spectroscopy; John Wiley & Sons: Hoboken, NJ, USA, 2011; pp. 139–162. ISBN 978-1-119-96493-3.
- Kerem Bingol; Rafael Brüschweiler; Knowns and unknowns in metabolomics identified by multidimensional NMR and hybrid MS/NMR methods. Current Opinion in Biotechnology 2017, 43, 17-24, 10.1016/j.copbio.2016.07.006.
- Kingsley, P.B. Product operators, coherence pathways, and phase cycling. Part III: Phase cycling. Concepts Magn. Reson. 1995, 7, 167–192.
- Bain, A.D.; Burton, I.W.; Reynolds, W.F. Artifacts in two-dimensional NMR. Prog. Nucl. Magn. Reson. Spectrosc. 1994, 26, 59–89.
- Claridge, T.D.W. Chapter 6-Correlations through the Chemical Bond I: Homonuclear Shift Correlation. In High-Resolution NMR Techniques in Organic Chemistry, 3rd ed.; Claridge, T.D.W., Ed.; Elsevier: Amsterdam, The Netherlands, 2016; pp. 203–241. ISBN 978-0-08-099986-9.
- Zheng-Zheng Zhang; Ma-Li Fan; Xia Hao; Xue-Mei Qin; Zhen-Yu Li; Integrative drug efficacy assessment of Danggui and European Danggui using NMR-based metabolomics. Journal of Pharmaceutical and Biomedical Analysis 2016, 120, 1-9, 10.1016/j.jpba.2015.12.001.
- Coote, P.; Bermel, W.; Wagner, G.; Arthanari, H. Analytical optimization of active bandwidth and quality factor for TOCSY experiments in NMR spectroscopy. J. Biomol. NMR 2016, 66, 9–20.
- MacKinnon, N.; While, P.T.; Korvink, J.G. Novel selective TOCSY method enables NMR spectral elucidation of metabolomic mixtures. J. Magn. Reson. 2016, 272, 147–157.
- Michael J. Thrippleton; James Keeler; Elimination of Zero-Quantum Interference in Two-Dimensional NMR Spectra. Angewandte Chemie International Edition 2003, 42, 3938-3941, 10.1002/anie.200351947.
- Li, Z.-Y.; Ding, L.-L.; Li, J.-M.; Xu, B.-L.; Yang, L.; Bi, K.-S.; Wang, Z.-T. 1H-NMR and MS Based Metabolomics Study of the Intervention Effect of Curcumin on Hyperlipidemia Mice Induced by High-Fat Diet. PLoS ONE 2015, 10.
- Jiang, L.; Lee, S.C.; Ng, T.C. Pharmacometabonomics Analysis Reveals Serum Formate and Acetate Potentially Associated with Varying Response to Gemcitabine-Carboplatin Chemotherapy in Metastatic Breast Cancer Patients. J. Proteome Res. 2018, 17, 1248–1257.
- Vermathen, M.; Paul, L.E.H.; Diserens, G.; Vermathen, P.; Furrer, J. 1H HR-MAS NMR Based Metabolic Profiling of Cells in Response to Treatment with a Hexacationic Ruthenium Metallaprism as Potential Anticancer Drug. PLoS ONE 2015, 10.
- Yomica Powder-George; Julia Frank; Russel S. Ramsewak; Willam F. Reynolds; The Use of Coupled HSQC Spectra to Aid in Stereochemical Assignments of Molecules with Severe Proton Spectral Overlap. Phytochemical Analysis 2011, 23, 274-277, 10.1002/pca.1354.
- Parkinson, J.A. Chapter 2—NMR Spectroscopy Methods in Metabolic Phenotyping. In The Handbook of Metabolic Phenotyping; Lindon, J.C., Nicholson, J.K., Holmes, E., Eds.; Elsevier: Amsterdam, The Netherlands, 2019; pp. 53–96. ISBN 978-0-12-812293-8.
- Claridge, T.D.W. High-Resolution NMR Techniques in Organic Chemistry; Elsevier: Cambridge, MA, USA, 2016; ISBN 978-0-08-099993-7.
- Hu, H.; Krishnamurthy, K. Doubly compensated multiplicity-edited HSQC experiments utilizing broadband inversion pulses. Magn. Reson. Chem. 2008, 46, 683–689.
- Szakács, Z.; Sánta, Z. Chapter 7-NMR Methodological Overview. In Anthropic Awareness; Szántay, C., Ed.; Elsevier: Amsterdam, The Netherlands, 2015; pp. 257–289. ISBN 978-0-12-419963-7.
- Norwood, T.J. Product Operator Formalism in NMR. In Encyclopedia of Spectroscopy and Spectrometry; Lindon, J.C., Ed.; Academic Press: Oxford, UK, 1999; pp. 1875–1884. ISBN 978-0-12-226680-5.
- Pravat K. Mandal; Ananya Majumdar; A comprehensive discussion of HSQC and HMQC pulse sequences. Concepts in Magnetic Resonance 2004, 20A, 1-23, 10.1002/cmr.a.10095.
- Elsa Caytan; Romain Ligny; Jean-François Carpentier; Sophie M. Guillaume; Evaluation of Band-Selective HSQC and HMBC: Methodological Validation on the Cyclosporin Cyclic Peptide and Application for Poly(3-hydroxyalkanoate)s Stereoregularity Determination.. Polymers 2018, 10, 533, 10.3390/polym10050533.
- Emwas, A.-H.M. The Strengths and Weaknesses of NMR Spectroscopy and Mass Spectrometry with Particular Focus on Metabolomics Research. In Metabonomics: Methods and Protocols; Methods in Molecular Biology; Bjerrum, J.T., Ed.; Humana Press: New York, NY, USA, 2015; Volume 1277, pp. 161–193. ISBN 978-1-4939-2377-9.
- Airoldi, C.; Merlo, S.; Sironi, E. Chapter 4—NMR Molecular Recognition Studies for the Elucidation of Protein and Nucleic Acid Structure and Function. In Applications of NMR Spectroscopy; ur-Rahman, A., Choudhary, M.I., Eds.; Elsevier: Amsterdam, The Netherlands, 2015; pp. 147–219. ISBN 978-1-60805-999-7.
- Jianguo Xia; Trent C Bjorndahl; Peter Tang; David S. Wishart; MetaboMiner – semi-automated identification of metabolites from 2D NMR spectra of complex biofluids. BMC Bioinformatics 2008, 9, 1-16, 10.1186/1471-2105-9-507.
- Cavanagh, J.; Fairbrother, W.J.; Palmer, A.G.; Rance, M.; Skelton, N.J. Chapter 5—relaxation and dynamic processes. In Protein NMR Spectroscopy. Principles and Practice, 2nd ed.; Cavanagh, J., Fairbrother, W.J., Palmer, A.G., Rance, M., Skelton, N.J., Eds.; Academic Press: Burlington, MA, USA, 2007; pp. 333–404. ISBN 978-0-12-164491-8.
- Teng, Q. Basic Principles of NMR. In Structural Biology: Practical NMR Applications; Springer: New York, NY, USA, 2013; pp. 1–65. ISBN 978-1-4614-3963-9.
- Macomber, R.S. A Complete Introduction to Modern Nmr Spectroscopy; John Wiley & Sons: New York, NY, USA, 1998; ISBN 0-471-15736-8.
- Maurizio Pellecchia; Daniel S. Sem; Kurt Wüthrich; Nmr in drug discovery. Nature Reviews Drug Discovery 2002, 1, 211-219, 10.1038/nrd748.
- Maili Liu; Jeremy K. Nicholson; John C. Lindon; High-Resolution Diffusion and Relaxation Edited One- and Two-Dimensional1H NMR Spectroscopy of Biological Fluids. Analytical Chemistry 1996, 68, 3370-3376, 10.1021/ac960426p.
- Vold, R.L.; Waugh, J.S.; Klein, M.P.; Phelps, D.E. Measurement of Spin Relaxation in Complex Systems. J. Chem. Phys. 1968, 48, 3831–3832.
- Balci, M. 15—Multiple-Pulse NMR Experiments. In Basic 1H- and 13C-NMR Spectroscopy; Balci, M., Ed.; Elsevier Science: Amsterdam, The Netherlands, 2005; pp. 339–375. ISBN 978-0-444-51811-8.
- Pieter E. S. Smith; Kevin J. Donovan; Or Szekely; Maria Baias; Lucio Frydman; Ultrafast NMR T1 relaxation measurements: probing molecular properties in real time.. ChemPhysChem 2013, 14, 3138-3145, 10.1002/cphc.201300436.
- Hongzhi Wang; Ming Zhao; Jerome L. Ackerman; Yiqiao Song; Saturation-inversion-recovery: A method for T1 measurement. Journal of Magnetic Resonance 2017, 274, 137-143, 10.1016/j.jmr.2016.11.015.
- Günther, H. Chapter 8—The Physical Basis of the Nuclear Magnetic Resonance Experiment. Part II: Pulse and Fourier-Transform NMR. In NMR Spectroscopy: Basic Principles, Concepts and Applications in Chemistry; Wiley-VCH: Weinheim, Germany, 2013; pp. 233–280. ISBN 978-3-527-67477-0.
- José Daniel Figueroa-Villar; Jose Daniel Figueroa-Villar And Luzineide Wanderley Tinoco; Spin-Lattice Relaxation Time in Drug Discovery and Design. Current Topics in Medicinal Chemistry 2009, 9, 811-823, 10.2174/156802609789207082.
- Sanhita Maity; Ravi Kumar Gundampati; Thallapuranam Krishnaswamy Suresh Kumar; NMR Methods to Characterize Protein-Ligand Interactions. Natural Product Communications 2019, 14, null, 10.1177/1934578x19849296.
- Mariano Casu; Sonia Puligheddu; Giuseppe Saba; Flaminia Cesare Marincola; Guillermo Orellana; Adolfo Lai; The Interaction of DNA with Intercalating Agents Probed by Sodium-23 NMR Relaxation Rates. Journal of Biomolecular Structure and Dynamics 1997, 15, 37-43, 10.1080/07391102.1997.10508943.
- Brian J Stockman; Claudio Dalvit; NMR screening techniques in drug discovery and drug design. Progress in Nuclear Magnetic Resonance Spectroscopy 2002, 41, 187-231, 10.1016/s0079-6565(02)00049-3.
- Philip J. Hajduk; Edward T. Olejniczak; Stephen W. Fesik; One-Dimensional Relaxation- and Diffusion-Edited NMR Methods for Screening Compounds That Bind to Macromolecules. Journal of the American Chemical Society 1997, 119, 12257-12261, 10.1021/ja9715962.
- Huiru Tang; Yulan Wang; Jeremy K. Nicholson; John C. Lindon; Use of relaxation-edited one-dimensional and two dimensional nuclear magnetic resonance spectroscopy to improve detection of small metabolites in blood plasma. Analytical Biochemistry 2004, 325, 260-272, 10.1016/j.ab.2003.10.033.
- Łukasz Jaremko; Mariusz Jaremko; Michał Nowakowski; Andrzej Ejchart; The Quest for Simplicity: Remarks on the Free-Approach Models. The Journal of Physical Chemistry B 2015, 119, 11978-11987, 10.1021/acs.jpcb.5b07181.
- Łukasz Jaremko; Mariusz Jaremko; Andrzej Ejchart; Michał Nowakowski; Fast evaluation of protein dynamics from deficient 15N relaxation data. Journal of Biomolecular NMR 2018, 70, 219-228, 10.1007/s10858-018-0176-3.
- H. Y. Carr; E. M. Purcell; Effects of Diffusion on Free Precession in Nuclear Magnetic Resonance Experiments. Physical Review 1954, 94, 630-638, 10.1103/physrev.94.630.
- S. Meiboom; D R Gill; Modified Spin‐Echo Method for Measuring Nuclear Relaxation Times. Review of Scientific Instruments 1958, 29, 688-691, 10.1063/1.1716296.
- Kowalewski, J.; Maler, L. Measuring T1 and T2 Relaxation Rates. In Nuclear Spin Relaxation in Liquids: Theory, Experiments, and Applications, 2nd ed.; CRC Press: Boca Raton, FL, USA, 2017; pp. 139–152. ISBN 978-1-351-26459-4.
- Andrew J. Baldwin; An exact solution for R2,eff in CPMG experiments in the case of two site chemical exchange. Journal of Magnetic Resonance 2014, 244, 114-124, 10.1016/j.jmr.2014.02.023.
- Philip J. Hajduk; Robert P. Meadows; Stephen W. Fesik; NMR-based screening in drug discovery.. Quarterly Reviews of Biophysics 1999, 32, 211-240, 10.1017/s0033583500003528.
- G. Mladenov; V. S. Dimitrov; Extraction ofT2 from NMR linewidths in simple spin systems by use of reference deconvolution. Magnetic Resonance in Chemistry 2001, 39, 672-680, 10.1002/mrc.908.