Your browser does not fully support modern features. Please upgrade for a smoother experience.
Please note this is an old version of this entry, which may differ significantly from the current revision.
Subjects:
Endocrinology & Metabolism
Metabolism is a series of life-sustaining chemical reactions in organisms, providing energy required for cellular processes and building blocks for cellular constituents of proteins, lipids, carbohydrates and nucleic acids. Cancer cells frequently reprogram their metabolic behaviors to adapt their rapid proliferation and altered tumor microenvironments.
- thyroid cancer
- metabolomics
- the Warburg effect
1. Introduction
Metabolism is a series of life-sustaining chemical reactions in organisms, which produces the energy required for cellular processes and building blocks for cellular constituents of proteins, lipids, carbohydrates and nucleic acids. Cancer cells frequently reprogram their metabolic behaviors to adapt their own rapid proliferative status and altered—i.e., nutrient-limiting and/or hypoxic—tumor microenvironments. Thus, metabolic reprogramming is a hallmark of cancers [6]. All the constituents can be subjected to metabolic reprogramming at different levels in distinct cancers and/or even in different parts of a cancer. The most famous is “the Warburg effect”, that is, enhanced glycolysis even in oxygen-sufficient conditions [7]. Moreover, altered metabolisms of amino acids including glutamine and serine/glycine (connected to the one-carbon metabolism), fatty acids and redox equilibrium are also executed. These alterations are at least in part attributed to genetic mutations. Elucidation of the mechanism(s) for these metabolic reprogramming is expected to uncover the molecular events of malignant process and facilitate the development of novel diagnostic and therapeutic modalities.
2. Glucose Metabolism
2.1. Physiology
Glycolysis is one of the main metabolic pathways, where one molecule of glucose is converted into two molecules of pyruvate with the concurrent generation of two molecules of ATP [called the cytoplasmic substrate level phosphorylation (cSLP)] [10] (Figure 1). In the physiological condition where enough oxygen is present, pyruvate normally enters the tricarboxylic acid (TCA) cycle within mitochondria to produce NADH and FADH2 and two molecules of ATP or GTP per glucose [called the mitochondrial SLP (mtSLP)] [10,11]. NADH and FADH2, reducing agents, are subsequently used to generate an additional 34 molecules of ATP per glucose in the ETC. This ATP-producing reaction in the ETC is called oxidative phosphorylation (OXPHOS). However, when oxygen is insufficient, or in the case of the metabolic reprogramming frequently observed in cancers (the Warburg effect; see below), pyruvate is converted into lactate in the cytosol by lactate dehydrogenase (LDH) with concurrent regeneration of NAD+ from NADH. In this case, ATP production in mitochondria (the mtSLP and the ETC) is blocked, thereby generating less ATP, but increased NAD+ drives the first step of glycolysis flux and increases glycose uptake. In either case, glucose metabolism starts with translocation of glucose across the plasma membrane through glucose transporters (GLUTs), and is accomplished by a series of reactions catalyzed with several enzymes including hexokinase (HK), phosphoglucose isomerase, etc. in the glycolysis pathway, pyruvate dehydrogenase (PDH), citrate synthase, etc. in the TCA cycle, and NADPH dehydrogenase, succinate dehydrogenase, etc. in the ETC.
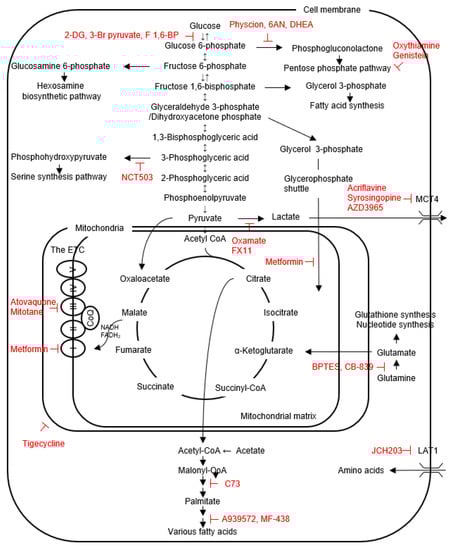
Figure 1. The scheme for the intracellular metabolic pathways and inhibitors (shown in red) of cancer metabolism, mainly targeting membrane transporters and enzymes.
In addition to ATP generation, glycolysis also supplies biosynthetic intermediates for cell proliferation and survival through the several branching pathways. The first example is glucose-6-phosphate (G6P), the first metabolic intermediate in the glycolysis pathway, which can be diverted into the pentose phosphate pathway (PPP) to drive NADPH generation to reduce reactive oxygen species (ROS) produced mainly by the ETC (an oxidative branch), and to supply ribose 5-phosphate for nucleotide biosynthesis (a non-oxidative branch); the second is fructose 6-phosphate used for the hexosamine biosynthetic pathway (HBP) generating uridine diphosphate-N-acetylglucosamine (UDP-GlcNAc), a substrate for protein N- and O-glycosylation reaction [12]; the third is fructose 1,6-bisphosphate (F1,6-BP) used for synthesis of glycerol 3-phosphate required for triacylglycerol formation [12]; the forth is 3-phosphoglycerate (3PG) used for the serine/glycine metabolism and one carbon metabolism, which support diverse cellular processes, including methylation, antioxidant defense and nucleotide metabolism [12]; the fifth is pyruvate used to generate oxaloacetate by pyruvate carboxylase (PCB) as an anaplerotic flux into the TCA cycle [13].
2.2. Glucose Metabolism Reprogramming in Thyroid Cancers
Expression of glucose-6-phosphate dehydrogenase (G6PD), an enzyme that mediates G6P to 6-phosphogluconolactone in the oxidative branch of the PPP, and transketolase, an enzyme that mediates the non-oxidative branch of the PPP, is higher in PTCs vs. normal tissues [48,49], as is 6-phosphogluconate dehydrogenase, another enzyme in the oxidative branch, in tall cell variants vs. classical PTCs [50], suggesting higher activities of the PPP shunt in the formers. Thus, deviations of glycolytic metabolic intermediates to the PPP and also to the serine synthesis pathway (SSP) (see below) are important for the proliferation and survival of thyroid cancer cells.
In the in vitro experimental settings, growth of eight human thyroid cancer cell lines, including 8505C, K18, C643, TPC1, etc., is largely dependent on glucose [51]. Compared to Nthy-ori 3-1 cells, an immortalized normal human thyroid cell line, BCPAP and TPC1 cells are more glycolytic, as demonstrated by higher glucose uptake, LDH production and expression levels of GLUT1 and HK1/2, although their mitochondrial function is intact [31,52,53,54]. LDHA knockdown (KD) and overexpression decreases and increases the migration and invasion of these cells, respectively. Similarly, down-regulation of LDHA by an inducible KD approach decreases cell viability, clonogenic activity and tumor growth, and increases radio-sensitivity of an ATC cell line Hth83 [43]. MCT1 expression is positively correlated with proliferation/invasion/migration in TPC1 cells [28]. PKM2 is overexpressed in thyroid cancer cell lines of TPC1, K1 and BCPAP, which is due to aberrant down-regulation of the tumor suppressive miRNAs, miR-148a and miR-326 [42,52]. Decreased kinase activity of PKM2 compared to PKM1 facilitates diversion of glycolytic intermediates to biosynthetic pathways such as the PPP and the SSP (mentioned above) [55]. G6PD expression is higher in TPC1 than Nthy-ori 3-1 cells [52]. However, higher expression of PCB is also reported in TPC1 and 8505C cells vs. Nthy-ori 3-1 cells [27,56]; in these cancer cell lines, this enzyme plays a role in replenishment of the TCA cycle (entry of oxaloacetate into the TCA cycle) and increases OXPHOS and thereby positively controls cell division and invasion, suggesting that pyruvate is converted not only to lactate but also to oxaloacetate to maintain mitochondrial metabolism even in glycolytic thyroid cancer cells of 8505C and TPC1 [27]. Involvement of PCB in fatty acid synthesis is also proposed (see below).
The in vitro experiments also revealed that thyroid cancer cells with BRAFV600E (BCPAP and 8505C cells) are more glycolytic than those without via HIF1α-MYC- peroxisome proliferator-activated receptor γ coactivator 1β (PGC1β) axis [29,57], and that glucose uptake is suppressed by vemurafenib, a BRAF inhibitor, in BCPAP cells having BRAFV600E [29,54]. Of interest, Lee et al. have found localization of BRAFV600E not only in the cytoplasm but also in mitochondria in PCCl3-BRAFV600E cells. Mitochondrial BRAFV600E suppresses apoptosis and OXPHOS, and these functions cannot be inhibited by tyrosine kinase inhibitors. This may be a molecular basis for limited efficacy of tyrosine kinase inhibitors [58]. The mutations of PTEN and TP53 are also reported to increase glucose uptake in WRO and FTC133 cell lines [59,60].
From the therapeutic perspective, the effects of glycolysis inhibition on cancer growth/survival have been reported: (i) a glycolysis inhibitor 2-deoxyglucose (2-DG; a HK inhibitor) inhibits proliferation of several thyroid cancer cell lines (8505C, BCPAP, TPC1, etc.) [51,52,57]. 2-DG also sensitizes cancer cells to chemotherapeutic agents (doxorubicin (DOX) and cisplatin), irradiation and sorafenib [51,57]. (ii) Another glycolysis inhibitor 3-bromopyruvate (an inhibitor for HK, GAPDH and MCT) combined with low glucose in an in vitro cell culture system and with ketogenic diet in an in vivo tumor model suppresses growth of 8505C, JL30 and BCPAP cells and 8505C tumors, respectively, the latter of which shows no apparent adverse effect on mice, but 3-bromopyruvate or ketogenic diet alone has no therapeutic effect in the in vivo model, indicating that their combination may be crucial [61]. Although it is not effective when used alone, the ketogenic diet consists of very low carbohydrate intake, thereby impairing glycolytic metabolism. Additionally, cancer cells cannot use ketone bodies efficiently, compared to normal cells [62]. (iii) F1,6-BP, by inhibiting glucose uptake through a negative feedback mechanism, suppresses cell proliferation and induces apoptosis in W3 cells [63]. (iv) Highly effective combination of a BRAF inhibitor vemurafenib (which induces a significant reduction in metabolic glucose demand) and a PDGF inhibitor imatinib (which increases metabolic energy demand) is also reported in BCPAP cells [54]. (v) LDHA inhibition by an inhibitor FX11 inhibits BCPAP tumor growth. This anti-tumor effect can be augmented when combined with autophagy inhibition by chloroquine, because LDHA inhibition induces protective autophagy [31]. Autophagy induced by chemotherapy, irradiation and a kinase inhibitor sorafenib is generally protective and pro-survival [64,65]. (vi) Inhibition of lactate export by inhibiting MCT4 with acliflavine, syrosingopine and AZD3965 significantly reduces proliferation of thyroid cancer cell lines such as 8505C, JL30 and TCO1 cells in a low glucose environment [66]. (vii) PKM2 KD by siRNA is also shown to suppress cell proliferation/colony formation and migration/invasion in TPC1 and K1 cells [42]. However, the efficiencies of the above inhibitors are far less than satisfactory, because inhibition of glycolysis alone has shown to lead to compensatory increases in OXPHOS and glutaminolysis [67].
The PPP inhibitors, such as G6PD inhibitors (6AN and DHEA) and transketolase inhibitors (oxythiamine and genistein), either individually or in combination (additively or slightly synergistically) suppress proliferation of BCPAP, K1, 8505C and SW1736 cells through apoptosis induction [49]. Dox-resistant 8505C and KAT-4 cells have higher G6PD expression, in which G6PD KD or a G6PD inhibitor physcion induces apoptosis and cancels resistance to Dox [68].
Because mitochondria are intact in most non-oncocytic thyroid cancers, glycolytic thyroid cancer cells are also sensitive to inhibitors for mitochondrial function and biosynthesis, such as atovaquone (a complex III inhibitor) [69], tigecycline (an inhibitor of mitochondrial translation) [70], mitotane (a cytochrome c inhibitor) [71] and metformin (an inhibitor of complex I, mitochondrial glycerophosphate dehydrogenase (MGPDH), fructose 1,6-bisphopsphate and glucose-6-phosphatase [72,73,74]. MGPDH, a critical enzyme for the glycerophosphate shuttle (see Figure 1), is overexpressed in thyroid cancers, and positively regulates cell growth and mitochondrial metabolism [74]. The effectiveness of metformin in treatment of thyroid cancer patients has also been reported [75]. Furthermore, combination therapies were attempted, showing the sensitization of thyroid cancer cells to paclitaxel, DOX and 2-DG by mitochondria inhibitors in 8505C, FTC133 BCPAP, TPC1, etc. [69,70,76]. These growth suppressive effects are no longer observed in thyroid cancer cell lines depleted with mitochondrial DNA (ρ0 cells), demonstrating that mitochondrial respiration is crucial for survival even in glycolytic thyroid cancer cell lines [69,70].
It is well known that ROS is a double-edged sword; ROS levels are generally higher in cancer cells which benefit their growth and migration, but when ROS increases more than a certain threshold, it induces cancer cell death. Moreover, the enhanced glycolysis drives ROS production [77] but at the same time ROS-scavenging molecules can be generated from the glycolytic intermediates through the PPP (see Section 2.1. Physiology). Thus, the role for ROS in cancer pathogenesis is complex. The same is true for thyroid cancer; numerous data show that anti-cancer effects of inhibition of glycolysis and also of mitochondrial function are at least in part attributed to ROS induction [49,63,70,78], and indeed that of F1,6-BP is cancelled by an antioxidant N-acetyl cysteine (NAC) [63]. On the other hand, however, the ketogenic diet reverses ROS levels and exerts a significant anti-cancer effect when combined with NAC in 8505C tumors [77].
In contrast, conflicting data are reported by Liu et al., which indicates that metabolic phenotype is the consequence, rather than the cause, of disease progression, and simply modifying the balance between glycolysis and OXPHOS would not be translated into beneficial effects in in vivo experimental settings (8505C, FTC133, etc.) [79].
Compared to non-oncocytic thyroid cancers, oncocytic thyroid cancers have dysfunctional mitochondria due to the loss-of-function mutations in mitochondrial DNA encoding the complex I and/or III of the ETC, essential for OXPHOS [5]. Metabolically, impaired OXPHOS makes the growth of oncocytic tumor cells totally dependent on glycolysis. Indeed, expression of glycolysis-related proteins such as GLUT1, HK II, carbonic anhydrase IX and MCT4 is higher in oncocytic cancers than non-oncocytic cancers [80], and FDG-PET signal is high, indicating high glucose uptake, in thyroid oncocytomas [81]. Thyroid oncocytic carcinoma cell line XTC.UC1 cells [82] exhibit higher glucose uptake than non-oncocytic cancer cells and cannot survive in glucose-free conditions [53,83,84]. However, LDH and lactate levels are not elevated or only marginally elevated in XTC.UC1 cells [85], presumably because glucose intermediate metabolites are used for synthesis of the glycosylation substrate UDP-GlcNAc in the HBP, for the SSP and for lipid metabolism [86,87]. Porcelli et al. have owed impaired glycolysis to the destabilization of HIF1α by higher αKG and normal succinate in XTC.UC1 cells [88]. Since HIF1α induces expression of genes responsible for glucose uptake (i.e., glucose transporters) and glucose breakdown, a lack of HIF1α expression inhibits glycolysis. However, Addie et al. found low aKG in the same cell line [86]. These data may represent heterogeneity within this cell line among different laboratories. In oncocytomas in other tissues, HIFα levels are variable; elevated HIF1α expression in benign renal oncocytoma and a human tumorigenic cell line C8T with heteroplasmic ND5 mutation [89,90,91] and comparable expression levels between pituitary oncocytomas and normal pituitary glands [92]. Shama et al. identified the pathway from complex I-defect to ROS elevation to AKT activation and to HIF1α elevation [90].
This entry is adapted from the peer-reviewed paper 10.3390/metabo12121214
This entry is offline, you can click here to edit this entry!