Your browser does not fully support modern features. Please upgrade for a smoother experience.
Please note this is an old version of this entry, which may differ significantly from the current revision.
Subjects:
Construction & Building Technology
Pavement or road surfaces can be categorized into four general classes, i.e., asphalt, concrete, gravel, and brick and block. Pavement condition is assessed by measuring several pavement characteristics such as roughness, surface skid resistance, pavement strength, deflection, and visual surface distresses.
- deep learning
- image segmentation
- pavement surface condition index
1. Introduction
Two vital elements of road pavement management are inventory management and periodic condition evaluation; both are used to set future priorities for pavement construction management and maintenance. Pavement refers to hard surfaces used for motor vehicles. A complete pavement management system consists of inventory data collection (i.e., width, length, shoulder, and pavement type) and pavement characteristic assessment, i.e., (roughness (ride), surface condition (distresses), surface skid resistance, pavement strength, and deflection). The current pavement networks, including motorways across a country, are developed and modernized over centuries. The construction, width, and length of a pavement depend on the traffic it will carry and the type of connection it will make. They are classified into different categories; for example, in Ireland, they are classified as motorways, national primary, national secondary, regional roads, and local roads [1]. A common way to periodically evaluate surface condition, including distresses on a pavement network, is for the civil authority to conduct a visual surface condition assessment and a ride smoothness test. Surface condition is assessed through visual surveying and usually consists of three steps: (1) pavement condition data collection, (2) distress identification and quantification, and (3) assigning a pavement rating index to a stretch of a pavement using a standard rating scale (e.g., pavement surface evaluation rating-PASER [2]) that is typically localized to a specific geographical region [3]. Figure 1 gives a complete picture of the three-step process. The data collection is followed by distress occurrence, severity measurement, and pavement condition rating decisions.
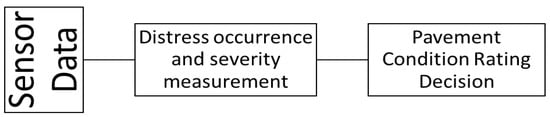
Figure 1. Pavement condition rating process.
Data collection, the first step of surface visual assessment, is usually carried out by specially adapted vehicles (or, more recently, on devices such as smartphones [4] or unmanned aerial vehicles) for visual surface surveying. The vehicle is fitted with a computer, Global Positioning System (GPS) sensor, and an imaging sensor. In step 2, pavement distresses are identified and quantified using their shape, size, and texture. Due to environmental and geographical conditions and the actual pavement construction process, pavement distresses may vary in shape, size, and texture. Variations can also be caused by different image capture technologies and the placement of sensors in specialized vehicles used to collect pavement data. In step 3, a rating is assigned to a stretch of pavement based on distress identification and quantification from step 2. A rating is applied to an initial stretch after inspection and then will be adjusted along the road if the pavement surface changes noticeably. The length of the stretch of road typically ranges from 50 m to 200 m, while the width of the stretch ranges from 4 m to the entire width of the road. The rating is performed directly by civil authority staff or subcontracted to private companies. Civil authorities use this condition rating to estimate pavement service life and treatment measures to improve the condition.
Maintenance and improvement of pavements are expensive. For example, Ireland’s government spent 850 million Euros in 2021 to improve and maintain local, regional, and national primary and secondary roads [5]. There are 5413 km of national highways (primary, secondary, and motorways), 13,124 km of regional roads, and 81,300 km of local roads in Ireland. It totalled 99,830 Km of road network in 2018 in Ireland, meaning 95% of the road network in Ireland consists of regional and local roads [5].
2. Pavement Surface Types and Distress Assessment Indicators
2.1. Pavement Surface and Distress
Pavement or road surfaces can be categorized into four general classes, i.e., asphalt, concrete, gravel, and brick and block [16]. Asphalt, also known as flexible pavement, is widely used to construct national, regional, or local roads across the road network and has different sub-categories depending on its construction. Over 90% of the total European road network has an asphalt surface. Concrete surfaces are usually used in urban environments and can be subdivided into joined cement concrete and continuously reinforced concrete surfaces [17]. Concrete pavements are expensive and time-consuming to construct, but they are typically more potent and durable than asphalt roadways. They are more common in the USA; for example, approximately 60 percent of the interstate system in the USA is concrete. Pavement condition assessment considers several pavement characteristics, i.e., roughness, surface condition (distress detection), surface skid resistance, and pavement strength. Surface condition plays a significant role in pavement assessment, which requires pavement distress detection and quantification. Pavement surface distresses that occur in different geographical regions can be divided into six groups, i.e., cracks, surface openings, surface deformation, surface defects, joint deficiencies, and miscellaneous distress [17,18] (see Table 1).
Table 1. A comprehensive list of distresses in asphalt rural flexible, asphalt, urban flexible, joined Portland concrete, continuously concrete reinforced roads, and segregation in six main groups and their sub types [16,17].
| Surface Distress Group | Asphalt Rural Flexible | Asphalt Urban Flexible | Joined Portland Concrete | Continuously Concrete Reinforced |
|---|---|---|---|---|
| Cracks | Alligator cracking | Fatigue cracking | Durability cracking | Durability Cracking |
| Block cracking | ||||
| Edge cracking | Edge cracking | Corner breakups | Corner breakups and shattered slabs | |
| Reflection cracking at joints | Reflection cracking at joints | |||
| Longitudinal cracking | Longitudinal cracking (wheel path and non-wheel path) | Longitudinal cracking | Longitudinal cracking | |
| Transverse cracking | Transverse cracking | Transverse cracking | Transverse cracking | |
| Meander and slippage | Meander and slippage | |||
| Surface Openings | Patches | Patches and utility patches | Patches and utility patches | Patches and utility patches |
| Potholes | Potholes | Blow-ups | Blow-ups | |
| Surface disintegration | Utility hole defects | Utility hole defects | Utility hole defects | |
| Surface Deformation | Rutting | Rutting | -- | -- |
| Depression and bumps | Shoving, depressions, bumps, sags, and heave | |||
| Surface Defects | Raveling | Raveling | Wearing | Wearing |
| Bleeding | Bleeding | Polish aggregate | Polish aggregate | |
| Miscellaneous Distresses | Lane-to-shoulder drop off | Lane-to-shoulder drop off | Lane-to-shoulder drop-off and separation | Lane-to-shoulder drop-off and separation |
| Water bleeding and pumping | Water bleeding and pumping | Water bleeding and pumping | Water bleeding and pumping | |
| Joint Deficiencies | --- | --- | Joint seal damage (longitudinal and transverse) | Joint seal damage (longitudinal and transverse) |
| Spalling of longitudinal and transverse joints | Spalling of longitudinal and transverse joints |
Most of these distresses can be detected generally through visual inspection (standard practice) of pavement surfaces, and their severity and quantity can be recorded using manual measurement tools [17]. Visual distresses appears on the surface due to wear and tear, which may indicate a fault in the construction. It may appear differently in rural and urban regions, depending on the surface type, the severity (low, medium, high) of the underlying problem, and other environmental conditions.
2.2. Pavement Assessment Indicators
Measuring different pavement characteristics is essential in long-term pavement performance incorporating all or a subset of pavement characteristics to conduct pavement assessments. These condition rating systems vary from country to country (or within a state in the USA), considering local variations, the characteristics of the pavements, and economic conditions.
Pavement characteristics that are generally separately measured include pavement roughness; a vital pavement characteristic measured on a rating index known as the International Roughness Index (IRI) [19]. It is estimated in a moving vehicle from a longitudinal pavement profile with sensors capable of measuring vertical movement [20,21]. Another essential characteristic is transverse deflection, also known as rut depth, measured manually or using sensors that generate transverse pavement profiles [9]. Visual pavement condition assessment requires distress detection and quantification to measure pavement conditions and is more reliable than other methods are. Engineers and professionals have proposed several standards for visual surface assessment, such as Pavement Surface Evaluation Rating (PASER) [2], Pavement Condition Index (PCI) [19,22], Pavement Surface Condition Index (PSCI) [23], and the Road Condition Indicator (RCI) [24]. Table 2 lists different pavement condition ratings used around the world. The standard ratings of various regions differ in scale granularity, formula to estimate a value on the rating scale, and data acquisition procedure.
Table 2. A summary of different pavement condition rating systems used by regional road transportation departments or proposed by academics.
| Type of Indicators | Granularity | Measurement Criteria | Standard Developing Body |
|---|---|---|---|
| Present Serviceability Index (PSI) | 5 (Excellent)—0 (Essentially impassable) | A mathematical formula based on the severity of surface roughness, cracking, deflection | Illinois, Minnesota, and Indiana—AASHO Road Test (1961) |
| Integer value | |||
| Pavement Condition Index (PCI) | 100–85 (Good)—0–10 (Failed) | A mathematical formula based on the occurrence, and severity of distresses, mainly crack and IRI | ASTM D6433—11 |
| Pavement Condition Rating (PCR) | Alabama Department of Transport | ||
| Pavement Structural Condition (PSC) | Washington Department of Transport | ||
| Surface Condition Rating (SCR) | Georgia Department of Transport | ||
| Pavement Surface Evaluation and Rating (PASER) | 10 (Excellent)—1 (failed) | A direct rating based on visual distresses | Wisconsin Transportation Information Center, University of Wisconsin Madison, USA |
| Integer value | |||
| Pavement Surface Condition Index (PSCI) | 10 (Perfect)—1 (No surface) | A direct rating based on visual distresses | Road Management Office, Ireland |
| Integer value | |||
| Unified Pavement Distress Index for Managing Flexible Pavements (UPDI) | 0 (Failed)—1 (Perfect) | A mathematical formula based on six visual distress | Civil Engineering Department, Clemson University, USA |
| Pavement Distress Index (PDI) | Good/Fair/Poor | IRI, rutting, cracking, and faulting are used to estimate PDI | Arizona Department of Transport |
| Pavement Performance Levels | Good/Fair/Poor | IRI, rutting, cracking, and faulting are used to estimate PDI | Kansas Department of Transport |
| Pavement Quality Index (PQI) | 0 (Fail)—4.0 (Good) | A square root of the product of roughness quality index (RQI) and visual surface rating (SR) | Government Accounting Standards Board, Standard 34 (GASB 34). Minnesota |
| Condition Rating Score (CR) | 1–59 (Very poor)—90–100 (Very good) | Mathematical combination of distress and ride quality (roughness) | Texas Department of Transport |
| Pavement Condition Index -2 | 1–100 (same as PCI) | A mathematical formula based on cracking index, riding index, and rutting/faulting index | IOWA STATE University Institute for Transportation |
| Pavement Condition | Good/Fair/Poor/Very/Poor | A pavement condition based on the international roughness index | New Hampshire Department of Transportation |
| Remaining Service Life (RSL) | Good/Fair/Poor | A superset rating is calculated based on PCI rating (0–100) | Colorado Department of Transportation |
| Chinese Pavement Condition Index | 100–85 (Good)—0–10 (Failed) | A mathematical formula based on the occurrence, and severity of distresses, mainly crack and IRI | China |
| Maintenance Control Index (MCI) | 10 (Good)—0–1 (Failed) | A mathematical formula based on cracking Ratio, Rutting Depth, and roughness | Japan (Until 2005) |
| Repair Requirement Index (RRI) | 0-5 New – More than 12 (Lifetime over) | A mathematical formula based on International Roughness Index, crack rate coefficient, and pothole rank coefficient | Japan (after 2005) Tajikistan |
| Road Condition Index | 1 (poor)—4 (Good) | A mathematical formula based on the occurrence and severity of visual distresses and roughness index | UK |
| Pavement Distress Condition Rating | Good/Fair/Poor | A rating is based on maintenance strategy and is a function of cracks, patches, and potholes | India |
| Condition Index (CI) | 0 (Excellent)—100 (Failed) | A mathematical formula based on visually measured condition defects | New Zealand |
| RMA | 1 (Poor)—4 (Good) | A mathematical formula based on the occurrence and severity of visual distresses and roughness index | Germany |
The earliest work in creating a standardized condition assessment scale dates from the 1960s in the United States [25]. The scale used two pavement characteristics-pavement roughness and visual surface distress identification, to determine the Present Serviceability Index (PSI) ranges from zero (very poor) to five (very good condition). A roughness index was carried out by 3–5 individual raters trained to qualitatively estimate pavement roughness by driving a vehicle on the pavement. It was followed by visual inspection for cracks, patches, and potholes. These two were then combined mathematically to calculate the PSI score (0–5) [25].
Over the years, data acquisition techniques have evolved; different pavement condition assessment ratings have been proposed that mainly focus on assessing the different types of pavement characteristics, their quantity, and their effect on the overall condition of the pavement. PASER is a direct rating on a scale of 10–1 (9–10 is excellent condition, while 2–1 is extremely poor). On the other hand, the ASTM standard for pavement is PCI, a rating on a scale of 100–0 (85–100 is a good condition, while 0–10 is completely deteriorated. It is mathematically based on distress occurrence and severity level. The Irish PSCI [18,23,26] rating is on a scale from 1–10, similar to PASER, where index-1 is the lowest (surface completely worn out or failed), and index-10 (no distress, new pavement) is the highest. It covers flexible urban pavements, urban concrete pavements, and flexible rural pavement separately. PSCI ratings are given to continuous stretches of pavements with similar conditions, with 200 m being the minimum length to have their distinct rating [26]. In the United States, the Federal Land Transportation program recommends visual distress detection based on PASER for direct pavement condition evaluation [27]. Some transportation departments (or road authorities) that use scales similar to PCI use a subset of the visual distresses and roughness index to calculate the PCI rating. For example, the New Zealand Road Assessment and Maintenance Management System (RAMM) assigns a CI (Condition Index) from 0–100 (0–Excellent—100–Failed); it includes a visual inspection of not only the pavement but the surface water channels along the pavement [28]. China uses the Chinese Pavement Condition Index (CPCI), a scale similar to PCI, and considers cracking, raveling, potholes, rutting, and roughness. Japan used the Maintenance Control Index (MCI) until 2005, a function of cracking, rutting, and roughness, on a scale of 10 to 0 [29]. After 2005, the Ministry of Transportation Japan has used RRI, which is a function of cracking ratio, rutting depth, and International Roughtness Index [29]. A similar index is used in Tajikistan under Japan International Cooperation Agency [30].
The RCI is a rating from 1–4 (with 1 meaning no physical deterioration, while 4 is severe deterioration), adopted in England, Wales, Scotland, and Northern Ireland, and fuses visual condition and gauging parameters of pavement condition [24]. In Germany, the RMA (Road Monitoring and Assessment) protocol rate the pavement into four categories based on visual distresses [31]. Some states use four classes in the USA, i.e., Good, Fair, Poor, Very-Poor, as a condition scale based on the original PSI rating. In some countries, such as India and Brazil, a visible pavement distress condition rating on a scale of 0 to 3 is used [32]. Ratings are based on cracking, rutting, raveling, patching, and potholes, while roughness is not considered [3]. Pavement condition surveys of national and local roads are commonly conducted annually, every two years, or every five years in different regions across the world (for example, in Ireland, they are conducted every two years, while in Florida, state highway surveys are completed annually [33]). Therefore, these survey methods should be quick, fast, reliable, and economical.
In summary, different regions have different ways of performing pavement condition rating; some take roughness and visual condition combined to assign a rating from a standard scale (e.g., China, Japan, and some states in the USA), while others rate only a subset of visual distress (e.g., UK, Ireland, Brazil, Germany, New Zealand, India, and some states in the USA). Some of these indices are very granular (1 to 100) such as PCI in some parts of USA versus that (0 to 3 scale) used in Brazil/India. The choice of scale has evolved with economic prosperity and maturity of the road network.
This entry is adapted from the peer-reviewed paper 10.3390/s22229019
This entry is offline, you can click here to edit this entry!