Your browser does not fully support modern features. Please upgrade for a smoother experience.
Please note this is an old version of this entry, which may differ significantly from the current revision.
Subjects:
Medicine, General & Internal
The bone marrow (BM), the major hematopoietic organ in humans, consists of a pleiomorphic environment of cellular, extracellular, and bioactive compounds with continuous and complex interactions between them, leading to the formation of mature blood cells found in the peripheral circulation. The bone marrow (BM) microenvironment regulates normal hematopoiesis and exerts variable activity in various inflammatory, toxic, autoimmune, or neoplastic diseases and conditions. It has a major role in the pathogenesis of BM failure syndromes and particularly of myelodysplastic syndromes (MDS).
- myelodysplastic syndromes
- NF-κB
- HMGB1
1. 5q− Syndrome as a Representative Example of Immune Dysregulation in MDS Initiation
5q− syndrome, a common MDS subtype, provides evidence for the overstimulation of the innate immune system in the development of myelodysplasia. Deletion of miR-145 and miR-146, located on chromosome 5q, phenocopies 5q− syndrome, and activates NF-κB signaling, since miR-145 and miR-146 target NF-κB pathway mediators, Toll-interleukin-1 receptor domain-containing adaptor protein (TIRAP), and Tumor necrosis factor receptor-associated factor 6 (TRAF6), respectively. The dysplastic phenotype in TRAF6-transduced mice is linked to IL-6 overexpression and paracrine action, while clonal expansion and acute myeloid leukemia (AML) development rely upon TRAF6 activation in a cell-autonomous fashion [1]. Interestingly, lenalinomide, the treatment of choice for 5q− syndrome, has been found to suppress IL-6 expression [2]. Aged mice show decreased miR-146 expression and elimination of miR-146 results in premature HSC aging and development of myeloid malignancy, dependent upon IL-6 and TNF activation. When IL-6 and TNF were targeted, the function of HSCs in miR-146-deficient mice was restored [3].
2. Overactivation of Inflammatory Pathways in MDS HSCs
In MDS, emerging data support cell-intrinsic mechanisms in the dysregulated innate immune and inflammatory signaling, involved in disease pathophysiology [4]. MDS HSCs exhibit increased expression of TLR receptors [5]. TLR-4 upregulation correlates with increased apoptosis in MDS [6]. TLR-2 overexpression is linked to low-risk disease while TLR-6 overexpression characterizes high-risk MDS. Chronic stimulation of the TLR-2/TLR-6 complex accelerates progression to AML [7]. The overstimulation of the NLRP3 inflammasome by DAMPs, most notably S100 calcium-binding protein A8 (S100A8) and S100 calcium-binding protein A9 (S100A9), and caspase-1 activation is a central event in MDS, irrespective of the underlying mutational profile [8][9]. In addition, overactivation of the TGF-β signaling, via the upregulation of Mothers against decapentaplegic homolog/SMAD family member 2 (SMAD2) or the inhibition of the negative regulator Mothers against decapentaplegic homolog/SMAD family member 7 (SMAD7), correlates with myelosuppression in MDS [10][11]. Certain driver mutations in MDS, especially in splicing factors, contribute to the dysregulation of immune-related molecules. Mutated U2 small nuclear RNA auxiliary factor 1 (U2AF1) produces a long isoform of Interleukin-1 receptor-associated kinase 4 (IRAK4) (IRAK4-L), that overactivated NF-κB signaling via myddosome assembly [12]. Splicing factor 3B subunit 1 (SF3B1) mutations, one of the most encountered mutations in MDS, also result in IRAK4-L overexpression, but additionally hinder Mitogen-activated protein kinase kinase kinase 7 (MAP3K7) expression, which indirectly restricts NF-κB signaling, leading to hyperactivated NF-κB signaling. Serine and arginine rich splicing factor 2 (SRSF2) mutations lead to aberrant splicing of caspase 8, whose inhibition is necessary for the induction of necroptosis instead of apoptosis [13].
3. The Immunomodulatory Role of High Mobility Group Box-1 (HMGB1) in MDS BM
HMGB1 is a nuclear, non-histone DNA-binding protein that regulates chromatin remodeling and transcriptional states. HMGB1 belongs to endogenous DAMPs, known as alarmins, and perpetuates inflammation following its passive release from necrotic cells or active secretion by innate immune cells or “stressed” cells. NF-kB activation is involved in HMGB1 signaling, subsequently to HMGB1 ligation to both advanced glycation end products receptor (RAGE) and TLRs [14]. In the BM, HMGB1 promotes HSC self-renewal and differentiation capacity but is also involved in hematologic malignancies [15]. In MDS, HMGB1 emerges as an important and potentially targetable contributor to the inflammatory BM milieu. Serum HMGB1 levels are significantly increased in MDS patients when compared to healthy controls [16][17] as well as compared to patients with other BM failure syndromes, highlighting its specific role in MDS pathophysiology [17]. Circulating HMGB1 levels are higher in low-risk MDS than in high-risk MDS patients, in consistence with the greater BM inflammatory load of the former group [17]. The defective apoptotic cell clearance by macrophages in the BM of MDS patients may secondarily initiate cell necrosis and release of HMGB1, which then leads to TLR4 activation and cytokine secretion [16]. Inflammasome activation also results in HMGB1 release [18], which may constitute an additional mechanism of HMGB1 overexpression in MDS. Kam et al. reported a two-to-three-fold higher expression of HMGB1 in MDS CD34+ cells compared to normal hematopoietic cells. Most importantly, they found that HMGB1 inhibition diminishes MDS cell expansion and has an additive effect on azacytidine or decitabine treatment while sparing normal hematopoietic cells. HMGB1 inhibition also correlates with downregulation of TLR receptors and NF-kB signaling, which suggests the immunodulatory role of HMGB1 in the BM [19].
4. Alterations of Cytokines and Immune Cells in the BM Microenvironment
4.1. Cytokines
Increased levels of serum TNF-α, TGF-β, IL-6, and Interleukin 8 (IL-8) have repeatedly been reported in MDS [20][21][22]. Cytokine levels reflect the distinct immune dysregulation mechanisms that are involved in different disease stages. Low-risk MDS is characterized by an increased apoptotic rate and a pro-inflammatory microenvironment, where type I cytokines (e.g., IL-1β, Interleukin 7 (IL-7), IL-8, Interleukin 12 (IL-12)) dominate [23], [Figure 1]. On the contrary, high-risk MDS patients exhibit comparatively decreased apoptosis and clonal expansion of malignant cells due to immune evasion that is mediated by inhibitory factors, namely Interleukin 10 (IL-10) and soluble Interleukin-2 Receptor (sIL-2R) [24][25], [Figure 2]. The number of CD8+ T cells and IL-10 levels are inversely related [26].
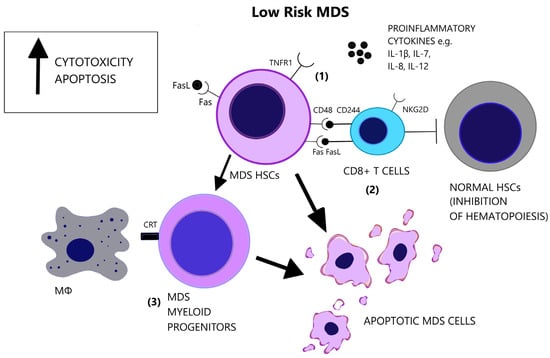
Figure 1. Low-risk MDS is characterized by a pro-apoptotic and cytotoxic microenvironment. (1) Apart from the elevated number of pro-inflammatory cytokines in the BM, there is increased responsiveness of the MDS cells that express the pro-apoptotic receptors, Fas and TNFR1. (2) CD8+ T-cells target MDS cells and exhibit augmented cytotoxicity, partly due to the expression of NKG2D and CD244 receptors. However, CD8+ T-cells suppress also normal hematopoietic cells and inhibit hematopoiesis. (3) MDS myeloid progenitor cells, derived from MDS HSCs, express the prophagocytic molecule CRT, possibly representing the main factor of cellular loss in low-risk MDS. (CRT = Calretinin, Fas = Fas receptor, FasL = Fas ligand, HSCs = Hematopoietic stem cells, IL-1β = Interleukin-1 beta, IL-7 = Interleukin-7, IL-8 = Interleukin-8, IL-12 = Interleukin-12, MΦ = Macrophage, NK2GD = Natural killer group 2D, TNFR1 = Tumor necrosis factor receptor 1).
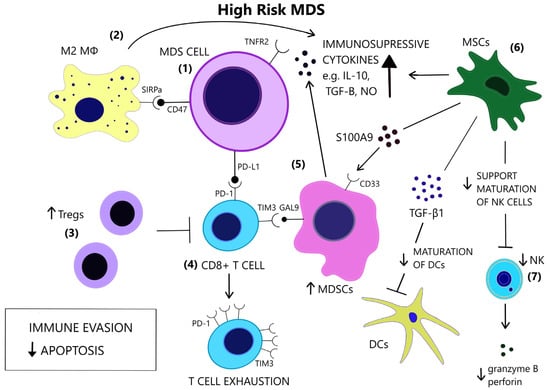
Figure 2. In contrast to low-risk MDS, immune evasion and decreased apoptosis enable clonal expansion in the BM of high-risk MDS. (1) In high risk MDS cells, there is a preferential expression of the anti-apoptotic TNFR2 and the anti-phagocytic CD47. (2) Macrophages acquire a M2 phenotype and produce IL-10. (3) Tregs expand and contribute to immune suppression. (4) CD8+ T-cell exhaustion is mediated by the expression of immune checkpoint molecules PD-1, PD-L1 and TIM3. (5) TIM3-ligand, Gal9, is expressed on MDSCs, which are induced upon binding of alarmin S100A9 on their CD33 receptor. MDSCs are increased and provide a large amount of immunosuppressive cytokines in the BM of high risk MDS. (6) MSCs are implicated in the anti-inflammatory microenvironment as they are a source of S100A9 and inhibitory molecules, such as TGF-β1, which suppresses DC maturation. (7) NK cells receive inadequate support from MSCs and exhibit impaired maturation, numerical and functional deficiency. (GAL9 = Galectin9, DCs = Dendritic cells, IL-10 = Interleukin-10, M2 MΦ = M2 macrophage, MDSCs = Myeloid-derived suppressor cells, MSCs = Mesenchymal stromal cells, NK = Natural killer, NO = Nitric oxide, PD-1 = Programmed cell death protein 1, PD-L1 = Programmed death-ligand 1, S100A9 = S100 calcium-binding protein A9, SIRPa = Signal regulatory protein alpha, TGF-β = Transforming growth factor-beta, TIM3 = T-cell immunoglobulin and mucin-domain containing 3, TNFR2 = Tumor necrosis factor receptor 2, Tregs = T regulatory cells).
Apoptosis is one of the most notably activated pathways in CD34+ cells from refractory anemia (RA) patients, when compared to healthy controls or refractory anemia with excess blast (RAEB) patients [27][28], [Figure 1]. The extrinsic apoptotic pathway involves the activation of the Fas death receptor (Fas) on the cell surface by Fas ligand, which is overexpressed in MDS patients [29]. Whereas normal CD34+ progenitor cells are devoid of Fas, its expression is induced by cytokines such as TNF-α and Interferon gamma (IFN-γ), which are elevated in low-risk MDS patients, when compared to high-risk MDS patients [30][31]. TNF-α selectively stimulates TNF receptor 1 (TNFR1), leading to the activation of proinflammatory signaling pathways and apoptosis, as opposed to TNF receptor 2 (TNFR2), which has an anti-apoptotic function [32]. In line with the pro-apoptotic microenvironment of low-risk MDS and the anti-apoptotic features of high-risk MDS, BM cells in RA patients overexpress TNFR1 [Figure 1], while TNFR2 expression is notable in RAEB patients [Figure 2], [33]. High serum levels of TNF-α in MDS patients are correlated with poorer performance status, higher leukocyte counts, β2-microglobulin and creatinine levels and on the contrary, lower TNF-α levels have been associated with favorable prognosis [34]. In advanced MDS, high serum levels of IL-6 and Granulocyte-macrophage colony-stimulating factor (GM-CSF) are observed. IL-6, IL-7, and C-X-C motif chemokine ligand 10 (CXCL10) may serve as independent prognostic factors of survival [35].
4.2. Immune Cells
Lymphocytes
A subset of MDS patients exhibit the clonal expansion of T cells, characterized by T cell receptor (TCR) Vβ-repertoir skewing, probably reflecting an antigen-driven process [36]. Immunosuppressive therapies reverse the TCR-Vβ phenotype of T cells in hypocellular MDS [37]. A CD8+/CD57+/CD28− T cell phenotype is overrepresented in MDS patients compared to age-matched controls [38][39][40] and characterizes a population of terminally differentiated, memory/effector T cells that have undergone repeated cell division cycles [41]. Natural killer group 2D (NKG2D) and CD244, which are normally NK receptors, are expressed on MDS T cells and render effector capacity while HSCs express the CD244 ligand, CD48 [38], [Figure 1]. Diminished expression of the lymph node homing receptors C-C chemokine receptor 7 (CCR7) and L-Selectin (CD62L), also found on clonal MDS T cells, coincides with lymphocyte expansion in the bone marrow [38]. CD48 expression on MDS HSCs is further augmented following lenalinomide treatment, which may represent a mechanism of induction of apoptosis by this agent [42]. Deprivation of CD8+CD57+ T cells in vitro triggers colony formation of BM mononuclear cells in a subset of MDS cases. In the cases with abnormal karyotypes (+8, 20q−, 5q−) the proportion of clonal cells increases significantly [43]. These findings support the inhibitory effect of CD8+ cells on the neoplastic cells of MDS.
Potential epitopes on MDS stem cells that activate anti-tumoral CD8+ T cells include Wilms tumor 1 protein (WT1), cancer-testis antigens (CTAs), proteinase 3, and Major Histocompatibility Complex class I (MHC I) [44][45][46]. Alongside malignant stem cells, CD8+ T cells target non-malignant hematopoietic cells and inhibit hematopoiesis in MDS. CD34+ cells and mononuclear cells of trisomy 8 MDS patients overexpress WT-1, which triggers the clonal expansion of WT1-specific CD8+ cells that contribute to myelosuppression. These findings are consistent with the increased efficacy of immunosuppressive therapy in trisomy 8 MDS patients [45]. Hypomethylating agents (HMAs) significantly upregulate the expression of CTAs on AML leukemic cells, which correlates with the enhanced recognition of tumor cells by T cells [47].
The absolute number of CD4+ T cells is decreased in MDS patients compared to healthy controls and results in a reduction in the CD4/CD8 ratio [48]. The abnormal CD4/CD8 ratio in young MDS patients further correlates with response to immunosuppressive therapy and probably reflects the loss of the regulatory T cell (Treg) compartment of CD4+ cells. A higher proliferative T cell index in these patients may reflect activation of “homeostatic proliferation”, mediated by Interleukin 2 receptor gamma (IL-2Rγ), leading to non-specific T cell expansion, including self-reactive T-cells [49]. This model serves as a potential alternative mechanism of CD8+ expansion, besides antigen-specific responses, and may explain the autoimmunity-associated features of MDS [49][50]. Moreover, in low-risk MDS patients Th17 cells are increased and Tregs are inversely decreased and functionally impaired [18]. In high-risk MDS patients, Tregs are expanded while CD8+ T cells and NK cells are decreased [51][52][53]. Symeonidis et al. have associated CD3+ and CD8+ cell lymphopenia with increased risk of infections, transformation to AML, as well as decreased overall survival. According to this theory, although in MDS recognition of autologous antigens is impaired favoring autoimmunity, the immune reaction against CD34+ cells is increased, as compared to normal subjects. Thus this in vitro finding, together with the increase in suppressive CD8+ cells, might be considered as a defensive mechanism of the host against the expanding MDS clonal cells, which ultimately is abrogated during disease progression to higher-risk disease or AML, generating immune tolerance against the expanding population of blast cells [54].
The conversion to an immune evasive microenvironment in advanced MDS is facilitated by the overexpression of immune checkpoint molecules, including the programmed cell death of protein 1 (PD-1), its ligand PD-L1, and cytotoxic T lymphocyte-associated protein 4 (CTLA-4), leading to T cell exhaustion [55], [Figure 2]. The interaction of PD-1 and PD-L1 suppresses TCR-mediated proliferation and cytokine expression [56]. High-risk MDS patients show increased PD-L1 expression on blast cells, compared to healthy controls [57]. Yang et al. observed at least a two-fold upregulation of PD-L1 on BM CD34+ cells in 36% of studied samples from MDS patients and an enhanced expression of PD-L1, PD-1 and CTLA-4 after HMA treatment [58]. Secreted factors in the microenvironment, such as IFN-γ and TNF-α, upregulate PD-L1 expression [59][60] and recently, the role of S100A9, a central molecule in the MDS pathophysiology, as an inducer of PD-1 and PD-L1, has been detected [61]. Contrary to former knowledge, recently, Ferrari et al. did not observe an inhibition of cytotoxicity after de novo PD-L1 expression on MDS cells [62]. Additional inhibitory signals originating from the innate immune system may interfere with anti-tumor immunity.
Macrophages
Macrophage-mediated apoptosis in low-risk MDS affects myeloid progenitor cells expressing the prophagocytic receptor calretinin (CRT) rather than HSCs, which lack CRT expression and are rescued from apoptosis [63], [Figure 1]. Myeloid progenitor cells from high-risk MDS patients additionally overexpress CD47, which is a surface anti-phagocytic molecule abnormally expressed on tumor cells that binds to its receptor Signal regulatory protein alpha (SIRPa) on macrophages and inhibits phagocytosis, counteracting CRT [63], [Figure 2]. Despite the increase in monocyte cells in the peripheral blood of MDS patients, decreased differentiation into macrophages and attenuated phagocytic capacity of macrophages are reported [64].
Aside from the impaired recognition and phagocytosis of MDS cells by macrophages [64], Zhang et al. found an abnormal polarization of macrophages with decreased M1:M2 ratio in high-risk MDS patients [65]. M1 macrophages participate in antitumor immune response via secretion of pro-inflammatory factors and recognition of tumor-associated antigens (TAAs) [66]. However, M1 macrophages derived from MDS patients show decreased expression of IL-1β and TNF-α [65]. Tumor-associated macrophages (TAMs) in late-stage cancer are characterized by an M2-like phenotype (low IL-12 and high IL-10 expression) and potentiate tumor progression through decreased tumoricidal activity, angiogenesis, and matrix remodeling [67]. The increase in the M2 macrophages in high-risk MDS patients may therefore contribute to impaired immunosurveillance and clonal expansion, in line with studies highlighting the role of TAMs in AML progression [68][69] and the promising results of macrophage repolarization [70].
NK Cells
The cytolytic function of NK cells is compromised in MDS patients [71], partly due to the reduced expression of the stimulating receptors DNAX accessory molecule 1 (DNAM-1) and NKG2D on the surface of NK cells, while their expression is inversely correlated to the BM blast counts [72]. Hejazi et al. observed a significant reduction in NK cell numbers preferentially in high-risk MDS patients and correlated their functional deficiency to low levels of granzyme B and perforin as well as the NK cells’ immaturity in MDS [73], [Figure 2]. The inability of NK cells to fully mature may stem from their ineffective support from MDS mesenchymal stromal cells (MSCs) [74], since stromal support is a prerequisite for the development of mature, Killer-cell immunoglobulin-like receptor (KIR)-expressing NK cells [75]. Partial clonal involvement of NK cells [76] and certain congenital mutations that link MDS predisposition and NK cell alterations [77][78][79] highlight the contribution of potential intrinsic defects to NK cell impairment.
Dendritic Cells
Lower numbers and functional deficiency of DCs in MDS may contribute to immunodeficiency and autoimmunity of MDS. FISH analysis revealed the origin of MDS DCs from the malignant clones [80]. CD34+ progenitor cells from MDS patients exhibit impaired in vitro generation of DCs [81]. Similarly, the differentiation of blood monocytes from MDS patients to DCs is impaired. Immature monocyte-derived DCs (MoDCs) show diminished expression of surface molecules CD80 and CD1a, reduced endocytic capacity and ineffective maturation following TNF-α stimulation [82]. The ineffective induction of T-cells [83] and altered cytokine secretion (less IL-12 and more IL-10 expression) [84] are further aspects of DC impairment in MDS. MDS DCs show downregulation of transcripts involved in pro-inflammatory pathways which may explain their reduced immune responsiveness [85].
MDSCs
MDSCs are immature immune cells increased in the context of immunosuppression, inflammation, and cancer [86] and contribute to cancer progression [87]. The two-stage model of MDSC involvement in cancer requires firstly the expansion of myeloid cells under chronic inflammatory stimulation and secondly their activation in the tumor microenvironment [88]. Rationally, MDS BM inflammatory microenvironment facilitates MDSC development [89]. Elevated numbers of MDSCs are found in the BM of MDS patients, mostly high risk, and correlate with Treg expansion and disease progression [90]. MDSCs serve as a source of inhibitory cytokines, such as IL-10, TGF-β, NO, and arginase [Figure 2] and contribute to the suppression of hematopoiesis in MDS and the induction of T cell tolerance [91]. MDSCs expand also in the bone marrow of aged healthy individuals, parallel to the rise of inflammatory cytokines in the serum, at least in part due to NF-κB activation [92][93]. However, MDS-derived MDSCs overexpress CD33, and their suppressive function depends upon the binding of pro-inflammatory molecules, such as S100A9, to the CD33 receptor on MDSCs [91][94], [Figure 2]. Forced MDSC expansion in S100A9 transgenic mice suffices to induce human MDS phenotype, while induced terminal differentiation eliminated MDSCs and restored hematopoiesis. A mechanism in which CD33 overexpression overrides maturation signals from Immunoreceptor tyrosine-based activated motifs (ITAM)-associated receptors and retains the expansion of immature MDSCs was proposed [91]. High levels of IL-6 and chemokine (C-C motif) ligand 2 (CCL2) in MDS patients may additionally induce MDCSs, as these molecules activate the STAΤ3 pathway, which is crucial for MDSC-mediated inhibition of CD8+ T cell function [95]. Tao et al. found that CD8+ T-cell exhaustion in MDS was partially dependent upon activation of the T-cell immunoglobulin and mucin-domain containing 3 (TIM3)/Galectin 9 (Gal 9) pathway [Figure 2] and suggested that Gal 9 upregulation by MDSCs is responsible for this activation [96]. TIM3/Carcinoembryonic antigen-related cell adhesion molecule 1 (CEACAM1) pathway activation may also be an alternative mechanism of MDSC involvement in T-cell exhaustion [97]. Irrespective of the specific mechanisms of MDSC-induced inhibition, MDSCs do not harbor the same mutations as the dysplastic clones [91], thus constituting an independent cellular component of the microenvironment that is actively involved in MDS pathophysiology.
5. Role of MSCs in the Inflammatory BM Milieu
MSCs are a stromal component of the MDS microenvironment that may be involved in the pathogenesis and evolution of MDS via inflammatory signaling [98]. MSCs functionally decline with age [99]. In MDS, MSCs acquire distinct genetic alterations from the malignant clone [100] and show activation of inflammatory pathways [101][102]. Importantly, MSCs secrete S100A8/9, which generates genotoxic stress in HSCs [103], [Figure 2]. S100A8/9 expression in MSCs, associated with activation of p53 and TLR pathways, is predictive of leukemic evolution in MDS [103]. MSCs have different immunomodulatory effects depending on the disease stage. They suppress DC maturation and function more potently in high-risk MDS compared to low-risk MDS, and this suppression is mediated through TGF-β1 secretion by MDS MSCs [104], [Figure 2]. Sarhan et al. attributed the immunosuppressive properties of MDS MSCs, specifically the inhibition of NK cell function and T-cell proliferation, on the induction of suppressive monocytes [105].
This entry is adapted from the peer-reviewed paper 10.3390/cancers14225656
References
- Starczynowski, D.T.; Kuchenbauer, F.; Argiropoulos, B.; Sung, S.; Morin, R.; Muranyi, A.; Hirst, M.; Hogge, D.; Marra, M.; Wells, R.A.; et al. Identification of miR-145 and miR-146a as mediators of the 5q− syndrome phenotype. Nat. Med. 2010, 16, 49–58.
- Corral, L.G.; Haslett, P.A.; Muller, G.W.; Chen, R.; Wong, L.M.; Ocampo, C.J.; Patterson, R.T.; Stirling, D.I.; Kaplan, G. Differential cytokine modulation and T cell activation by two distinct classes of thalidomide analogues that are potent inhibitors of TNF-alpha. J. Immunol. 1999, 163, 380–386.
- Grants, J.M.; Wegrzyn, J.; Hui, T.; O’Neill, K.; Shadbolt, M.; Knapp, D.; Parker, J.; Deng, Y.; Gopal, A.; Docking, T.R.; et al. Altered microRNA expression links IL6 and TNF-induced inflammaging with myeloid malignancy in humans and mice. Blood 2020, 135, 2235–2251.
- Trowbridge, J.J.; Starczynowski, D.T. Innate immune pathways and inflammation in hematopoietic aging, clonal hematopoiesis, and MDS. J. Exp. Med. 2021, 218, e20201544.
- Wei, Y.; Dimicoli, S.; Bueso-Ramos, C.; Chen, R.; Yang, H.; Neuberg, D.; Pierce, S.; Jia, Y.; Zheng, H.; Wang, H.; et al. Toll-like receptor alterations in myelodysplastic syndrome. Leukemia 2013, 27, 1832–1840.
- Maratheftis, C.I.; Andreakos, E.; Moutsopoulos, H.M.; Voulgarelis, M. Toll-like receptor-4 is up-regulated in hematopoietic progenitor cells and contributes to increased apoptosis in myelodysplastic syndromes. Clin. Cancer Res. 2007, 13, 1154–1160.
- Monlish, D.A.; Greenberg, Z.J.; Bhatt, S.T.; Leonard, K.M.; Romine, M.P.; Dong, Q.; Bendesky, L.; Duncavage, E.J.; Magee, J.A.; Schuettpelz, L.G. TLR2/6 signaling promotes the expansion of premalignant hematopoietic stem and progenitor cells in the NUP98-HOXD13 mouse model of MDS. Exp. Hematol. 2020, 88, 42–55.
- Sallman, D.A.; List, A. The central role of inflammatory signaling in the pathogenesis of myelodysplastic syndromes. Blood 2019, 133, 1039–1048.
- Basiorka, A.A.; McGraw, K.L.; Eksioglu, E.A.; Chen, X.; Johnson, J.; Zhang, L.; Zhang, Q.; Irvine, B.A.; Cluzeau, T.; Sallman, D.A.; et al. The NLRP3 inflammasome functions as a driver of the myelodysplastic syndrome phenotype. Blood 2016, 128, 2960–2975.
- Bewersdorf, J.P.; Zeidan, A.M. Transforming growth factor (TGF)-β pathway as a therapeutic target in lower risk myelodysplastic syndromes. Leukemia 2019, 33, 1303–1312.
- Zhou, L.; McMahon, C.; Bhagat, T.; Alencar, C.; Yu, Y.; Fazzari, M.; Sohal, D.; Heuck, C.; Gundabolu, K.; Ng, C.; et al. Reduced SMAD7 leads to overactivation of TGF-beta signaling in MDS that can be reversed by a specific inhibitor of TGF-beta receptor I kinase. Cancer Res. 2011, 71, 955–963.
- Smith, M.A.; Choudhary, G.S.; Pellagatti, A.; Choi, K.; Bolanos, L.C.; Bhagat, T.D.; Gordon-Mitchell, S.; Von Ahrens, D.; Pradhan, K.; Steeples, V.; et al. U2AF1 mutations induce oncogenic IRAK4 isoforms and activate innate immune pathways in myeloid malignancies. Nat. Cell Biol. 2019, 21, 640–650.
- Lee, S.C.; North, K.; Kim, E.; Jang, E.; Obeng, E.; Lu, S.X.; Liu, B.; Inoue, D.; Yoshimi, A.; Ki, M.; et al. Synthetic Lethal and Convergent Biological Effects of Cancer-Associated Spliceosomal Gene Mutations. Cancer Cell 2018, 34, 225–241.e8.
- Klune, J.R.; Dhupar, R.; Cardinal, J.; Billiar, T.R.; Tsung, A. HMGB1: Endogenous danger signaling. Mol. Med. 2008, 14, 476–484.
- Yuan, S.; Liu, Z.; Xu, Z.; Liu, J.; Zhang, J. High mobility group box 1 (HMGB1): A pivotal regulator of hematopoietic malignancies. J. Hematol. Oncol. 2020, 13, 91.
- Velegraki, M.; Papakonstanti, E.; Mavroudi, I.; Psyllaki, M.; Tsatsanis, C.; Oulas, A.; Iliopoulos, I.; Katonis, P.; Papadaki, H.A. Impaired clearance of apoptotic cells leads to HMGB1 release in the bone marrow of patients with myelodysplastic syndromes and induces TLR4-mediated cytokine production. Haematologica 2013, 98, 1206–1215.
- Apodaca-Chávez, E.; Demichelis-Gómez, R.; Rosas-López, A.; Mejía-Domínguez, N.R.; Galvan-López, I.; Addorosio, M.; Tracey, K.J.; Valdés-Ferrer, S.I. Circulating HMGB1 is increased in myelodysplastic syndrome but not in other bone marrow failure syndromes: Proof-of-concept cross-sectional study. Ther. Adv. Hematol. 2022, 13, 20406207221125990.
- Willingham, S.B.; Allen, I.C.; Bergstralh, D.T.; Brickey, W.J.; Huang, M.T.; Taxman, D.J.; Duncan, J.A.; Ting, J.P. NLRP3 (NALP3, Cryopyrin) facilitates in vivo caspase-1 activation, necrosis, and HMGB1 release via inflammasome-dependent and -independent pathways. J. Immunol. 2009, 183, 2008–2015.
- Kam, A.; Piryani, S.O.; McCall, C.M.; Park, H.S.; Rizzieri, D.A.; Doan, P.L. Targeting High Mobility Group Box-1 (HMGB1) Promotes Cell Death in Myelodysplastic Syndrome. Clin. Cancer Res. 2019, 25, 4155–4167.
- Kitagawa, M.; Saito, I.; Kuwata, T.; Yoshida, S.; Yamaguchi, S.; Takahashi, M.; Tanizawa, T.; Kamiyama, R.; Hirokawa, K. Overexpression of tumor necrosis factor (TNF)-alpha and interferon (IFN)-gamma by bone marrow cells from patients with myelodysplastic syndromes. Leukemia 1997, 11, 2049–2054.
- Gañán-Gómez, I.; Wei, Y.; Starczynowski, D.T.; Colla, S.; Yang, H.; Cabrero-Calvo, M.; Bohannan, Z.S.; Verma, A.; Steidl, U.; Garcia-Manero, G. Deregulation of innate immune and inflammatory signaling in myelodysplastic syndromes. Leukemia 2015, 29, 1458–1469.
- Shi, X.; Zheng, Y.; Xu, L.; Cao, C.; Dong, B.; Chen, X. The inflammatory cytokine profile of myelodysplastic syndromes: A meta-analysis. Medicine 2019, 98, e15844.
- D’Silva, S.; Rajadhyaksha, S.B.; Singh, M. Immune Dysregulation in MDS: The Role of Cytokines and Immune Cells. In Recent Developments in Myelodysplastic Syndromes; Fuchs, O., Ed.; IntechOpen: London, UK, 2019; Available online: https://www.intechopen.com/chapters/64447#B13 (accessed on 22 October 2022).
- Kordasti, S.Y.; Afzali, B.; Lim, Z.; Ingram, W.; Hayden, J.; Barber, L.; Matthews, K.; Chelliah, R.; Guinn, B.; Lombardi, G.; et al. IL-17-producing CD4(+) T cells, pro-inflammatory cytokines and apoptosis are increased in low risk myelodysplastic syndrome. Br. J. Haematol. 2009, 145, 64–72.
- Zoumbos, N.; Symeonidis, A.; Kourakli, A.; Katevas, P.; Matsoukas, P.; Perraki, M.; Georgoulias, V. Increased levels of soluble interleukin-2 receptors and tumor necrosis factor in serum of patients with myelodysplastic syndromes. Blood 1991, 77, 413–414.
- Lopes, M.R.; Traina, F.; Campos, P.; Pereira, J.K.; Machado-Neto, J.A.; Machado, H.; Gilli, S.C.; Saad, S.T.; Favaro, P. IL10 inversely correlates with the percentage of CD8⁺ cells in MDS patients. Leuk. Res. 2013, 37, 541–546.
- Pellagatti, A.; Cazzola, M.; Giagounidis, A.; Perry, J.; Malcovati, L.; Della Porta, M.G.; Jädersten, M.; Killick, S.; Verma, A.; Norbury, C.J.; et al. Deregulated gene expression pathways in myelodysplastic syndrome hematopoietic stem cells. Leukemia 2010, 24, 756–764.
- Michalopoulou, S.; Micheva, I.; Kouraklis-Symeonidis, A.; Kakagianni, T.; Symeonidis, A.; Zoumbos, N.C. Impaired clonogenic growth of myelodysplastic bone marrow progenitors in vitro is irrelevant to their apoptotic state. Leuk. Res. 2004, 28, 805–812.
- Deeg, H.J.; Beckham, C.; Loken, M.R.; Bryant, E.; Lesnikova, M.; Shulman, H.M.; Gooley, T. Negative regulators of hemopoiesis and stroma function in patients with myelodysplastic syndrome. Leuk. Lymphoma 2000, 37, 405–414.
- Gersuk, G.M.; Beckham, C.; Loken, M.R.; Kiener, P.; Anderson, J.E.; Farrand, A.; Troutt, A.B.; Ledbetter, J.A.; Deeg, H.J. A role for tumour necrosis factor-alpha, Fas and Fas-Ligand in marrow failure associated with myelodysplastic syndrome. Br. J. Haematol. 1998, 103, 176–188.
- Zeng, W.; Miyazato, A.; Chen, G.; Kajigaya, S.; Young, N.S.; Maciejewski, J.P. Interferon-gamma-induced gene expression in CD34 cells: Identification of pathologic cytokine-specific signature profiles. Blood 2006, 107, 167–175.
- Aggarwal, B.B. Signalling pathways of the TNF superfamily: A double-edged sword. Nat. Rev. Immunol. 2003, 3, 745–756.
- Sawanobori, M.; Yamaguchi, S.; Hasegawa, M.; Inoue, M.; Suzuki, K.; Kamiyama, R.; Hirokawa, K.; Kitagawa, M. Expression of TNF receptors and related signaling molecules in the bone marrow from patients with myelodysplastic syndromes. Leuk. Res. 2003, 27, 583–591.
- Tsimberidou, A.M.; Estey, E.; Wen, S.; Pierce, S.; Kantarjian, H.; Albitar, M.; Kurzrock, R. The prognostic significance of cytokine levels in newly diagnosed acute myeloid leukemia and high-risk myelodysplastic syndromes. Cancer 2008, 113, 1605–1613.
- Pardanani, A.; Finke, C.; Lasho, T.L.; Al-Kali, A.; Begna, K.H.; Hanson, C.A.; Tefferi, A. IPSS-independent prognostic value of plasma CXCL10, IL-7 and IL-6 levels in myelodysplastic syndromes. Leukemia 2012, 26, 693–699.
- Epperson, D.E.; Nakamura, R.; Saunthararajah, Y.; Melenhorst, J.; Barrett, A.J. Oligoclonal T cell expansion in myelodysplastic syndrome: Evidence for an autoimmune process. Leuk. Res. 2001, 25, 1075–1083.
- Molldrem, J.J.; Jiang, Y.Z.; Stetler-Stevenson, M.; Mavroudis, D.; Hensel, N.; Barrett, A.J. Haematological response of patients with myelodysplastic syndrome to antithymocyte globulin is associated with a loss of lymphocyte-mediated inhibition of CFU-GM and alterations in T-cell receptor Vbeta profiles. Br. J. Haematol. 1998, 102, 1314–1322.
- Epling-Burnette, P.K.; Painter, J.S.; Rollison, D.E.; Ku, E.; Vendron, D.; Widen, R.; Boulware, D.; Zou, J.X.; Bai, F.; List, A.F. Prevalence and clinical association of clonal T-cell expansions in Myelodysplastic Syndrome. Leukemia 2007, 21, 659–667.
- Melenhorst, J.J.; Eniafe, R.; Follmann, D.; Nakamura, R.; Kirby, M.; Barrett, A.J. Molecular and flow cytometric characterization of the CD4 and CD8 T-cell repertoire in patients with myelodysplastic syndrome. Br. J. Haematol. 2002, 119, 97–105.
- Kook, H.; Zeng, W.; Guibin, C.; Kirby, M.; Young, N.S.; Maciejewski, J.P. Increased cytotoxic T cells with effector phenotype in aplastic anemia and myelodysplasia. Exp. Hematol. 2001, 29, 1270–1277.
- Strioga, M.; Pasukoniene, V.; Characiejus, D. CD8+ CD28- and CD8+ CD57+ T cells and their role in health and disease. Immunology 2011, 134, 17–32.
- Ximeri, M.; Galanopoulos, A.; Klaus, M.; Parcharidou, A.; Giannikou, K.; Psyllaki, M.; Symeonidis, A.; Pappa, V.; Kartasis, Z.; Liapi, D.; et al. Effect of lenalidomide therapy on hematopoiesis of patients with myelodysplastic syndrome associated with chromosome 5q deletion. Haematologica 2010, 95, 406–414.
- Zheng, Z.; Qianqiao, Z.; Qi, H.; Feng, X.; Chunkang, C.; Xiao, L. In vitro deprivation of CD8(+)CD57(+)T cells promotes the malignant growth of bone marrow colony cells in patients with lower-risk myelodysplastic syndrome. Exp. Hematol. 2010, 38, 677–684.
- Sloand, E.M.; Rezvani, K. The role of the immune system in myelodysplasia: Implications for therapy. Semin. Hematol. 2008, 45, 39–48.
- Sloand, E.M.; Melenhorst, J.J.; Tucker, Z.C.; Pfannes, L.; Brenchley, J.M.; Yong, A.; Visconte, V.; Wu, C.; Gostick, E.; Scheinberg, P.; et al. T-cell immune responses to Wilms tumor 1 protein in myelodysplasia responsive to immunosuppressive therapy. Blood 2011, 117, 2691–2699.
- Gang, A.O.; Frøsig, T.M.; Brimnes, M.K.; Lyngaa, R.; Treppendahl, M.B.; Grønbæk, K.; Dufva, I.H.; Straten, P.T.; Hadrup, S.R. 5-Azacytidine treatment sensitizes tumor cells to T-cell mediated cytotoxicity and modulates NK cells in patients with myeloid malignancies. Blood Cancer J. 2014, 4, e197.
- Wong, K.K.; Hassan, R.; Yaacob, N.S. Hypomethylating Agents and Immunotherapy: Therapeutic Synergism in Acute Myeloid Leukemia and Myelodysplastic Syndromes. Front. Oncol. 2021, 11, 624742.
- Symeonidis, A.; Kourakli; Katevas, P.; Perraki, M.; Tiniakou, M.; Matsouka, P.; Georgoulias, V.; Zoumbos, N. Immune function parameters at diagnosis in patients with myelodysplastic syndromes: Correlation with the FAB classification and prognosis. Eur. J. Haematol. 1991, 47, 277–281.
- Zou, J.X.; Rollison, D.E.; Boulware, D.; Chen, D.T.; Sloand, E.M.; Pfannes, L.V.; Goronzy, J.J.; Bai, F.; Painter, J.S.; Wei, S.; et al. Altered naive and memory CD4+ T-cell homeostasis and immunosenescence characterize younger patients with myelodysplastic syndrome. Leukemia 2009, 23, 1288–1296.
- Sugimori, C.; List, A.F.; Epling-Burnette, P.K. Immune dysregulation in myelodysplastic syndrome. Hematol. Rep. 2010, 2, e1.
- Kotsianidis, I.; Bouchliou, I.; Nakou, E.; Spanoudakis, E.; Margaritis, D.; Christophoridou, A.V.; Anastasiades, A.; Tsigalou, C.; Bourikas, G.; Karadimitris, A.; et al. Kinetics, function and bone marrow trafficking of CD4+CD25+FOXP3+ regulatory T cells in myelodysplastic syndromes (MDS). Leukemia 2009, 23, 510–518.
- Kordasti, S.Y.; Ingram, W.; Hayden, J.; Darling, D.; Barber, L.; Afzali, B.; Lombardi, G.; Wlodarski, M.W.; Maciejewski, J.P.; Farzaneh, F.; et al. CD4+CD25high Foxp3+ regulatory T cells in myelodysplastic syndrome (MDS). Blood 2007, 110, 847–850.
- Epling-Burnette, P.K.; Bai, F.; Painter, J.S.; Rollison, D.E.; Salih, H.R.; Krusch, M.; Zou, J.; Ku, E.; Zhong, B.; Boulware, D.; et al. Reduced natural killer (NK) function associated with high-risk myelodysplastic syndrome (MDS) and reduced expression of activating NK receptors. Blood 2007, 109, 4816–4824.
- Symeonidis, A.; Zoumbos, N. Defective autologous and allogeneic mixed lymphocyte reaction in patients with primary myelodysplastic syndromes. Leuk. Res. 1991, 15, 29.
- Jiang, Y.; Li, Y.; Zhu, B. T-cell exhaustion in the tumor microenvironment. Cell Death Dis. 2015, 6, e1792.
- Hofmeyer, K.A.; Jeon, H.; Zang, X. The PD-1/PD-L1 (B7-H1) pathway in chronic infection-induced cytotoxic T lymphocyte exhaustion. J. Biomed. Biotechnol. 2011, 2011, 451694.
- Haroun, F.; Solola, S.A.; Nassereddine, S.; Tabbara, I. PD-1 signaling and inhibition in AML and MDS. Ann. Hematol. 2017, 96, 1441–1448.
- Yang, H.; Bueso-Ramos, C.; DiNardo, C.; Estecio, M.R.; Davanlou, M.; Geng, Q.R.; Fang, Z.; Nguyen, M.; Pierce, S.; Wei, Y.; et al. Expression of PD-L1, PD-L2, PD-1 and CTLA4 in myelodysplastic syndromes is enhanced by treatment with hypomethylating agents. Leukemia 2014, 28, 1280–1288.
- Wang, X.; Yang, L.; Huang, F.; Zhang, Q.; Liu, S.; Ma, L.; You, Z. Inflammatory cytokines IL-17 and TNF-α up-regulate PD-L1 expression in human prostate and colon cancer cells. Immunol. Lett. 2017, 184, 7–14.
- Garcia-Diaz, A.; Shin, D.S.; Moreno, B.H.; Saco, J.; Escuin-Ordinas, H.; Rodriguez, G.A.; Zaretsky, J.M.; Sun, L.; Hugo, W.; Wang, X.; et al. Interferon Receptor Signaling Pathways Regulating PD-L1 and PD-L2 Expression. Cell Rep. 2017, 19, 1189–1201.
- Cheng, P.; Eksioglu, E.A.; Chen, X.; Kandell, W.; Le Trinh, T.; Cen, L.; Qi, J.; Sallman, D.A.; Zhang, Y.; Tu, N.; et al. S100A9-induced overexpression of PD-1/PD-L1 contributes to ineffective hematopoiesis in myelodysplastic syndromes. Leukemia 2019, 33, 2034–2046.
- Ferrari, V.; Tarke, A.; Fields, H.; Tanaka, T.N.; Searles, S.; Zanetti, M. Tumor-specific T cell-mediated upregulation of PD-L1 in myelodysplastic syndrome cells does not affect T-cell killing. Front. Oncol. 2022, 12, 915629.
- Pang, W.W.; Pluvinage, J.V.; Price, E.A.; Sridhar, K.; Arber, D.A.; Greenberg, P.L.; Schrier, S.L.; Park, C.Y.; Weissman, I.L. Hematopoietic stem cell and progenitor cell mechanisms in myelodysplastic syndromes. Proc. Natl. Acad. Sci. USA 2013, 110, 3011–3016.
- Han, Y.; Wang, H.; Shao, Z. Monocyte-Derived Macrophages Are Impaired in Myelodysplastic Syndrome. J. Immunol. Res. 2016, 2016, 5479013.
- Zhang, G.; Yang, L.; Han, Y.; Niu, H.; Yan, L.; Shao, Z.; Xing, L.; Wang, H. Abnormal Macrophage Polarization in Patients with Myelodysplastic Syndrome. Mediators Inflamm. 2021, 2021, 9913382.
- Liu, J.; Geng, X.; Hou, J.; Wu, G. New insights into M1/M2 macrophages: Key modulators in cancer progression. Cancer Cell Int. 2021, 21, 389.
- Sica, A.; Mantovani, A. Macrophage plasticity and polarization: In vivo veritas. J. Clin. Investig. 2012, 122, 787–795.
- Al-Matary, Y.S.; Botezatu, L.; Opalka, B.; Hönes, J.M.; Lams, R.F.; Thivakaran, A.; Schütte, J.; Köster, R.; Lennartz, K.; Schroeder, T.; et al. Acute myeloid leukemia cells polarize macrophages towards a leukemia supporting state in a Growth factor independence 1 dependent manner. Haematologica 2016, 101, 1216–1227.
- Petty, A.J.; Yang, Y. Tumor-Associated Macrophages in Hematologic Malignancies: New Insights and Targeted Therapies. Cells 2019, 8, 1526.
- Yang, X.; Feng, W.; Wang, R.; Yang, F.; Wang, L.; Chen, S.; Ru, Y.; Cheng, T.; Zheng, G. Repolarizing heterogeneous leukemia-associated macrophages with more M1 characteristics eliminates their pro-leukemic effects. Oncoimmunology 2017, 7, e1412910.
- Kiladjian, J.J.; Bourgeois, E.; Lobe, I.; Braun, T.; Visentin, G.; Bourhis, J.H.; Fenaux, P.; Chouaib, S.; Caignard, A. Cytolytic function and survival of natural killer cells are severely altered in myelodysplastic syndromes. Leukemia 2006, 20, 463–470.
- Carlsten, M.; Baumann, B.C.; Simonsson, M.; Jädersten, M.; Forsblom, A.M.; Hammarstedt, C.; Bryceson, Y.T.; Ljunggren, H.G.; Hellström-Lindberg, E.; Malmberg, K.J. Reduced DNAM-1 expression on bone marrow NK cells associated with impaired killing of CD34+ blasts in myelodysplastic syndrome. Leukemia 2010, 24, 1607–1616.
- Hejazi, M.; Manser, A.R.; Fröbel, J.; Kündgen, A.; Zhao, X.; Schönberg, K.; Germing, U.; Haas, R.; Gattermann, N.; Uhrberg, M. Impaired cytotoxicity associated with defective natural killer cell differentiation in myelodysplastic syndromes. Haematologica 2015, 100, 643–652.
- Geyh, S.; Oz, S.; Cadeddu, R.P.; Fröbel, J.; Brückner, B.; Kündgen, A.; Fenk, R.; Bruns, I.; Zilkens, C.; Hermsen, D.; et al. Insufficient stromal support in MDS results from molecular and functional deficits of mesenchymal stromal cells. Leukemia 2013, 27, 1841–1851.
- Miller, J.S.; McCullar, V. Human natural killer cells with polyclonal lectin and immunoglobulinlike receptors develop from single hematopoietic stem cells with preferential expression of NKG2A and KIR2DL2/L3/S2. Blood 2001, 98, 705–713.
- Miura, I.; Kobayashi, Y.; Takahashi, N.; Saitoh, K.; Miura, A.B. Involvement of natural killer cells in patients with myelodysplastic syndrome carrying monosomy 7 revealed by the application of fluorescence in situ hybridization to cells collected by means of fluorescence-activated cell sorting. Br. J. Haematol. 2000, 110, 876–879.
- Carlsten, M.; Järås, M. Natural Killer Cells in Myeloid Malignancies: Immune Surveillance, NK Cell Dysfunction, and Pharmacological Opportunities to Bolster the Endogenous NK Cells. Front. Immunol. 2019, 10, 2357.
- Dickinson, R.E.; Milne, P.; Jardine, L.; Zandi, S.; Swierczek, S.I.; McGovern, N.; Cookson, S.; Ferozepurwalla, Z.; Langridge, A.; Pagan, S.; et al. The evolution of cellular deficiency in GATA2 mutation. Blood 2014, 123, 863–874.
- Tesi, B.; Davidsson, J.; Voss, M.; Rahikkala, E.; Holmes, T.D.; Chiang, S.; Komulainen-Ebrahim, J.; Gorcenco, S.; Rundberg Nilsson, A.; Ripperger, T.; et al. Gain-of-function SAMD9L mutations cause a syndrome of cytopenia, immunodeficiency, MDS, and neurological symptoms. Blood 2017, 129, 2266–2279.
- Ma, L.; Delforge, M.; van Duppen, V.; Verhoef, G.; Emanuel, B.; Boogaerts, M.; Hagemeijer, A.; Vandenberghe, P. Circulating myeloid and lymphoid precursor dendritic cells are clonally involved in myelodysplastic syndromes. Leukemia 2004, 18, 1451–1456.
- Micheva, I.; Thanopoulou, E.; Michalopoulou, S.; Kakagianni, T.; Kouraklis-Symeonidis, A.; Symeonidis, A.; Zoumbos, N. Impaired generation of bone marrow CD34-derived dendritic cells with low peripheral blood subsets in patients with myelodysplastic syndrome. Br. J. Haematol. 2004, 126, 806–814.
- Micheva, I.; Thanopoulou, E.; Michalopoulou, S.; Karakantza, M.; Kouraklis-Symeonidis, A.; Mouzaki, A.; Zoumbos, N. Defective tumor necrosis factor alpha-induced maturation of monocyte-derived dendritic cells in patients with myelodysplastic syndromes. Clin. Immunol. 2004, 113, 310–317.
- Matteo Rigolin, G.; Howard, J.; Buggins, A.; Sneddon, C.; Castoldi, G.; Hirst, W.J.; Mufti, G.J. Phenotypic and functional characteristics of monocyte-derived dendritic cells from patients with myelodysplastic syndromes. Br. J. Haematol. 1999, 107, 844–850.
- Ma, L.; Ceuppens, J.; Kasran, A.; Delforge, M.; Boogaerts, M.; Vandenberghe, P. Immature and mature monocyte-derived dendritic cells in myelodysplastic syndromes of subtypes refractory anemia or refractory anemia with ringed sideroblasts display an altered cytokine profile. Leuk. Res. 2007, 31, 1373–1382.
- Van Leeuwen-Kerkhoff, N.; Westers, T.M.; Poddighe, P.J.; Povoleri, G.; Timms, J.A.; Kordasti, S.; De Gruijl, T.D.; Van de Loosdrecht, A.A. Reduced frequencies and functional impairment of dendritic cell subsets and non-classical monocytes in myelodysplastic syndromes. Haematologica 2022, 107, 655–667.
- Gabrilovich, D.I.; Nagaraj, S. Myeloid-derived suppressor cells as regulators of the immune system. Nat. Rev. Immunol. 2009, 9, 162–174.
- Marvel, D.; Gabrilovich, D.I. Myeloid-derived suppressor cells in the tumor microenvironment: Expect the unexpected. J. Clin. Investig. 2015, 125, 3356–3364.
- Gabrilovich, D.I.; Ostrand-Rosenberg, S.; Bronte, V. Coordinated regulation of myeloid cells by tumours. Nat. Rev. Immunol. 2012, 12, 253–268.
- Velegraki, M.; Stiff, A.; Papadaki, H.A.; Li, Z. Myeloid-Derived Suppressor Cells: New Insights into the Pathogenesis and Therapy of MDS. J. Clin. Med. 2022, 11, 4908.
- Kittang, A.O.; Kordasti, S.; Sand, K.E.; Costantini, B.; Kramer, A.M.; Perezabellan, P.; Seidl, T.; Rye, K.P.; Hagen, K.M.; Kulasekararaj, A. Expansion of myeloid derived suppressor cells correlates with number of T regulatory cells and disease progression in myelodysplastic syndrome. Oncoimmunology 2015, 5, e1062208.
- Chen, X.; Eksioglu, E.A.; Zhou, J.; Zhang, L.; Djeu, J.; Fortenbery, N.; Epling-Burnette, P.; Van Bijnen, S.; Dolstra, H.; Cannon, J.; et al. Induction of myelodysplasia by myeloid-derived suppressor cells. J. Clin. Investig. 2013, 123, 4595–4611.
- Schroeter, A.; Roesel, M.J.; Matsunaga, T.; Xiao, Y.; Zhou, H.; Tullius, S.G. Aging Affects the Role of Myeloid-Derived Suppressor Cells in Alloimmunity. Front. Immunol. 2022, 13, 917972.
- Flores, R.R.; Clauson, C.L.; Cho, J.; Lee, B.C.; McGowan, S.J.; Baker, D.J.; Niedernhofer, L.J.; Robbins, P.D. Expansion of myeloid-derived suppressor cells with aging in the bone marrow of mice through a NF-κB-dependent mechanism. Aging Cell 2017, 16, 480–487.
- Sinha, P.; Okoro, C.; Foell, D.; Freeze, H.H.; Ostrand-Rosenberg, S.; Srikrishna, G. Proinflammatory S100 proteins regulate the accumulation of myeloid-derived suppressor cells. J. Immunol. 2008, 181, 4666–4675.
- Qi, X.; Jiang, H.; Liu, P.; Xie, N.; Fu, R.; Wang, H.; Liu, C.; Zhang, T.; Wang, H.; Shao, Z. Increased myeloid-derived suppressor cells in patients with myelodysplastic syndromes suppress CD8+ T lymphocyte function through the STAT3-ARG1 pathway. Leuk. Lymphoma 2021, 62, 218–223.
- Tao, J.; Han, D.; Gao, S.; Zhang, W.; Yu, H.; Liu, P.; Fu, R.; Li, L.; Shao, Z. CD8+ T cells exhaustion induced by myeloid-derived suppressor cells in myelodysplastic syndromes patients might be through TIM3/Gal-9 pathway. J. Cell. Mol. Med. 2020, 24, 1046–1058.
- Yu, S.; Ren, X.; Meng, F.; Guo, X.; Tao, J.; Zhang, W.; Liu, Z.; Fu, R.; Li, L. TIM3/CEACAM1 pathway involves in myeloid-derived suppressor cells induced CD8+ T cells exhaustion and bone marrow inflammatory microenvironment in myelodysplastic syndrome. Immunology, 2022; ahead of print.
- Winter, S.; Shoaie, S.; Kordasti, S.; Platzbecker, U. Integrating the “Immunome” in the Stratification of Myelodysplastic Syndromes and Future Clinical Trial Design. J. Clin. Oncol. 2020, 38, 1723–1735.
- Zhou, S.; Greenberger, J.S.; Epperly, M.W.; Goff, J.P.; Adler, C.; Leboff, M.S.; Glowacki, J. Age-related intrinsic changes in human bone-marrow-derived mesenchymal stem cells and their differentiation to osteoblasts. Aging cell 2008, 7, 335–343.
- Blau, O.; Baldus, C.D.; Hofmann, W.K.; Thiel, G.; Nolte, F.; Burmeister, T.; Türkmen, S.; Benlasfer, O.; Schümann, E.; Sindram, A.; et al. Mesenchymal stromal cells of myelodysplastic syndrome and acute myeloid leukemia patients have distinct genetic abnormalities compared with leukemic blasts. Blood 2011, 118, 5583–5592.
- Bhagat, T.D.; Chen, S.; Bartenstein, M.; Barlowe, A.T.; Von Ahrens, D.; Choudhary, G.S.; Tivnan, P.; Amin, E.; Marcondes, A.M.; Sanders, M.A.; et al. Epigenetically Aberrant Stroma in MDS Propagates Disease via Wnt/β-Catenin Activation. Cancer Res. 2017, 77, 4846–4857.
- Ping, Z.; Chen, S.; Hermans, S.; Kenswil, K.; Feyen, J.; van Dijk, C.; Bindels, E.; Mylona, A.M.; Adisty, N.M.; Hoogenboezem, R.M.; et al. Activation of NF-κB driven inflammatory programs in mesenchymal elements attenuates hematopoiesis in low-risk myelodysplastic syndromes. Leukemia 2019, 33, 536–541.
- Zambetti, N.A.; Ping, Z.; Chen, S.; Kenswil, K.; Mylona, M.A.; Sanders, M.A.; Hoogenboezem, R.M.; Bindels, E.; Adisty, M.N.; Van Strien, P.; et al. Mesenchymal Inflammation Drives Genotoxic Stress in Hematopoietic Stem Cells and Predicts Disease Evolution in Human Pre-leukemia. Cell Stem Cell 2016, 19, 613–627.
- Wang, Z.; Tang, X.; Xu, W.; Cao, Z.; Sun, L.; Li, W.; Li, Q.; Zou, P.; Zhao, Z. The different immunoregulatory functions on dendritic cells between mesenchymal stem cells derived from bone marrow of patients with low-risk or high-risk myelodysplastic syndromes. PLoS ONE 2013, 8, e57470.
- Sarhan, D.; Wang, J.; Sunil Arvindam, U.; Hallstrom, C.; Verneris, M.R.; Grzywacz, B.; Warlick, E.; Blazar, B.R.; Miller, J.S. Mesenchymal stromal cells shape the MDS microenvironment by inducing suppressive monocytes that dampen NK cell function. JCI Insight 2020, 5, e130155.
This entry is offline, you can click here to edit this entry!