Nitrogen (N) plays a key role in the growth of agricultural crops, efficient and precise tools for diagnosis of N status is key to improving crop productivity and reducing environmental pollution. Recent development of non-destructive optical techniques, such as spectroscopy and machine vision technologies, have laid a good foundation for real-time monitoring and precise management of crop N status. We mainly focused on the contribution of spectral and machine vision technology to the accurate diagnosis of crop N status from three aspects: system selection, data processing, and estimation methods. In order to provide useful information for readers.
- crops
- nitrogen status
- diagnosis
- spectroscopy
- vision
Spectral and machine vision technology have become the main choices for crop N status diagnosis. As an optical sensor, it enables rapid and periodic assessment of crop N status [1]. As shown in Figure 1, for the spectral technology, we can use it to obtain the spectral information of crop leaves and canopy, respectively, and then use the data pre-processing method to obtain the characteristic bands. For machine vision technology, we can use it to obtain the image information of crop leaves and canopy, and then obtain the feature information through image segmentation and feature extraction. Among them, the spectral information or image information of canopy can not only reflect the N status of crop canopy, but also reflect the N status of the whole plant. Then the destructive methods (such as the Kjeldahl method) are used to obtain the actual N status of the crop. Based on the correlation analysis between spectral feature band or image feature information and crop actual N status, the estimation model of crop leaf, canopy, and whole plant N status are established. However, the quality of the N status estimation model is often affected by the external environment factors, such as external light, soil background, etc.
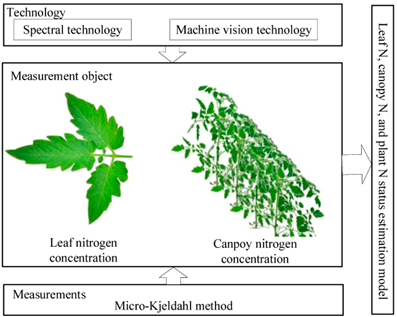
Figure 1. Basic principles of N non-destructive diagnosis.
1. Spectral Technology
Spectral reflectance is a promising and convenient index for continuous sampling and narrow wave selection, which can sensitively reflect the specific physiological variables of crops [2][3]. Within the range of 350–1300 nm, the accurate measurement of leaf spectral reflectance depends on the interaction between light and crops and its influence on the spectral characteristics of green leaves, which enable accurate quantification of the crop N status [4]. Among them, we usually use hand-held or near ground spectral sensors to collect the crop leaf spectral information and unmanned aerial vehicle (UAV) or remote sensing technology to collect the spectral information of large-scale crops canopy in the visible and near-infrared spectral band range (Figure 2). Then, the data pre-processing method is used to select the characteristic band, and the appropriate estimation method is selected to construct the N status estimation model.
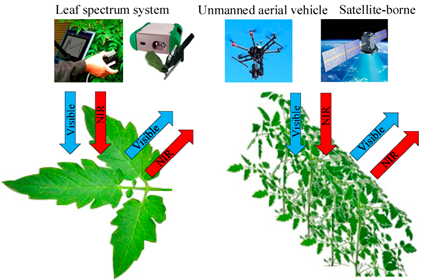
Figure 2. Basic principles of spectral technology.
1.1. Application of Spectral System Selection to the Diagnosis of Crop N Status
Recently, a number of remote sensing systems have been proposed for the assessment of crop N status, such as the compact airborne spectrographic imager system, the hyperspectral LiDAR(HSL) [4][5][6], remote sensing with hyperspectral system [7], the QuickBird satellite with multi-spectral system [8], and others [9][10][11]. Hyperspectral sensors describe the reflectance of crop canopy in more information than multispectral sensors [12], which mainly includes two forms: non-imaging and imaging [13][14]. The non-imaging measurement can only obtain a small amount of spectral information of sampling points, and it cannot achieve the rapid and efficient information acquisition of large-area crops [14]. The imaging measurement such as satellite-borne hyperspectral imaging technology can obtain a wide range of spectral information, but also has some problems, such as long revisit period, limited breadth, low spatial resolution (generally less than 30 m), etc. [15]. Airborne hyperspectral imaging technology has the characteristics of mobility and flexibility. However, it is subject to air traffic control and requires high light conditions [16]. Consequently, the data collection cost based on this method is high, and its popularization and application in precision agriculture are limited. Compared with the aforementioned satellite-borne hyperspectral imaging technology and airborne hyperspectral imaging technology, UAV-based remote sensing measurement technology has the characteristics of low flight control, efficient use, flexible, and low operating cost [17], which can offer particular advantages with a high spatial resolution, an appropriate revisit time, and a spectral resolution adjusted for a specific task [12][18][19]. Besides, the combination of other methods and spectral technology such as the combination of spectroscopy and SPAD [20], the combination of Ground-Based Hyperspectral and UAV-Based Multispectral Imagery for crop N status assessment in rice [12], and the combination of physical optics approach and UAV-based hyperspectral imagery has great potential for assessing canopy N density (CND) in winter wheat [21].
1.2. Application of Spectral Data Processing to the Diagnosis of Crop N Status
The data obtained by spectral technology have collinearity, high redundancy, sometimes noise and spectral autocorrelation [12], the estimation ability, and calculation efficiency of the model can be reduced [22]. Thus, the commonly used spectral preprocessing methods are multiplicative scatter correction (MSC), Savitzky–Golay smoothing (SGS), first-derivative (1-Der), second-derivative (2-Der), standard normal variable (SNV), etc. [13]. Besides, there are other methods to extract the spectral information of the target, including continuum removal methods, hyperspectral vegetation indices, multivariable statistical methods, and differential technique [23][24]. Therefore, it is of great significance to select the most critical spectral bands for crop N status estimation. At present, there are many spectral indices or vegetation indices for diagnosis of crop N status [25][26]. Therefore, we selected core and novel indexes to summarize.
The diagnosis of crop N status at leaf scales is the basis of crop population N status diagnosis. Some studies reported that there is a good correlation between crop N status and leaf spectral data [27][28][29][30][31][32], and different spectral indices are suitable for different crops and their growing stages [33][34]. Several spectral indices (SIs) such as the ratio index (RI), normalized difference spectral index (NDSI) [35][36][37][38][39][40][41], and others [42][43][44][45][46][47] are used for leaf N content (LNC) estimation based on leaf reflectance. However, most of these indices focus on two or three bands only. Because different crops have different sensitive bands in different growth stages of N diagnosis, which has certain limitations in the realization of comprehensive and accurate diagnosis of crop N status. Therefore, it is difficult to establish a unified index to evaluate LNC in the different growth periods, varieties, and sites. However, the optimum multiple narrow band reflectance (OMNBR) models was proposed by [25] significantly increase the accuracy for estimating the LNC (R2 = 0.67 0.71) and plant N concentration (PNC) (R2 = 0.57 0.78) with six bands. Except for that mentioned above, some NDVI-like indices derived from different diagnostic wavelengths have been proposed for monitoring N status [48][49][50][51][52]. However, due to the interference of soil background, NDVI values will change and reach saturation at moderate-to-high vegetation densities. Some indices such as the leaf N content spectral indices (LNCSI) [53], which has a good effect on the quantitative inversion of LNC in wheat leaves. However, the latter only evaluated the N content of wheat leaves at flag leaf stage and flowering stage, but did not consider other growth stages. The CIred-edge [54] can provide a more accurate and stable estimation of the LNC in maize, which can accurately reflect to the dynamic changes of leaf N status during different growth stages of maize. Besides, for the diagnosis of leaf N status in different varieties, sites, and phenological characteristics, a new index named dual peak area normalized difference (NDDA) was proposed by Feng et al. [29], which has the advantages of good stability and strong monitoring ability for this problem. Therefore, there are many challenges and problems in the diagnosis of leaf N status on different crops and growth stages.
The diagnosis of crop N status at canopy level is an effective method for accurate diagnosis of crop population N status. The spectral characteristics of the canopy can represent the growth information of vegetation canopy [55]. However, leaf reflectance is relatively high in the near-infrared regions due to the multi scattering and low chlorophyll absorption and relatively low in the visible wavelengths due to the high chlorophyll absorption [56] Monitoring leaf nitrogen status with hyperspectral reflectance in wheat]. To address this issue, some chlorophyll red-edge and plant N spectral indices, such as SDr/SDb, DIDA, and RSI(D740, D522) for assessing canopy N status have been developed [15][57][58]. Besides, canopy chlorophyll content index (CCCI) based on the normalized difference red edge (NDRE) and NDVI was developed [59]. When the canopy cover is above 30%, as an effective indicator, NDRE can be used to estimate crop N status. However, due to the influence of leaf characteristics, canopy structure, atmospheric conditions, and soil background, the obtained canopy spectra are mixed spectral information [51].
First, the vegetation index is effective in reducing the influence of different backgrounds and can improve the reflectance sensitivity to crop N status. For example, the SAVI can minimize the soil background interference through a soil regulating parameter L, which is widely used in the measured and simulated data. Meanwhile, it has been proved that it can effectively decrease the impact of soil background and correct normalized difference spectral index (NDSI) for better diagnostic performance [60]. However, SAVI must know the density distribution or coverage percentage of the underlying vegetation in advance, so it is only suitable for extracting the vegetation information of the underlying vegetation in a small area with small vegetation coverage change. Besides, a multi-angular vegetation index (MAVISR), two red-edge-based indices, and red edge chlorophyll index (CIRE) have also proved to have a good performance in crop canopy N status diagnostics [36][61].
Second, regarding water absorption of fresh leaves, a water removal technology was proposed [62], whose main idea is to remove the influence of water absorption and improve the diagnosis of N status [63][64] and N-P ratio [65]. By water removal technology and combining continuous wavelet analysis (CWA) in the SWIR, a better effect can be achieved. Additionally, the Datt index, Medium Resolution Imaging Spectrometer (MERIS) terrestrial chlorophyll indices (MTCI), a water resistance N index (WRNI) was also proposed to increase the accuracy of the LNC estimation model by minimizing the influence of water stress [66].
Third, regarding the influence of canopy structure change, using ratio vegetation index (RVI) can slow down the expansion of saturation under dense canopies, which is still sensitive to the change of vegetation state after canopy closure [67]. However, the vegetation coverage affects RVI. When the vegetation coverage is high, RVI is very sensitive to vegetation. When the vegetation coverage is less than 50%, the sensitivity decreases significantly. Therefore, Li et al. [68] conducted a study on rice of different years, varieties, and growth stages, and found that RVI could be used to estimate the N status of over fertilized winter wheat before heading. Meanwhile, the RVI is affected by atmospheric conditions, which greatly reduces the sensitivity of vegetation detection, so atmospheric correction or reflectance calculation of RVI is needed before calculation.
Finally, the relationship between the index and N status is often inconsistent, due to the change of canopy background and growth status in different stages of crop. GNDVI has been proposed as the most suitable spectral index to estimate the leaf N content in each growth stage of the corn, while SAVI performs better at the beginning of the season [69]. However, the canopy structure of different crops is different. Therefore, a different vegetation index or spectral index should be proposed for different crops in the later research to estimate the N status of crops.
Whether it is leaf or canopy scale, the increase of computation and the massive data characteristics easily cause complex problems such as overfitting, which affects the estimation of the model. There are some methods to obtain the most relevant sensitive bands from high-dimensional data samples. For instance, the combination of principal component analysis (PCA) with a genetic algorithm [70], the partial least squares regression (PLSR) [71], and the Gaussian process regression (GPR) [72] can reduce the dimensionality of the original data, thereby decreasing redundant information in the data and obviously increasing the data validity.
1.3. Application of Estimation Methods Based on Spectral Data to Crop N Status Diagnosis
Although the accuracy of classification or regression can be significantly enhanced by increasing the number of wavelengths in the calculation process [5], the correct use of estimation methods is very important to improve the accuracy of crop N status diagnosis. Most studies used linear or multiple nonlinear regression models to construct the relationship between the spectral index and N status [73][74]. However, when the data contains a large number of characteristic dimensions, the correlation between these spectral indices and leaf N status are usually not very high, the estimation model is prone to overfitting and losing the accuracy of estimation. To solve the problems of multicollinearity and overfitting [10], the PLSR method can decrease extensive collinear variables to a little non-correlated factor and reduce the influence of background effects on model accuracy [75][76][77]. Meanwhile, PLSR usually stresses contiguous data, full-spectrum and efforts to identify and subset related spectral features are always ignored. The genetic algorithm with PLSR can realize the latter goals, but studies using this method are far fewer than that using PLSR alone [78]. Furthermore, based on the SAIL canopy model and the N-based PROSPECT model, an N-PROSAIL model was established and used for estimating crop N content both at canopy and leaf scales and which was proved to have great potential for crop N status diagnosis in wheat [79].
Machine learning in crop N status diagnosis was reported in many recent studies [14][80][81]. For example, the artificial neural network (ANN), the error backpropagation artificial neural network (BP-ANN) [10], the support vector machine (SVM) [82][83], SVM-PLS [84], and wavelet transform [85]. After comparing the stepwise multiple linear regression (SMLR) and ANN models of mangroves, it was found that the use of the ANN method for N status estimation produces satisfactory results. ANNs also has many advantages in nonlinear modeling, because of its robustness and estimation ability under incomplete or noisy data [86]. However, there are some drawbacks such as complex input–response relationships in the use of ANNs for nonlinear modeling, which may not conform to physical or biological models. The support vector regression (SVR) based radial basis function (RBF) kernel is better than the SMLR in canopy N content (CNC) estimation [81]. However, compared with general regression neural networks, SVR, and band ratio polynomial regression, the GPR has higher estimation accuracy [87]. As discussed by Verrelst et al. [88], GPR is more flexible for choosing kernel type than SVM and easier to train than the neural network [89]. Furthermore, some studies have demonstrated that the combination of other methods based on SVM has a higher advantage in the assessment of N status, such as least squares support vector machines (LS-SVM) and Savitzky–Golay support vector machines (SG-SVM) [13]. With the development of deep learning, it has been widely used in the field of agricultural research. However, there are few applications in spectral data processing and estimation. Deep learning can automatically combine and transform the low-order features of input data to get high-order features, which saves the manual work of constructing high-order features. Therefore, the feature extraction process based on deep learning is more accurate and faster, and we can use deep learning to extract features and establish models in order to achieve a better model estimation effect.
In summary, although there are many measurement systems, data processing methods, and modeling algorithms mentioned above in the field of crop N status diagnosis, there are huge differences in the selection of spectral system, data pre-processing methods, and estimation methods due to the complex and variable crop growth environment and the influence of many factors. Therefore, it is difficult to find a unified measurement system, data processing method, and modeling algorithm to deal with the non-destructive diagnosis task of different agricultural scenes for the study of crop N status. Therefore, the future research should be devoted to make up for this problem.
2. Machine Vision Technology
The machine vision technology can visually evaluate the N status by the shape, color, and texture of crops, and determine the N stress of seedlings by building a machine vision system to extract the object area of canopy [90]. Color image processing has been successfully applied to the diagnosis of crop N status and growth analysis [91][92][93], which can use digital cameras to get images in the visible light range that reflect the characteristics of the crop or soil background based on the R, G, and B spectral information (Figure 3). Then we do further segmentation and feature extraction of the image, and select the appropriate estimation method to construct the N status estimation model. If the segmentation effect is not good, the original R, G, and B bands can also be transformed into normalized color components, hue-saturation-intensity (HSI) space to improve the estimation accuracy in vegetation analysis [94].
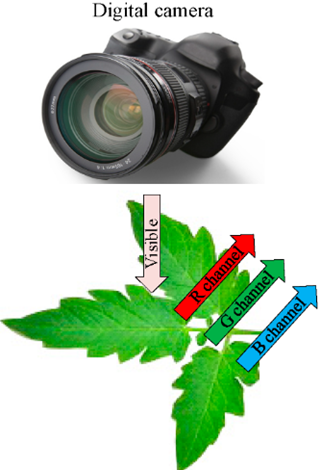
Figure 3. Basic principles of the machine vision technology.
2.1. Application of Machine Vision System Selection to the Diagnosis of Crop N Status
A digital camera is one of the main components of most machine vision systems, which is also used as a remote evaluation tool to monitor crop growth and N status by capturing crop images [49][95]. Moreover, hyperspectral and airborne miniaturized multispectral cameras have also been used to extract spectral and 3D features [96]. An artificial vision system (AVS) (HP Scanjet 3800) was developed for interpretation and analysis of images, which can acquire high quality images and estimate nutrient deficiency at different growth stages of crop, especially at the beginning of growth period, and may be helpful for early diagnosis and correction in the same growth cycle. However, it cannot move flexibly. Tewari et al. [97] designed a manually operated four-wheel test trolley, which can flexibly acquire an outdoor color image feature of the crop under controlled illumination to estimate crop N status successfully in the field. Furthermore, some studies have proved that the combination of multiple diagnostic methods based on machine vision has a higher advantage in the assessment of N status, such as the combination of SPAD and machine vision [98][99] and the combination of spectroscopy and machine vision [100][101].
2.2. Application of Visual Data Processing to the Diagnosis of Crop N Status
The effective processing of visual data plays an important role in avoiding noise interference in the natural environment, such as soil, weeds, stones, dried, and semi-dried leaves in the image. One of the important steps of the image processing is to segment out various necessary regions and take it as the region of interest for decision-making of the crop N status [98][102]. There are some segmentation algorithms for automatic image segmentation, such as spatially varying mean intensity values, mathematical morphology, nonlinear spatial filtering, YCbCr color and grayscale morphology, which can be used to separate the plant from the background [49]. In the canopy image segmentation, the magnitude and distribution of the difference value can be obtained by subtracting the red channel value from the green channel, and which can be set for segmentation, and then the relationship between the characteristic parameters and N content can be established [102]. At present, there are still many problems in image processing. On the one hand, the external light condition is always changing in the process of image acquisition, which makes it a challenging task in image processing . The image segmentation method based on the neural network can remove unnecessary components from plant images and keep the leaves as the region of interest, which can effectively avoid the influence of light intensity on image acquisition [103]. On the other hand, the complexity of the images obtained in the field makes it difficult for the traditional RGB color system to obtain the segmentation results accurately. However, the Lab color system has robust illumination variations and large color ranges, providing better performance than RGB and other color systems [97]. Therefore, we can transform RGB images into the Lab system to extract the channel of L, a, and b, then used the Otsu method combined with morphological processing and median filtering to obtain a binary image. Among them, L-channel can be used to segment objects from other crops using luminance differences, to remove scattered pixels by using morphological operations and median filtering, then to obtain the final segmentation results [104].
Based on the segmented image, the RGB, Lab, HSI, and RLI channel information of the image is usually extracted for feature acquisition [97][101]. For example, a greenness index [105], some color feature parameters including dark green color index (DGCI), value (V) and hue (H) [99], the spatial and temporal distributions of the color index of the canopy such as G, G/R, G/B, NRI, NGI, NBI can also be used to acquire the crop N status. Among them, the NRI was regarded as a valid indicator that can better reflect on the N status of rice [98] and maize [106]. Besides, the total N status can influence the leaf color. A novel indicator named Growth Status (GS) was developed to reflect the crop growth conditions, which mainly includes GSMER and GSMCC versions, more precision results can be obtained by combining this indicator with the color factors (color characteristics of leaf surface) [104].
Furthermore, previous studies [107] have also demonstrated that texture and color are the main visual features related to maize N status. There have some methods such as Gabor Wavelet (GW), Volumetric Fractal Dimension (VFD), and VFD with canonical analysis (VFDCA) for the texture analysis. For instance, some non-destructive methods were proposed to extract 11 crop features from digital images, including a morphological feature (top projected canopy area), color features (the value of R, G, B, H, S, I), and textural features (entropy, contrast, homogeneity, and energy) [101][108]. Besides, as the shape and color of leaves dynamically change with the amount of fertilizer applied, some new feature parameters such as shape features (etiolation degree (ED), etiolation area (EA)), color features (normalized red or green index, etc.), and morphological features (perimeter, area) were proposed and used to assess the process of leaf change, which has a good potential in crop N status estimation [109][110]. However, sometimes, color and texture features will be misjudged due to the influence of external light. Therefore, this is a situation that needs to be considered to ensure the accuracy of the estimation model.
2.3. Application of Estimation Methods Based on Vision Data to Crop N Status Diagnosis
It is a critical task to select an appropriate estimation method for establishing a robust estimation model, which can assess crop N status. Compared with the statistical method, ANN has good potential to process data. In particular, when the image feature is multifarious, and the original data do not follow a similar distribution pattern [111][112][113]. For example, based on R, G, B channels of the color image obtained from a digital camera, a linear regression model and ANNs model named the multilayer perception neural network (MLPNN) was established and the result showed that the MLPNN model has better accuracy than the linear regression model [114]. As a popular algorithm, PLSR was used when processing multivariable data, and many studies have demonstrated that this method is powerful for acquiring key variables and establishing an accurate regression model [115][116], which is effective in estimating water and N status of winter wheat [109]. Moreover, combinations of algorithms are also common. The random forest (RF) was used as the estimator for crop N status and biomass estimation, and simple linear regression (SLR) was used for validating the consistency of the results of RF [96]. However, when there is a large amount of data, the above methods have some limitations in calculation efficiency and model accuracy. In this case, it is difficult to ensure the accuracy and real-time of crop N status assessment. With the development of deep learning in image processing, an ensemble of deep learning multilayer perceptron was proposed by using committee machines, which can be used for color normalization and image segmentation, and combine with a genetic algorithm (an optimization algorithm) to fine-tune the color normalization and achieve a good result in crop N estimation [117]. Among them, the principle of image processing and N status evaluation of this method is shown in Figure 5. Compared with linear regression, non-linear regression, and neural network, the deep learning method has higher training accuracy, but it requires a lot of data. When the amount of data is small, it is likely that the training results have been fitted. Therefore, in the later process of algorithm selection, we should choose whether to use a deep learning method according to the size of the data.
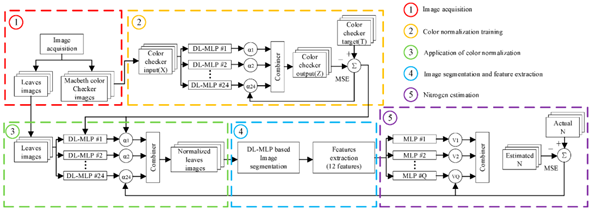
Figure 5. Method based on deep learning for on-field N status estimation in plants.
In summary, vision technology has been widely used in agricultural research due to its advantages of low cost and high precision, such as crop N status diagnosis and N stress research. However, the phenotypic phenomenon of leaves is not very obvious in the early stage of N deficiency, and it is difficult to catch the early symptoms of N deficiency by using visual technology. However, when N deficiency occurs seriously, although visual technology can realize low-cost identification, but the crop has been under serious stress, this affects crop yield and quality. In addition, most of the data involved in the visual technology are image data, so the traditional methods have some limitations, such as low efficiency and large amount of calculation. Although the deep learning method has a good effect on image data, it has certain requirements on the amount of data, and it is difficult to obtain large-scale image data in N diagnosis. With the development of crop phenotype technology, the research and application of phenotype platform will be able to solve this problem, and it can be used to obtain the image data of the whole growth stage of crops for the evaluation of crop N status.
This entry is adapted from the peer-reviewed paper 10.3390/rs12162578
References
- Usha, K.; Singh, B. Potential applications of remote sensing in horticulture—A review. Sci. Hortic. 2013, 153, 71–83.
- Hansen, P.M.; Schjoerring, J.K. Reflectance measurement of canopy biomass and nitrogen status in wheat crops using normalized difference vegetation indices and partial least squares regression. Remote Sens. Environ. 2003, 86, 542–553.
- Huang, Z.; Turner, B.J.; Dury, S.J.; Wallis, I.R.; Foley, W.J. Estimating foliage nitrogen concentration from HYMAP data using continuum removal analysis. Remote Sens. Environ. 2004, 93, 18–29.
- Abdel-Rahman, E.M.; Ahmed, F.B.; Berg, M. Van Den Estimation of sugarcane leaf nitrogen concentration using in situ spectroscopy. Int. J. Appl. Earth Obs. Geoinf. 2010, 12, S52–S57.
- Lin, D.; Wei, G.; Shi, S.; Jian, Y.; Jia, S.; Bo, Z.; Song, S. Estimation of rice leaf nitrogen contents based on hyperspectral LIDAR. Int. J. Appl. Earth Obs. Geoinf. 2016, 44, 136–143.
- Lin, D.; Wei, G.; Jian, Y. Application of spectral indices and reflectance spectrum on leaf nitrogen content analysis derived from hyperspectral LiDAR data. Opt. Laser Technol. 2018, 107, 372–379.
- Wang, W.; Yao, X.; Tian, Y.; Liu, X.; Ni, J.; Cao, W.; Zhu, Y. Common Spectral Bands and Optimum Vegetation Indices for Monitoring Leaf Nitrogen Accumulation in Rice and Wheat. J. Integr. Agric. 2012, 11, 2001–2012.
- Bausch, W.C.; Khosla, R. QuickBird satellite versus ground-based multi-spectral data for estimating nitrogen status of irrigated maize. Precis. Agric. 2010, 11, 274–290.
- Maleki, M.; Massah, J.; Dehghan, M. Application of a spectral sensor for the assessment of nitrogen content in lettuce plants. Aust. J. Crop Sci. 2012, 6, 918–923.
- Yang, H.Q.; Lv, G. Application of Multi-Spectral Imaging Technique in the Determination of Leaves Nitrogen Level of Fruit Tree. Adv. Mater. Res. 2011, 181–182, 272–275.
- Zhao, R.; Li, M.; Li, S.; Ding, Y. Winter wheat nutrition diagnosis under different N treatments based on multispectral images and remote sensing. Multispectral Hyperspectral Ultraspectral Remote Sens. Technol. Tech. Appl. III 2010, 7857, 78571G.
- Zheng, H.; Cheng, T.; Li, D.; Yao, X.; Tian, Y.; Cao, W.; Zhu, Y. Combining unmanned aerial vehicle (UAV)-based multispectral imagery and ground-based hyperspectral data for plant nitrogen concentration estimation in rice. Front. Plant Sci. 2018, 9, 936.
- Liu, Y.L.; Qiang, L.; He, S.L.; Yi, S.L.; Liu, X.F.; Xie, R.J.; Zheng, Y.Q.; Deng, L. Prediction of nitrogen and phosphorus contents in citrus leaves based on hyperspectral imaging. Int. J. Agric. Biol. Eng. 2015, 8, 80–88.
- Xu, X.G.; Zhao, C.J.; Wang, J.H.; Zhang, J.C.; Song, X.Y. Using optimal combination method and in situ hyperspectral measurements to estimate leaf nitrogen concentration in barley. Precis. Agric. 2014, 15, 227–240.
- Cilia, C.; Panigada, C.; Rossini, M.; Meroni, M.; Busetto, L.; Amaducci, S.; Boschetti, M.; Picchi, V.; Colombo, R. Nitrogen Status Assessment for Variable Rate Fertilization in Maize through Hyperspectral Imagery. Remote Sens. 2014, 6, 6549–6565.
- Quemada, M.; Gabriel, J.L.; Zarco-Tejada, P. Airborne Hyperspectral Images and Ground-Level Optical Sensors As Assessment Tools for Maize Nitrogen Fertilization. Remote Sens. 2014, 6, 2940–2962.
- Liu, S.; Li, L.; Gao, W.; Zhang, Y.; Liu, Y.; Wang, S.; Lu, J. Diagnosis of nitrogen status in winter oilseed rape ( Brassica napus L.) using in-situ hyperspectral data and unmanned aerial vehicle (UAV) multispectral images. Comput. Electron. Agric. 2018, 151, 185–195.
- Feng, D.; Xu, W.; He, Z.; Zhao, W.; Yang, M. Advances in plant nutrition diagnosis based on remote sensing and computer application. Neural Comput. Appl. 2019, 2019, doi:10.1007/s00521-018-3932-0.
- Yang, G.; Liu, J.; Zhao, C.; Li, Z.; Huang, Y.; Yu, H.; Xu, B.; Yang, X.; Zhu, D.; Zhang, X. Unmanned Aerial Vehicle Remote Sensing for Field-Based Crop Phenotyping: Current Status and Perspectives. Front. Plant Sci. 2017, 8, 1111.
- Baresel, J.P.; Rischbeck, P.; Hu, Y.; Kipp, S.; Barmeier, G.; Mistele, B. Use of a digital camera as alternative method for non-destructive detection of the leaf chlorophyll content and the nitrogen nutrition status in wheat. Comput. Electron. Agric. 2017, 140, 25–33.
- Li, Z.; Li, Z.; Fairbairn, D.; Li, N.; Xu, B.; Feng, H. Multi-LUTs method for canopy nitrogen density estimation in winter wheat by field and UAV hyperspectral. Comput. Electron. Agric. 2019, 162, 174–182.
- Ulissi, V.; Antonucci, F.; Benincasa, P.; Farneselli, M.; Tosti, G.; Guiducci, M.; Tei, F.; Costa, C.; Pallottino, F.; Pari, L.; et al. Nitrogen concentration estimation in tomato leaves by VIS-NIR non-destructive spectroscopy. Sensors 2011, 11, 6411–6424.
- Roumet, P. Assessing leaf nitrogen content and leaf mass per unit area of wheat in the field throughout plant cycle with a portable spectrometer. F. Crop. Res. 2013, 140, 44–50.
- Zhang, J . Potential of continuum removed reflectance spectral features estimating nitrogen nutrition in rice canopy level// Hyperspectral Image and Signal Processing: Evolution in Remote Sensing (WHISPERS), 2010 2nd Workshop on. IEEE, 2010.
- Yu, K.; Li, F.; Gnyp, M.L.; Miao, Y.; Bareth, G.; Chen, X. Remotely detecting canopy nitrogen concentration and uptake of paddy rice in the Northeast China Plain. ISPRS J. Photogramm. Remote Sens. 2013, 78, 102–115.
- Gnyp, M. L.; Panitzki. M.; Reusch. S. Comparison between tractor-based and UAV-based spectrometer measurements in winter wheat// Proceeedings of the 13th International Conference on Precision Agriculture. 2016,1-10.
- Ferwerda, J.G.; Skidmore, A.K.; Mutanga, O. Nitrogen detection with hyperspectral normalized ratio indices across multiple plant species. Int. J. Remote Sens. 1996, 26, 4083–4095.
- Chen, P.; Haboudane, D.; Tremblay, N.; Wang, J.; Vigneault, P.; Li, B. New spectral indicator assessing the efficiency of crop nitrogen treatment in corn and wheat. Remote Sens. Environ. 2010, 114, 1987–1997.
- Delegido, J.; Alonso, L.; Abad, G.G.; Jose, M. Moreno Estimating chlorophyll content of crops from hyperspectral data using a normalized area over reflectance curve (NAOC). J. Appl. Earth Obs. Geoinf. 2010, 2010, 165–174.
- Tian, Y.C.; Yao, X.; Yang, J.; Cao, W.X.; Hannaway, D.; Zhu, Y. Assessing newly developed and published vegetation indices for estimating rice leaf nitrogen concentration with ground- and space-based hyperspectral reflectance. F. Crop. Res. 2011, 120, 299–310.
- Ren, H.; Zhou, G.; Zhang, X. Estimation of green aboveground biomass of desert steppe in Inner Mongolia based on red-edge reflectance curve area method. Biosyst. Eng. 2011, 109, 385–395.
- Rouse, J.W.; Haas, R.H.; Deering, D.W.; Scheel, J.A.; Harlan, J. Monitoring the Vernal Advancement and Retrogradation (Green wave Effect) of Natural Vegetation; National Aeronautics and Space Administration (NASA)/Goddard Sp. Flight Cent. Type III Final Report; NASA/GSFC: Greenbelt, MD, USA, 1974.
- Bao, Y.; Xu, K.; Min, J.; Xu, J. Estimating wheat shoot nitrogen content at vegetative stage from in situ hyperspectral measurements. Crop Sci. 2013, 53, 2063–2071.
- Gitelson, A.A.; Viña, A.; Ciganda, V.S.; Rundquist, D.C.; Arkebauer, T.J. Remote estimation of canopy chlorophyll in crops. Geophys. Res. Lett. 2005, 32, doi:10.1029/2005GL022688.
- Feng, W.; Guo, B. Bin; Wang, Z.J.; He, L.; Song, X.; Wang, Y.H.; Guo, T.C. Measuring leaf nitrogen concentration in winter wheat using double-peak spectral reflection remote sensing data. Field Crop. Res. 2014, 159, 43–52.
- He, L.; Zhang, H.Y.; Zhang, Y.S.; Song, X.; Feng, W.; Kang, G.Z.; Wang, C.Y.; Guo, T.C. Estimating canopy leaf nitrogen concentration in winter wheat based on multi-angular hyperspectral remote sensing : The journal of the European Society for Agronomy. Eur. J. Agron. 2016, 73, 170–185.
- Guo, B.-B.; Qi, S.L.; Heng, Y.R.; Duan, J.Z.; Zhang, H.Y.; Wu, Y.P.; Feng, W.; Xie, Y.X.; Zhu, Y.J. Remotely assessing leaf N uptake in winter wheat based on canopy hyperspectral red-edge absorption. Eur. J. Agron. 2016, 82, 113–124.
- Blackburn, G.A. Quantifying chlorophylls and carotenoids at leaf and canopy scales: An evaluation of some hyperspectral approaches. Remote Sens. Environ. 1998, 66, 273–285.
- Sims, D.A.; Gamon, J.A. Relationships between leaf pigment content and spectral reflectance across a wide range of species, leaf structures and developmental stages. Remote Sens. Environ. 2002, 81, 337–354.
- Wang, J.; Shen, C.; Liu, N.; Jin, X.; Fan, X.; Dong, C.; Xu, Y. Non-Destructive Evaluation of the Leaf Nitrogen Concentration by In-Field Visible/Near-Infrared Spectroscopy in Pear Orchards. Sensors 2017, 17, 538.
- Xu, X.G.; Zhao, C.J.; Wang, J.H.; Li, C.J.; Yang, X.D. Associating new spectral features from visible and near infrared regions with optimal combination principle to monitor leaf nitrogen concentration in barley. J. INFRARED Millim. WAVES 2013, 32, 351.
- Daughtry, C.S.T.; Walthall, C.L.; Kim, M.S.; De Colstoun, E.B.; McMurtrey, J.E. Estimating corn leaf chlorophyll concentration from leaf and canopy reflectance. Remote Sens. Environ. 2000, 74, 229–239.
- Haboudane, D., Miller, J.R., Tremblay, N., Zarco-Tejada, P.J., Dextraze, L. Integrated narrow-band vegetation indices for prediction of crop chlorophyll content for application to precision agriculture. Remote Sens. Environ. 2002, 81, 416–426.
- Maire, L.E.; Francois, C.; Dufrene, E. Towards universal broad leaf chlorophyll indices using PROSPECT simulated database and hyperspectral reflectance measurements. Remote Sens. Environ. 2004, 89, 1–28.
- Huete, A.R. A soil-adjusted vegetation index (SAVI). Remote Sens. Environ. 1988, 25, 295–309.
- Qi, J.; Chehbouni, A.; Huete, A.R.; Kerr, Y.H.; Sorooshian, S.S. A modified soil adjusted vegetation index. Remote Sens Envrion 2015, 48, 119–126.
- Rondeaux, G.; Steven, M.; Baret, F. Optimization of Soil-Adjusted Vegetation Indices. Remote Sens. Environ. 1996, 55, 95–107.
- Clevers, J.G.P.W.; Kooistra, L. Using hyperspectral remote sensing data for retrieving canopy chlorophyll and nitrogen content. IEEE J. Sel. Top. Appl. Earth Obs. Remote Sens. 2012, 5, 574–583.
- Jia, B.; He, H.; Ma, F.; Diao, M.; Jiang, G.; Zheng, Z.; Cui, J.; Fan, H. Use of a digital camera to monitor the growth and nitrogen status of cotton. Sci. World J. 2014, 2014, 19–22.
- Wang, Y.; Liao, Q.; Yang, G.; Feng, H.; Yang, X.; Yue, J. Comparing broad-band and red edge-based spectral vegetation indices to estimate nitrogen concentration of crops using casi data. Int. Arch. Photogramm. Remote Sens. Spat. Inf. Sci. ISPRS Arch. 2016, 41, 137–143.
- Nevalainen, O.; Hakala, T.; Suomalainen, J.; Mäkipää, R.; Peltoniemi, M.; Krooks, A.; Kaasalainen, S. Fast and nondestructive method for leaf level chlorophyll estimation using hyperspectral LiDAR. Agric. For. Meteorol. 2014, 198, 250–258.
- Nevalainen, O.; Hakala, T.; Suomalainen, J.; Kaasalainen, S. Nitrogen concentration estimation with hyperspectral LiDAR. Remote Sens. Spat. Inf. Sci. 2013, II-5-W2,205-210. doi:10.5194/isprsannals-II-5-W2-205-2013.
- Zhu, H.; Liu, H.; Xu, Y.; Yang, G. UAV-based hyperspectral analysis and spectral indices constructing for quantitatively monitoring leaf nitrogen content of winter wheat. Appl. Opt. 2018, 27, 7722–7732.
- Wen, P.-F.; He, J.; Ning, F.; Wang, R.; Zhang, Y.-H.; Li, J. Estimating leaf nitrogen concentration considering unsynchronized maize growth stages with canopy hyperspectral technique. Ecol. Indic. 2019, 107, 105590.
- Zhao, C.; Wang, Z.; Wang, J.; Huang, W. Relationships of leaf nitrogen concentration and canopy nitrogen density with spectral features parameters and narrow-band spectral indices calculated from field winter wheat (Triticum aestivum L.) spectra. Int. J. Remote Sens. 2012, 33, 3472–3491.
- Curran, P.J. Remote sensing of foliar chemistry. Remote Sens. Environ. 1990, 30, 271–278.
- Li, F.; Miao, Y.; Feng, G.; Yuan, F.; Yue, S.; Gao, X.; Liu, Y.; Liu, B.; Ustin, S.L.; Chen, X. Improving estimation of summer maize nitrogen status with red edge-based spectral vegetation indices. Field Crop. Res. 2014, 157, 111–123.
- Schlemmera, M.; Gitelson, A.; Schepersa, J.; Fergusona, R.; Peng, Y.; Shanahana, J.; Rundquist, D. Remote estimation of nitrogen and chlorophyll contents in maize at leaf and canopy levels. Int. J. Appl. Earth Obs. Geoinf. 2013, 25, 47–54.
- Elshikha, D.M.; Barnes, E.M.; Clarke, T.R.; Hunsaker, D.J.; Haberland, J.A., Pinter, J.P., Jr.; Waller, P.M.; Thompson, T.L. Remote Sensing of Cotton Nitrogen Status Using the Canopy Chlorophyll Content Index (CCCI). Trans. Asabe 2008, 51, 73–82.
- Zhao, B.; Duan, A.; Ata-Ul-Karim, S.T.; Liu, Z.; Chen, Z.; Gong, Z.; Zhang, J.; Xiao, J.; Liu, Z.; Qin, A. Exploring new spectral bands and vegetation indices for estimating nitrogen nutrition index of summer maize. Eur. J. Agron. 2018, 93, 113–125.
- Wang, H.; Mortensen, A.K.; Mao, P.; Boelt, B.; Gislum, R. Estimating the nitrogen nutrition index in grass seed crops using a UAV-mounted multispectral camera. Int. J. Remote Sens. 2019, 40, 2467–2482.
- Gao, B.C.; Goetz, A.F.H. Extraction of dry leaf spectral features from reflectance spectra of green vegetation. Remote Sens. Environ. 1994, 47, 369–374.
- Ramoelo, A.; Skidmore, A.K.; Schlerf, M.; Mathieu, R.; Heitkönig, I.M.A. Water-removed spectra increase the retrieval accuracy when estimating savanna grass nitrogen and phosphorus concentrations. ISPRS J. Photogramm. Remote Sens. 2011, 66, 408–417.
- Schlerf, M.; Atzberger, C.; Hill, J.; Buddenbaum, H.; Werner, W.; Schüler, G. Retrieval of chlorophyll and nitrogen in Norway spruce (Picea abies L. Karst.) using imaging spectroscopy. Int. J. Appl. Earth Obs. Geoinf. 2010, 12, 17–26.
- Ramoelo, A.; Skidmore, A.K.; Schlerf, M.; Heitkönig, I.M.A.; Mathieu, R.; Cho, M.A. Savanna grass nitrogen to phosphorous ratio estimation using field spectroscopy and the potential for estimation with imaging spectroscopy. Int. J. Appl. Earth Obs. Geoinf. 2013, 23, 334–343.
- Feng, M.C.; Zhao, J.J.; Yang, W.D.; Wang, C.; Zhang, M.J.; Xiao, L.J.; Ding, G.W. Evaluating winter wheat (Triticum aestivum L.) nitrogen status using canopy spectrum reflectance and multiple statistical analysis. Spectrosc. Lett. 2016, 49, 507–513.
- Pearson, R.L.; Miller, L.D. Remote Mapping of Standing Crop Biomass for Estimation of Productivity of the Shortgrass Prairie. Remote Sens. Environ. 1972.doi: 10.1177/002076409904500102.
- Li, F.; Gnyp, M.L.; Jia, L.; Miao, Y.; Yu, Z.; Koppe, W.; Bareth, G.; Chen, X.; Zhang, F. Estimating N status of winter wheat using a handheld spectrometer in the North China Plain. Field Crop. Res. 2008, 106, 77–85.
- Tahir, M.N.; Li, J.; Liu, B.; Zhao, G.; Fuqi, Y.; Chengfeng, C. Hyperspectral estimation model for nitrogen contents of summer corn leaves under rainfed conditions. Pak. J. Bot. 2013, 45, 1623–1630.
- Shi, J.; Zou, X.; Zhao, J.; Wang, K.; Chen, Z. Nondestructive diagnostics of nitrogen deficiency by cucumber leaf chlorophyll distribution map based on near infrared hyperspectral imaging. Sci. Hortic. 2012, 138, 190–197.
- Nguyen, H.T.; Lee, B.W. Assessment of rice leaf growth and nitrogen status by hyperspectral canopy reflectance and partial least square regression. Eur. J. Agron. 2006, 24, 349–356.
- Wen, D.; Tongyu, X.; Fenghua, Y.; Chunling, C. Measurement of nitrogen content in rice by inversion of hyperspectral reflectance data from an unmanned aerial vehicle. Ciênc. Rural 2018, 48, e20180008.
- Perry, E.M.; Roberts, D.A. Sensitivity of Narrow-Band and Broad-Band Indices for Assessing Nitrogen Availability and Water Stress in an Annual Crop. Agron. J. 2008, 4, 969–996.
- Xue, L.; Cao, W.; Luo, W.; Dai, T.; Zhu, Y. Monitoring Leaf Nitrogen Status in Rice with Canopy Spectral Reflectance. Agron. J. 2004, 96, 135–142.
- Yoon, S.C.; Shin, T.S.; Heitschmidt, G.W.; Lawrence, K.C. Hyperspectral imaging using a color camera and its application for pathogen detection. Proc. SPIE. 2015, 9405, 940506.
- Li, X.; Zhang, Y.; Bao, Y.; Luo, J.; Yang, G. Exploring the Best Hyperspectral Features for LAI Estimation Using Partial Least Squares Regression. Remote Sens. 2014, 6, 6221–6241.
- Nigon, T.J.; Mulla, D.J.; Rosen, C.J.; Cohen, Y.; Alchanatis, V.; Knight, J.; Rud, R. Hyperspectral aerial imagery for detecting nitrogen stress in two potato cultivars. Comput. Electron. Agric. 2015, 112, 36–46.
- Thorp, K.R.; Wang, G.; Bronson, K.F.; Badaruddin, M.; Mon, J. Hyperspectral data mining to identify relevant canopy spectral features for estimating durum wheat growth, nitrogen status, and grain yield. Comput. Electron. Agric. 2017, 136, 1–12.
- Li, Z.; Jin, X.; Yang, G.; Drummond, J.; Yang, H.; Clark, B.; Li, Z.; Zhao, C. Remote sensing of leaf and canopy nitrogen status in winter wheat (Triticum aestivum L.) based on N-PROSAIL model. Remote Sens. 2018, 10, 1–18.
- Mutanga, O.; Adam, E.; Adjorloloa, C.; Abdel-Rahmanw, E.M. Evaluating the robustness of models developed from field spectral data in predicting African grass foliar nitrogen concentration using WorldView-2 image as an independent test dataset. Int. J. Appl. Earth Obs. Geoinf. 2015, 34, 178–187.
- Miphokasap, P.; Wannasiri, W. Estimations of Nitrogen Concentration in sugarcane using hyperspectral imagery. Sustainability 2018, 10, 1266.
- Giorgos, M.; Jungho, I.; Caesar, O. Support vector machines in remote sensing: A review. ISPRS J. Photogramm. Remote Sens. 2011, 3, 247–259.
- Axelsson, C.; Skidmore, A.K.; Schlerf, M.; Fauzi, A.; Verhoef, W. Hyperspectral analysis of mangrove foliar chemistry using PLSR and support vector regression. Int. J. Remote Sens. 2013, 34, 1724–1743.
- Li, L.; Jákli, B.; Lu, P.; Ren, T.; Ming, J.; Liu, S.; Wang, S.; Lu, J. Assessing leaf nitrogen concentration of winter oilseed rape with canopy hyperspectral technique considering a non-uniform vertical nitrogen distribution. Ind. Crops Prod. 2018, 116, 1–14.
- Chen, J.; Li, F.; Wang, R.; Fan, Y.; Raza, M.A.; Liu, Q.; Wang, Z.; Cheng, Y.; Wu, X.; Yang, F.; et al. Estimation of nitrogen and carbon content from soybean leaf reflectance spectra using wavelet analysis under shade stress. Comput. Electron. Agric. 2019, 156, 482–489.
- Ji-Yong, S.; Xiao-Bo, Z.; Jie-Wen, Z.; Han-Ping, M.; Kai-Liang, W.; Zheng-Wei, C.; Xiao-Wei, H. Diagnostics of nitrogen deficiency in mini-cucumber plant by near infrared reflectance spectroscopy. Afr. J. Biotechnol. 2011, 10, 19687–19692.
- Pasolli, L.; Melgani, F.; Blanzieri, E. Gaussian Process Regression for Estimating Chlorophyll Concentration in Subsurface Waters From Remote Sensing Data. IEEE Geosci. Remote Sens. Lett. 2010, 7, 464–468.
- Verrelst, J.; Alonso, L.; Caicedo, J.P.R.; Moreno, J.; Camps-Valls, G. Gaussian Process Retrieval of Chlorophyll Content From Imaging Spectroscopy Data. IEEE J. Sel. Top. Appl. Earth Obs. Remote Sens. 2013, 6, 867–874.
- Arenas-García, J.; Petersen, K.B.; Campsvalls, G.; Hansen, L.K. Kernel Multivariate Analysis Framework for Supervised Subspace Learning: A Tutorial on Linear and Kernel Multivariate Methods. IEEE Signal Process. Mag. 2013, 30, 16–29.
- de Fátima da Silva, F.; Pedro, H.C.L.; Liliane, M.R.; Mário, A.M.; Alvaro, M.G.Z.; Valdo, R.H.; Odemir, M.B. A Diagnostic Tool for Magnesium Nutrition in Maize Based on Image Analysis of Different Leaf Sections. Crop Sci. 2014, 54, 738.
- Kyveryga, P.M.; Blackmer, T.M.; Pearson, R. Normalization of uncalibrated late-season digital aerial imagery for evaluating corn nitrogen status. Precis. Agric. 2012, 13, 2–16.
- Li, Y.; Chen, D.; Walker, C.N.; Angus, J.F. Estimating the nitrogen status of crops using a digital camera. Field Crop. Res. 2010, 118, 221–227.
- Pagola, M.; Ortiz, R.; Irigoyen, I.; Bustince, H.; Barrenechea, E.; Aparicio-Tejo, P.; Lamsfus, C.; Lasa, B. New method to assess barley nitrogen nutrition status based on image colour analysis : Comparison with SPAD-502. Comput. Electron. Agric. 2009, 65, 213–218.
- Laliberte, A.S.; Rango, A.; Herrick, J.E.; Fredrickson, E.L.; Burkett, L. An object-based image analysis approach for determining fractional cover of senescent and green vegetation with digital plot photography. J. Arid Environ. 2007, 69, 1–14.
- Sakamoto, T.; Wardlow, B.D.; Arkebauer, T.J.; Verma, S.B.; Suyker, A.E.; Shibayama, M. Application of day and night digital photographs for estimating maize biophysical characteristics. Precis. Agric. 2012, 13, 285–301.
- Näsi, R.; Viljanen, N.; Kaivosoja, J.; Alhonoja, K.; Hakala, T.; Markelin, L.; Honkavaara, E. Estimating Biomass and Nitrogen Amount of Barley and Grass Using UAV and Aircraft Based Spectral and Photogrammetric 3D Features. Remote Sens. 2018, 10, 1082.
- Tewari, V.K.; Kumar, A.A.; Kumar, S.P.; Pandey, V.; Chandel, N.S. Estimation of plant nitrogen content using digital image processing. Agric. Eng. Int. CIGR J. 2013, 2, 73–86.
- Wang, Y.; Wang, D.; Zhang, G.; Wang, C. Digital camera-based image segmentation of rice canopy and diagnosis of nitrogen nutrition. Nongye Gongcheng Xuebao/Trans. Chin. Soc. Agric. Eng. 2012, 28, 131–136.
- Yuan, Y.; Chen, L.; Li, M.; Wu, N.; Wan, L.; Wang, S. Diagnosis of nitrogen nutrition of rice based on image processing of visible light. In Proceedings of the 2016 IEEE International Conference on Functional-Structural Plant Growth Modeling, Simulation, Visualization and Applications (FSPMA), Qingdao, China, 7–11 November 2016; pp. 228–232.
- Elsayed, S.; Barmeier, G.; Schmidhalter, U. Passive Reflectance Sensing and Digital Image Analysis Allows for Assessing the Biomass and Nitrogen Status of Wheat in Early and Late Tillering Stages. Front. Plant Sci. 2018, 9, 1478.
- Mao, H.; Gao, H.; Zhang, X.; Kumi, F. Nondestructive measurement of total nitrogen in lettuce by integrating spectroscopy and computer vision. Sci. Hortic. 2015, 184, 1–7.
- Wang, Y.; Wang, D.; Zhang, G.; Wang, J. Estimating nitrogen status of rice using the image segmentation of G-R thresholding method. Field Crop. Res. 2013, 149, 33–39.
- Sulistyo, S.B.; Woo, W.L.; Dlay, S.S. Regularized Neural Networks Fusion and Genetic Algorithm Based On-Field Nitrogen Status Estimation of Wheat Plants. IEEE Trans. Ind. Inform. 2017, 13, 103–114.
- Chen, Z.; Wang, X.; Wang, H. Preliminary research on total nitrogen content prediction of sandalwood using the error-in-variable models based on digital image processing. PLoS ONE 2018, 8, e0202649.
- Purcell, L.C.; Mozaffari, M.; Karcher, D.E.; Andy King, C.; Marsh, M.C.; Longer, D.E. Association of “Greenness” in corn with yield and leaf Nitrogen concentration. Agron. J. 2011, 103, 529–535.
- Bai, J.S.; Cao, W.D.; Xiong, J.; Zeng, N.H.; Katshyoshi, S.; Rui, Y.K. Nitrogen Status Diagnosis and Yield Prediction of Spring Maize after Green Manure Incorporation by Using a Digital Camera. Spectrosc. Spectr. Anal. 2013, 33, 3334.
- Zúñiga, A.M.G. Sistema de visão artificial para identificação do estado nutricional de plantas. Univ. Sao Paulo, Math. Comput. Sci. Inst. Sao Carlos, Brazil 2012. Available online: https://teses.usp.br/teses/disponiveis/55/55134/tde-20062012-101012/publico/AlvaroGomezZuniga.pdf (accessed on).
- Sunagar, V.B.; Kattimani, P.A.; Padasali, V.A.; Hiremath, N.V. Estimation of Nitrogen Content in Leaves using Image Processing. In Proceedings of the International Conference on Advances in Engineering & Technology, Goa, India, 20 April 2014; pp. 25–28.
- Sun, Y.; Gao, J.; Wang, K.; Shen, Z.; Chen, L. Utilization of machine vision to monitor the dynamic responses of rice leaf morphology and colour to nitrogen, phosphorus, and potassium deficiencies. J. Spectrosc. 2018, 2018, doi:10.1155/2018/1469314.
- Xiong, X.; Zhang, J.; Guo, D.; Chang, L.; Huang, D. Non-Invasive Sensing of Nitrogen in Plant Using Digital Images and Machine Learning for Brassica Campestris ssp. Chinensis L. Sensors 2019, 19, 2448.
- Chen, P. A Comparison of Two Approaches for Estimating the Wheat Nitrogen Nutrition Index Using Remote Sensing. Remote Sens. 2015, 7, 4527–4548.
- Huang, S.; Miao, Y.; Zhao, G.; Yuan, F.; Ma, X.; Tan, C.; Yu, W.; Gnyp, M.L.; Lenz-Wiedemann, V.I.S.; Rascher, U.; et al. Satellite remote sensing-based in-season diagnosis of rice nitrogen status in Northeast China. Remote Sens. 2015, 7, 10646–10667.
- Xia, T.; Miao, Y.; Wu, D.; Hui, S.; Khosla, R.; Mi, G. Active Optical Sensing of Spring Maize for In-Season Diagnosis of Nitrogen Status Based on Nitrogen Nutrition Index. Remote Sens. 2016, 8, 605.
- Moghaddam, P.A.; Derafshi, M.H.; Shayesteh, M. A new method in assessing sugar beet leaf nitrogen status through color image processing and artificial neural network. J. Food, Agric. Environ. 2010, 8, 485–489.
- Kusnierek, K.; Korsaeth, A. Simultaneous identification of spring wheat nitrogen and water status using visible and near infrared spectra and Powered Partial Least Squares Regression. Comput. Electron. Agric. 2015, 117, 200–213.
- Zeng, W.; Chi, X.; Wu, J.; Huang, J. Sunflower seed yield estimation under the interaction of soil salinity and nitrogen application. Field Crop. Res. 2016, 198, 1–15.
- Sulistyo, S.B.; Woo, W.L.; Dlay, S.S.; Gao, B. Building a Globally Optimized Computational Intelligent Image Processing Algorithm for On-Site Inference of Nitrogen in Plants. IEEE Intell. Syst. 2018, 33, 15–26.