An exploratory spatial analysis investigates the location of schools in Calgary (Canada) in relation to air pollution and active transportation options. Air pollution exhibits marked spatial variation throughout the city, along with distinct spatial patterns in summer and winter; however, all school locations lie within low to moderate pollution levels. Conversely, the study shows that almost half of the schools lie in low walkability locations; likewise, transitability is low for 60% of schools, and only bikability is widespread, with 93% of schools in very bikable locations. School locations are subsequently categorized by pollution exposure and active transportation options. This analysis identifies and maps schools according to two levels of concern: schools in car-dependent locations and relatively high pollution; and schools in locations conducive of active transportation, yet exposed to relatively high pollution. The findings can be mapped and effectively communicated to the public, health practitioners, and school boards. The study contributes with an explicitly spatial approach to the intra-urban public health literature. Developed for a moderately polluted city, the methods can be extended to more severely polluted environments, to assist in developing spatial public health policies to improve respiratory outcomes, neurodevelopment, and metabolic and attention disorders in school-aged children.
- spatial analysis
- air pollution
- active transportation
- walkability
- schools
- children
- proximity
- public health
- GIS (geographic information systems)
- Calgary
1. Introduction
The association between air pollution and adverse health effects is well documented in the literature [1,2,3]. Air pollution exposure at early ages may have even more serious effects, triggering the onset of environmental allergies [4,5]. A person can be exposed to air pollution while in their home, at work, while commuting to work, while exercising or recreating, and in a variety of other situations. Residential location, lifestyle, and socioeconomic status are only some of the factors that contribute to an individual’s exposure. Complex interactions across a large variety of factors occur mostly over space, within and beyond cities. Spatial analysis therefore is not simply a tool: it is an approach to public health research. Known as spatial thinking in the social and health sciences [6,7], this approach has come to the forefront in several disciplines, as it can cast new light on location and spatial interactions. Spatial thinking in the health and social sciences encompasses various forms of geographical and spatial research, including geographical information science and spatial analysis, which rely on spatial data [8]. Spatial data exhibit a number of properties that impact quantitative analyses in various ways, requiring the use of specific analytical tools [9]. One of the most serious concerns with spatial data is uncertainty, which is often intrinsic to the data; it is induced by other properties (spatial dependence and heterogeneity) and can be propagated through analytical models [10,11]. While there exists specific analytical tools to deal with uncertainties, perhaps the most successful approach remains a careful exploratory analysis of the data, which only can lead to better model specification.
Air pollution exhibits spatial patterns that are driven by numerous and often interacting factors, including localized emissions (mostly industry and traffic), atmospheric circulation (especially wind), and topography (elevation), among others. The spatial pattern of air pollution, that of exposure, and their association have received proportionally less attention in the literature [12]. This relative lack of research is in part related to the scarcity of information on the spatial patterns of air pollution. While air quality is typically measured frequently and regularly over time, spatial measurements tend to be sparse and irregular, making it hard to understand the variation in air pollution levels at the urban and intra-urban level [13]. Air quality in the proximity of schools is important, as students (as well as parents, teachers, and school staff) spend time in the area, often performing aerobic activities. The severity of air pollution near schools can be aggravated by the presence of school buses, which not only drive to and from school at least twice daily, but also often idle for extended periods while students come in and out of school. These vehicles, often run on diesel fuel, emit high levels of combustion gases and particulate matter through exhaust pipes that are just at the height of the respiratory organs of young children [14]. Children attending schools in highly polluted areas may not only be at risk of developing respiratory problems but also at risk of high BMI [4], which may in turn increase a number of health risks. Studies also show that traffic related air pollution may have harmful effects on neurodevelopment [5], and be linked with metabolic disorders [4] and fluctuation in children’s attention [15].
Air pollution in urban settings is mainly associated with industrial activities and transportation. In order to reduce pollution associated with commuting and other daily activities, active forms of transportation have been proposed and are generally encouraged. Active forms of transportation include typically walking, biking, and using public transit [16]. Active transportation is also encouraged as a way of achieving recommended daily physical activity levels, which can reduce health risks and obesity [17], the root cause of many health problems. Nonetheless, active transportation is not always a feasible alternative to the use of private automobile, primarily because of distance, i.e., destinations can be far away, and because of the characteristics of the built environment, i.e., urban environments may or may not be safe and conducive of walking [18]. In order to assess the feasibility of daily walking, the concept of walkability has emerged in the literature. While neighbourhood walkability does not determine active transportation, studies have shown that people living in highly walkable neighbourhoods take more steps per day and walk more for transport than those living in less walkable neighbourhoods [19,20]. In children, high walkability is positively associated with active park use [21,22] and overall higher levels of physical activity [23].
Walkability is generally assessed by the distance to major services and amenities in the neighbourhoods [24,25,26]. It can also be determined by a number of built environment characteristics [18], such as sidewalk availability, connectivity, and width; road width, signal availability, land use, intersection density, lighting, trees, sidewalk continuity, road connectivity, traffic volume, security and safety, among others [26,27]. Over the past two decades, several walkability indices have been developed [24,25,28,29,30,31,32,33,34]. The absence of a standardized method with a consistent set of variables makes it cumbersome to calculate or replicate indices for comparability across studies. For these reasons, the Walkscore™ (REDFIN, Seattle, WA, USA) index [35] has gained popularity in recent years. The walk score of a location is obtained as a weighted function of the distance of local amenities combined with a distance decay function [35,36].
High active transportation scores are not synonymous with active communities; however, walkability refers to built environments that promote walking. As such, walkability is generally considered beneficial, both from a health and from an environmental perspective. However, the health benefits of walking, as well as of other forms of active transportation, can be reduced, or even hampered, if active transportation occurs in areas with severe air pollution. Indeed, walkability measures typically disregard air quality. Yet, by engaging in walking and active transportation, we can contribute to the reduction of noxious pollutant emissions, but we may also increase our own exposure to those emissions. Therefore, while the environmental benefits of active transportation remain, the health benefits of physical activity can be offset by pollution exposure. As pollution levels vary spatially within a city, the health benefits of active transportation depend largely on where we engage in such activity. Further, the health benefits of walking to school and playing in the schoolyard depend largely on where schools are located with respect to air pollution.
In this study, we present an exploratory spatial analysis of school location in Calgary, Canada. We investigate the location of primary and secondary schools (kindergarten to grade 12) with respect to the residential pattern of school-aged children, active transportation options, and seasonal air pollution patterns. By analyzing active transportation scores of schools, the research identifies transportation options available to students. Locations of concern are identified, where active transportation options are poor, and air pollution levels are relatively high. Further analysis considers air pollution levels in locations where active transportation options are available. This analysis yields an additional set of locations of concern, where active transportation options are available, yet pollution levels are high. This combination may increase exposure levels of children who actively commute to their school.
2. Materials and Methods
2.1. Study Area
2.2. Data
2.3. Methods
3. Results
Figure 2a presents the residential pattern of children in elementary-to-junior high school age, i.e., grades K to 9, or age 5 to 14. Likewise, Figure 2b shows the residential patterns of senior-high age youth, that is grades 10 to 12, or ages 15 to 18. For each dissemination area where at least one school is located, the walkability score is overlaid. School location is represented by the walkability score, as no explicit school symbols were added to the maps.
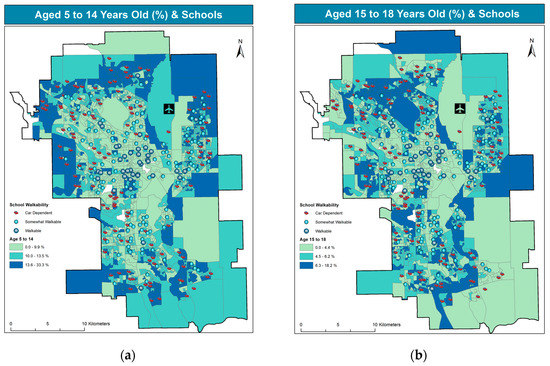
There are 279 schools, as shown in Figure 2, with several dissemination areas featuring more than one school The 279 schools are spread across 1436 dissemination areas. A single dissemination area may contain up to 7 schools. While schools are located throughout the city in almost every residential neighborhood, the highest concentration of child population is observed in the fringes of the city, mostly in newly developed neighborhoods. Conversely, school density is higher in inner city areas, which were once home to large numbers of children. Figure 2 further shows that children’s residence and walkability exhibit almost opposite patterns, as the frequency of children is higher in newer, more peripheral communities, where car dependence is highest.
Estimated pollution levels, represented by summer and winter p-AQHI, along with location of schools by walkability, are mapped in Figure 3.
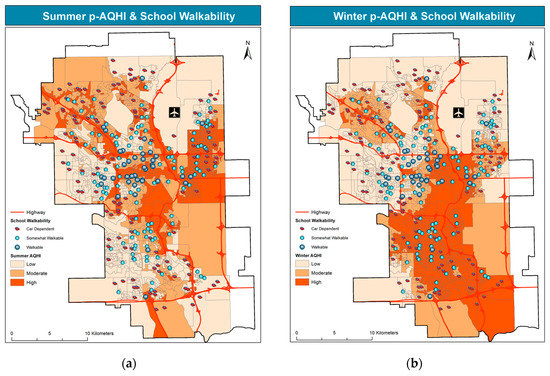
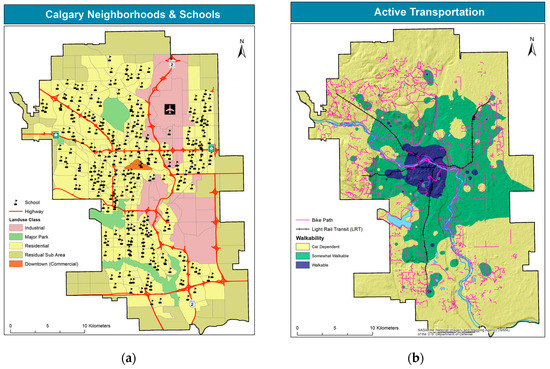
The figure shows that pollution levels tend to be higher along the North-South axis, where the main traffic corridor runs, within a major river valley. Pollution levels are also elevated in the eastern part of the city, in proximity of the main industrial area and the international airport, and strengthened by the prevailing westerly winds. A large number of schools are located in residential areas to the west of the N-S corridor, yet school location tends to coincide with more polluted areas, particularly in the southern part. In the North-West, schools are more frequent along a major road (Crowchild Trail/Highway 1A, shown in Figure 1) where pollution levels are higher. High frequency of schools is also observed in the highly populated and polluted northeast, i.e., east of the airport and close to the industrial area. Summer pollution levels display a more distinct pattern around traffic corridors and industrial areas. Conversely, winter pollution exhibits a more diffused pattern, as residential heating and local driving during the cold season are significant pollution sources in the winter [37]. Whereas schools are attended by children and school staff regularly in the winter season, their outdoors playgrounds remain important destinations for children to play also in the summer, particularly in the most walkable communities.
Similar to Figure 3 and Figure 4 overlays school bikability scores to estimated air pollution levels in the summer and winter.
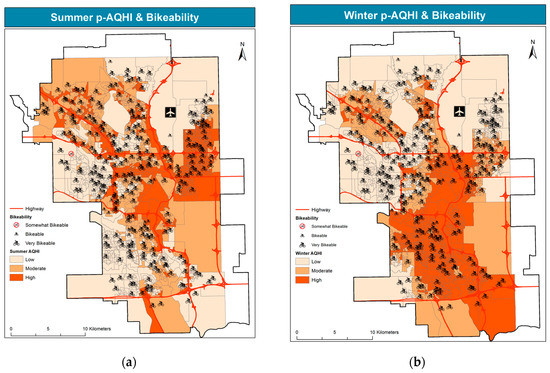
Practically all the schools are in locations that are bikable or very bikable, with minor exceptions in the west/northwest portion of the city. Indeed, most schools score “very bikable”, consistently with the city’s extensive bicycle pathway network, shown in Figure 1. Notably, a large portion of very bikable schools lies in the most polluted parts of the city, particularly the NE in the summer, and a large part of the south in the winter.
Likewise, Figure 5 shows school location by transit scores, over air pollution levels in summer and winter.
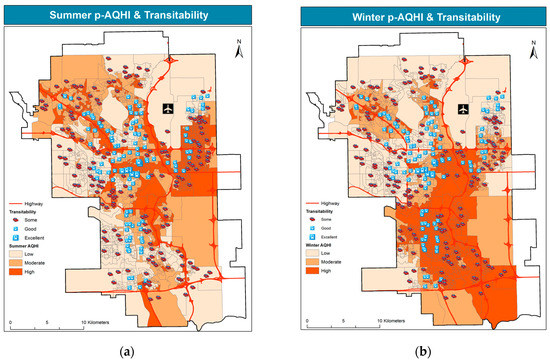
The spatial pattern of transitability shown in the figure resembles a three-prong fork pointing upwards, or north. This pattern reflects the city light rail transit system (LRT). The maps also show that good to excellent transit scores cover only a very small portion of the city, along the main traffic corridors. With few exceptions in the northeastern southern portions, most transitable locations lie in low pollution areas.
Table 1 presents the correlation across air pollution in both seasons, child and total population, and the three active transportation indices.

Several correlations are statistically significant. Relatively high correlation values are only observed within variables of the same category (e.g., across children of different ages and total population). Conversely, all the correlations across variables of different categories are lower than 0.4 in absolute value. The highest correlations are negative, in the 0.3–0.4 range, and are observed for children (both age groups) with walkscore and transitscore. These values indicate that most of the population resides in the lowest walkable and transitable neighbourhoods, and that the negative association between residence and active transportation options is more severe for the child population. Consistent with the widespread pattern shown in Figure 4, the bikability index exhibits low, yet statistically significant correlations. Negative correlations in the 0.2–0.3 range are observed for children in both age groups and AQHI in both seasons. Once again, slightly lower correlation with the same sign is observed for the total population. These correlations suggest that most population resides in less polluted areas, and this correlation is higher for the child population. Of the three active transportation indices, only transit is positively correlated (0.20) with the summer AQHI. This correlation is consistent with the pattern of transitability presented in Figure 5, whereby the more transitable locations lie near the major traffic corridors.
Table 2 summarizes the percentage of schools located in areas with varying levels of pollution (summer and winter) and active transportation modes (walkability, bikability, transitability).
Each of the three panes in the table compares one active transportation index with summer and winter pseudo-AQHI, for each school location. The column totals (identical in both seasons) indicate that almost half of the schools (45%) lie in non-walkable, or car dependent locations; of the remaining half, 41% lie in somewhat-walkable locations, and only 14% in highly walkable locations. Conversely, all the schools lie in bikable locations, with no less than 93% in highly bikable locations. With respect to transit, more than half of the schools (61%) lie in poorly transitable locations, with only 3% in locations with excellent transportability.
The row totals of Table 2, identical in each pane but different in the two seasons, show that approximately 40% of schools lie in low-pollution locations, approximately 30% in medium-pollution locations, and approximately 30% in high-pollution locations. The upper-right cells of each pane represent the most fortunate school locations, where active transportation scores are highest, and air pollution is lowest; whereas the least fortunate locations are those in the lower left corner of each pane, where air pollution is highest and active transportation scores are lowest. While the latter locations are far from ideal, less obvious health risks may be associated with school locations situated in the lower right corner of each pane of Table 2, where active transportation options are available, yet air pollution is high. This percentage of schools (bolded in the table) amounts to 16% in the summer and 20% in the winter with respect to walkability, 25% in the summer and 32% in the winter with respect to bikability, and 10% in the summer and 13% in the winter with respect to transitability.
The latter results, synthetically presented in Table 2, are mapped in Figure 6, providing greater spatial detail. This spatial analysis allows for identifying those schools that lie in locations with high air pollution and high active transportation scores.
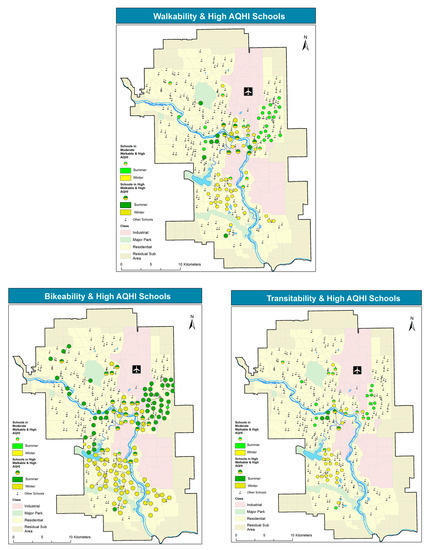
All the maps point to a spatial dichotomy, as pollution levels are higher in the NE in the summer and in the south in the winter. Therefore, a larger portion of walkable schools lies in higher summer pollution locations in the NE, vs. a higher portion of walkable schools in winter pollution in the south. Walkable schools in and around the downtown core are exposed to relatively high pollution levels in both seasons. A very similar pattern is observed for transitability. Conversely, the bikability map exhibits a similar spatial pattern, yet, compared to the other active transportation modes, it features the largest portion of schools with high scores in high pollution locations, in both seasons.
4. Discussion
This exploratory analysis contributes to the literature on air pollution and public health at the intra-urban scale with a spatial thinking approach to school location with respect to air pollution and active transportation options [52,53]. The analysis indicates that Calgary’s air quality varies substantially across space, as do active transportation options. Consequently, intensity of walking and biking, along with air pollution exposure levels, vary for school children, according to the location of their school. Local and anecdotal evidence suggests that not only the general public, but also health practitioners, tend to be unaware of these spatial variations in exposure levels.
4.1. Air Pollution and School Location
4.2. Measuring Active Transportation
4.3. Schools, Car Dependence, and Air Pollution
4.4. Recommandations and Future Work
5. Conclusions
An exploratory analysis of school location with respect to air pollution and active transportation options was conducted for the city of Calgary, Canada. The study contributes to the literature on air pollution and public health at the intra-urban scale with a spatially explicit approach. The analysis shows that air quality exhibits spatial variation, resulting in varying levels of exposure to air pollution for different schools. The study findings include spatial analyses and maps that effectively communicate, in great spatial detail, varying levels of concern with school location, air pollution, and active transportation options. Concerns exist with schools that have poor air quality and poor active transportation: maps show that these schools are located primarily in the south, where air pollution is higher in the winter, i.e., during the school year; and in the northeast, where pollution is higher in the summer. Further concerns exist with schools that have good active transportation, yet poor air quality. The maps show that most of these schools are located in and around the downtown core, where air pollution is relatively high in both seasons. These results constitute novel knowledge, which, through the cartographic representation, can be effectively communicated to the public, health practitioners, and school boards. Further, the methods presented in this paper, developed for a safe air quality environment, can be applied for the analysis and management of more critical situations, and assist in the development of spatially oriented public health policies.
References
- Dockery, D.W.; Pope, C.A.; Xu, X.; Spengler, J.D.; Ware, J.H.; Fay, M.E.; Ferris, B.G., Jr.; Speizer, F.E. An association between air pollution and mortality in six US cities. N. Engl. J. Med. 1993, 329, 1753–1759. [Google Scholar] [CrossRef] [PubMed]
- Gryparis, A.; Forsberg, B.; Katsouyanni, K.; Analitis, A.; Touloumi, G.; Schwartz, J.; Samoli, E.; Medina, S.; Anderson, H.R.; Niciu, E.M.; et al. Acute effects of ozone on mortality from the “Air Pollution and Health a European Approach” Project. Am. J. Respir. Crit. Care Med. 2004, 170, 1080–1087. [Google Scholar] [CrossRef] [PubMed]
- Monrad, M.; Sajadieh, A.; Christensen, J.S.; Ketzel, M.; Raaschou-Nielsen, O.; Tjønneland, A.; Sørensen, M. Long-Term Exposure to Traffic-Related Air Pollution and Risk of Incident Atrial Fibrillation: A Cohort Study. Environ. Health Perspect. 2017, 125, 422–427. [Google Scholar] [CrossRef] [PubMed]
- Jerret, M.; McConnell, R.; Wolch, J.; Chang, R.; Lam, C.; Dunton, G.; Gilliland, F.; Lurmann, F.; Islam, T.; Berhane, K. Traffic-related air pollution and obesity formation in children: A longitudinal, multilevel analysis. Environ. Health 2014, 13. [Google Scholar] [CrossRef] [PubMed]
- Sunyer, J.; Esnaola, M.; Alvarez-Pedrerol, M.; Forns, J.; Rivas, I.; López-Vicente, M.; Suades-González, E.; Foraster, M.; Garcia-Esteban, R.; Basagaña, X. Association between traffic-related air pollution in schools and cognitive development in primary school children: A prospective cohort study. PLoS Med. 2015, 12, e1001792. [Google Scholar] [CrossRef] [PubMed]
- Richardson, D.B.; Volkow, N.D.; Kwon, M.-P.; Kaplan, R.M.; Goodchild, M.F.; Croyle, R.T. Spatial turn in health research. Science 2013, 339, 1390–1392. [Google Scholar] [CrossRef] [PubMed]
- Goodchild, M.F.; Janelle, D.G. Thinking Spatially in the Social Sciences. In Spatial Integrated Social Science; Oxford University Press: Oxford, UK, 2004; pp. 3–17. [Google Scholar]
- Anselin, L.; Getis, A. Spatial statistical analysis and geographic information systems. In Perspectives on Spatial Data Analysis; Advances in Spatial Science; Springer: Berlin/Heidelberg, Germany, 2010; pp. 35–47. [Google Scholar]
- Shahid, R.; Berazzon, S.; Knudtson, M.L.; Ghali, W.A. Comparison of distance measures in spatial analytical modeling for health service planning. BMC Health Serv. Res. 2009, 9, 200. [Google Scholar] [CrossRef] [PubMed]
- Fotheringham, A.S.; Brunsdon, C.; Charlton, M. Geographically Weighted Regression: The Analysis of Spatially Varying Relationships; Wiley: West Sussex, UK, 2002. [Google Scholar]
- Anselin, L. Local indicator of spatial association—LISA. Geogr. Anal. 1995, 2, 93–115. [Google Scholar] [CrossRef]
- Wang, W.; Ying, Y.; Wu, Q.; Zhang, H.; Ma, D.; Xiao, W. A GIS-based spatial correlation analysis for ambient air pollution and AECOPD hospitalization in Jinan, China. Respir. Med. 2015, 109, 372–378. [Google Scholar] [CrossRef] [PubMed]
- Lee, D.; Mitchell, R. Controlling for localized spatio-temporal autocorrelation in long-term air pollution and health studies. Stat. Methods Med. Res. 2014, 23, 488–506. [Google Scholar] [CrossRef] [PubMed]
- Brunekreef, B.; Holgate, S.T. Air Pollution and health. Lancet 2002, 360, 1233–1242. [Google Scholar] [CrossRef]
- Sunyer, J.; Suades-González, E.; García-Esteban, R.; Rivas, I.; Pujol, J.; Alvarez-Pedrerol, M.; Basagaña, X. Traffic-Related Air Pollution and Attention in Primary School Children. Epidemiology 2017, 28, 181–189. [Google Scholar] [CrossRef] [PubMed]
- Lachapelle, U.; Frank, L.D.; Sallis, J.F.; Saelens, B.; Conway, T.L. Active transportation by transit-dependent and choice riders and potential displacement of leisure physical activity. J. Plan. Educ. Res. 2015, 36, 225–238. [Google Scholar] [CrossRef]
- Mueller, N.; Rojas-Rueda, D.; Cole-Hunter, T.; de Nazelle, A.; Dons, E.; Gerike, R.; Götschi, T.; Int Panis, L.; Kahlmeier, S.; Nieuwenhuijsen, M. Health impact assessment of active transportation: A systematic review. Prev. Med. 2015, 76, 103–114. [Google Scholar] [CrossRef] [PubMed]
- Maghelal, P.K.; Capp, C.J. Walkability: A review of existing pedestrian indices. J. Urban Reg. Inf. Syst. Assoc. 2011, 23, 5–17. [Google Scholar]
- Laxer, R.E.; Janssen, I. The proportion of youth’s physical inactivity attributable to neighborhood built environment features. Int. J. Health Geogr. 2013, 12, 31. [Google Scholar] [CrossRef] [PubMed]
- Prince, S.A.; Tremblay, M.S.; Prud’homme, D.; Colley, R.; Sawada, M.; Kristjansson, E.A. Neighbourhood differences in objectively measures physical activity, sedentary time and body mass index. J. Prev. Med.2011, 1, 182–189. [Google Scholar]
- Sallis, J.F.; Prochaska, J.J.; Tylor, W.C. A review of correlates of physical activity of children and adolescents. Med. Sci. Sports Exerc. 2000, 32, 963–975. [Google Scholar] [CrossRef] [PubMed]
- Dyck, D.V.; Sallis, J.F.; Cardon, G.; Deforche, B.; Adams, M.A.; Geremia, C.; Bourdeaudhij, I.D. Associations of neighbourhood characteristics with active park use: An observational study in two cities in the USA and Belgium. Int. J. Health Geogr. 2013, 12, 26. [Google Scholar] [CrossRef] [PubMed][Green Version]
- Kligerman, M.; Sallis, J.F.; Ryan, S.; Frank, L.D.; Nader, P.R. Association of neighborhood design and recreation environment variables with physical activity and body mass index in adolescents. Am. J. Health Promot. 2007, 21, 274–277. [Google Scholar] [CrossRef] [PubMed]
- Duncan, D.T.; Aldstadt, J.; Whalen, J.; Melly, S.J.; Gortmaker, S.L. Validation of Walkscore for estimating neighborhood walkability: An analysis of four US metropolitan areas. Int. J. Environ. Res. Public Health 2011, 8, 4160–4179. [Google Scholar] [CrossRef] [PubMed]
- Carr, L.J.; Dunsiger, S.I.; Marcus, B.H. Walk Score as a global estimate of neighbourhood walkability. Am. J. Prev. Med. 2010, 39, 460–463. [Google Scholar] [CrossRef] [PubMed]
- Saelens, B.E.; Sallis, J.F.; Black, J.B.; Chen, D. Neighborhood-based differences in physical activity: An environment scale evaluation. Am. J. Public Health 2003, 93, 1552–1558. [Google Scholar] [CrossRef] [PubMed]
- Schlossberg, M.; Agrawal, A.W.; Irvin, K. An assessment of GIS-enabled walkability audits. J. Urban Reg. Inf. Syst. Assoc. 2008, 19, 5–11. [Google Scholar]
- Frank, L.D.; Sallis, J.F.; Saelens, B.E.; Leary, L.; Cain, K.; Conway, T.L.; Hess, P.M. The development of a walkability index: Application to the neighbourhood quality of life study. Br. J. Sports Med. 2010, 44, 924–933. [Google Scholar] [CrossRef] [PubMed]
- Giles-Corti, B.; Kelty, S.F.; Zubrik, S.R.; Villanueva, K. Encouraging walking for transport and physical activity in children and adolescents: How important is the built environment? Sports Med. 2009, 39, 995–1009. [Google Scholar] [CrossRef] [PubMed]
- Krambeck, H.; Shah, J. Evaluating and comparing quality of pedestrian infrastructure and services across developing cities: Global walkability index. In Proceedings of the Transportation Research Board 87th Annual Meeting, Washington, DC, USA, 13–17 January 2008. [Google Scholar]
- McCormack, G.; Giles-Corti, B.; Lange, A.; Smith, T.; Martin, K.; Pikora, T.J. An update of recent evidence of the relationship between objective and self-report measure of the physical environment and physical activity behaviours. J. Sci. Med. Sport 2004, 7, 81–92. [Google Scholar] [CrossRef]
- Moudon, A.V.; Hess, P.M.; Synder, M.C.; Stanilov, K. Effects of site design on pedestrian travel in mixed-use, medium-density environments. Transp. Res. Rec. 2003, 1758, 48–55. [Google Scholar] [CrossRef]
- Sallis, J.F.; Johnson, M.F.; Calfas, K.J.; Caparosa, S.; Nicholas, J.F. Assessing perceived physical environmental variables that may influence physical activity. Res. Q. Exerc. Sport 1997, 68, 345–351. [Google Scholar] [CrossRef] [PubMed]
- Frank, L.D.; Pivo, G. Impacts of mixed use and density on utilization of three modes of travel: Single occupant vehicle, transit, and walking. Transp. Res. Rec. 1994, 1466, 44–52. [Google Scholar]
- Walkscore. REDFIN. Seattle, WA, USA. Available online: https://www.walkscore.com/ (accessed on 10 February 2017).
- Jones, A.P.; van Sluijs, E.M.F.; Ness, A.R.; Haynes, R.; Riddoch, C.J. Physical activity in children: Does how we define neighbourhood matter? Health Place 2010, 16, 236–241. [Google Scholar] [CrossRef] [PubMed]
- Bertazzon, S.; Johnson, M.; Eccles, K.; Kaplan, G. Accounting for spatial effects in land use regression for urban air pollution modelling. Spat. Spat. Tempor. Epidemiol. 2015, 14–15, 9–21. [Google Scholar] [CrossRef] [PubMed]
- Liu, X.; Bertazzon, S. Fine scale spatiotemporal modelling of urban air pollution. In Proceedings of the Ninth International Conference on Geographic Information Science (GIScience 2016), Montreal, QC, Canada, 27–30 September 2016; Springer: Berlin, Germany, 2016; pp. 210–224. [Google Scholar]
- Bertazzon, S.; Underwood, F.; Johnson, M.; Zhang, J. Land Use Regression of Particulate Matter in Calgary, Canada. In Proceedings of the Ninth International Conference on Geographic Information Science (GIScience 2016), Montreal, QC, Canada, 27–30 September 2016; pp. 21–24. [Google Scholar]
- Shahid, R.; Bertazzon, S. Local spatial analysis and dynamic simulation of childhood obesity and neighbourhood walkability in a major Canadian city. AIMS Public Health 2015, 2, 616–637. [Google Scholar] [CrossRef]
- Statistics Canada. Census Profile. Available online: http://www12.statcan.gc.ca/census-recensement/2011/dp-pd/prof/index.cfm?Lang=E (accessed on 23 May 2017).
- CBE (Calgary Board of Education). School Walk Zones, Building and Modernizing Schools 2017. Available online: http://www.cbe.ab.ca/schools/building-and-modernizing-schools/Pages/school-walk-zones.aspx(accessed on 23 May 2017).
- City of Calgary. City of Calgary’s Open Data 2017. Available online: https://data.calgary.ca/ (accessed on 23 February 2017).
- Environmental System Research Institute 2017 (ESRI). Available online: http://www.esri.com/ (accessed on 7 June 2017).
- Statistics Canada. Census Dictionary, Census Year 2011, Online Catalogue No. 98-301-X 2012. Available online: http://www5.statcan.gc.ca/olc-cel/olc.action?ObjId=98-301-X&ObjType=2&lang=en&limit=0 (accessed on 10 March 2017).
- Calgary Region Airshed Zone 2017 (CRAZ). Available online: http://www.craz.ca (accessed on 7 June 2017).
- DeMers, M.N. Geographic Information Systems in Action 2017, 1st ed.; Wiley: New York, NY, USA, 2017; ISBN 978-119-22737-3. [Google Scholar]
- McGrew, J.C., Jr.; Monroe, C.B. An Introduction to Statistical Problem Solving in Geography 2009, 2nd ed.; Waveland Press Inc.: Long Grove, IL, USA, 2009. [Google Scholar]
- Air Quality Health Index. Environment & Climate Change Canada 2017. Available online: http://www.ec.gc.ca/cas-aqhi/default.asp?lang=En&n=CB0ADB16-1 (accessed on 17 May 2017).
- U.S. Environmental Protection Agency (U.S. EPA). Integrated Science Assessment (ISA) of Ozone and Related Photochemical Oxidants; Final Report, February 2013; U.S. Environmental Protection Agency: Washington, DC, USA, 2013.
- Wang, S.; Sun, L.; Rong, J.; Yang, Z. Transit Traffic Analysis Zone Delineating Method Based on Thiesssen Polygon. Sustainability 2014, 6, 1821–1832. [Google Scholar] [CrossRef]
- Lee, B.-J.; Kim, B.; Lee, K. Air Pollution Exposure and Cardiovascular Disease. Toxicol. Res. 2014, 30, 71–75. [Google Scholar] [CrossRef] [PubMed]
- Adams, M.D.; Yiannakoulias, N.; Kanaroglou, P.S. Air pollution exposure: An activity pattern approach for active transportation. Atmos. Environ. 2016, 140, 52–59. [Google Scholar] [CrossRef]
- The City of Calgary. Average Daily (24 h) Weekday Traffic Volume Downtwon 2011. Available online: http://www.calgary.ca/Transportation/TP/Documents/data/traffic_flow_maps/2011_flowmap_DT.pdf (accessed on 30 May 2017).
- Lawson, F.; Schuurman, N.; Amram, O.; Nathens, A.B. A geospatial analysis of the relationship between neighbourhood socio-economic status and adult severe injury in Greater Vancouver. Inj. Prev. 2015, 21, 21–265. [Google Scholar] [CrossRef] [PubMed]
- Grigsby-Toussaint, D.; Chi, S.-H.; Fiese, B.H. Where they live, how they play: Neighborhood greenness and outdoor physical activity among preschoolers. Int. J. Health Geogr. 2011, 10, 66. [Google Scholar] [CrossRef] [PubMed]
- Finn, K.; Johannsen, N.; Specker, B. Factors associated with physical activity in preschool children. J. Pediatr. 2003, 140, 81–85. [Google Scholar] [CrossRef] [PubMed]
- Abley, S.; Williams, R. Public Transport Accessibility Levels. In Proceedings of the IPENZ Transportation Group Conference, New Plymouth, New Zealand, 2–5 November 2008. [Google Scholar]
- Mamun, S.A.; Lownes, N. A Composite Index of Public Transit Accessibility. J. Public Transp. 2011, 14, 69–87. [Google Scholar] [CrossRef]
- Tuan, V.A.; Son, D.T. Accessibility to Public Transport Systems in Developing Countries—An Empirical Study in Ho Chi Minh City, Vietnam. J. East. Asia Soc. Transp. Stud. 2015, 11, 1240–1258. [Google Scholar]
- Weinberger, R.; Sweet, M.N. Integrating walkability into planning practice, Transportation Research Record. J. Transp. Res. Board 2012, 2322, 20. [Google Scholar] [CrossRef]
- Larsen, K.; Gillilsnf, J.; Hess, P.M. Route-based analysis to capture the environmental influences on child’s mode of travel between home and school. Ann. Assoc. Am. Geogr. 2011, 102, 1348–1365. [Google Scholar] [CrossRef]
- McCormack, G.R.; Shiell, A.; Giles-Corti, B.; Begg, S.; Veerman, J.L.; Geelhoed, E.; Amarasinghe, A.; Emery, J.C.H. The association between sidewalk length and walking for different purposes in established neighborhoods. Int. J. Behav. Nutr. Phys. Act. 2012, 9, 92. [Google Scholar] [CrossRef] [PubMed]
- Winters, M.; Teschke, K.; Brauer, M.; Fuller, D. Bike Score®: Associations between urban bikability and cycling behavior in 24 cities. Int. J. Behav. Nutr. 2016, 13. [Google Scholar] [CrossRef]
- Fletcher, R. ‘Something’s wrong here’: Parents pan CBE plan to have more kids use Calgary Transit. CBC News Calgary. 30 May 2017. Available online: http://www.cbc.ca/news/canada/calgary/school-bus-calgary-transit-parents-meeting-1.4137387 (accessed on 7 June 2017).
- De Nazelle, A.; Fruin, S.; Westerdahl, D.; Martinez, D.; Ripoll, A.; Kubesch, N.; Nieuwenhuijsen, M. A travel mode comparison of commuters’ exposure to air pollutants in Barcelona. Atmos. Environ. 2012, 59, 151–159. [Google Scholar] [CrossRef]