An epigenome-wide association study (EWAS) is an examination of a genome-wide set of quantifiable epigenetic marks, such as DNA methylation, in different individuals to derive associations between epigenetic variation and a particular identifiable phenotype/trait. When patterns change such as DNA methylation at specific loci, discriminating the phenotypically affected cases from control individuals, this is considered an indication that epigenetic perturbation has taken place that is associated, causally or consequentially, with the phenotype.
- epigenetic variation
- ewas
- methylation
1. Background
The epigenome is governed by both genetic and environmental factors, causing it to be highly dynamic and complex. Epigenetic information exists in the cell as DNA and histone marks, as well as non-coding RNAs. DNA methylation (DNAm) patterns change over time, and vary between developmental stage and tissue type. The main type of DNAm is at cytosines within CpG dinucleotides which is known to be involved in gene expression regulation. DNAm pattern changes have been extensively studied in complex diseases such as cancer and diabetes.[1] In a normal cell, the bulk genome is highly methylated at CpGs whereas CpG islands (CPI) at gene promoter regions remain highly methylated. Aberrant DNAm is the most common type of molecular abnormally in cancer cells, where the bulk genome because globally ‘hypomethylated’ and CPIs in promoter regions become ‘hypermethylated’, usually leading to silencing of tumour suppressor genes.[2] More recently, studies on diabetes have uncovered further evidence to support an epigenetic component of diseases, including differences in disease-associated epigenetic marks between monozygotic twins, the rising incidence of type 1 diabetes in the general population, and developmental reprogramming events in which in utero or childhood environments can influence disease outcome in adulthood.[1]
Post-translational histone modifications include, but are not limited to, methylation, acetylation and phosphorylation on the core histone tails. These post-translational modifications are read by proteins that can then modify the chromatin state at that locus.[1] Epigenetic variation arises in three distinct ways; it can be inherited and be therefore present in all cells of the adult including the germline (a process known as transgenerational epigenetic inheritance; a controversial phenomenon that has not yet been observed in humans); it can occur randomly and be present in a subset of cells in the adult, the amount of which depending on how early in development the variation occurs; or it can be induced as a result of behavioural or environmental factors.[1] EWAS has previously associated changes in methylation with several diseases and complex conditions which do not have a known epidemiology and therefore are crucial for the identification of epigenetic factors that contribute to or are a consequence of pathogenesis of these diseases.[3]
2. Methods
2.1. Types of Study Designs
Retrospective (case-control)
Retrospective studies compare unrelated individuals who fall into two categories, controls without the disease or phenotype of interest, and cases who have the phenotype of interest. An advantage of such studies is that many cohorts of case-control samples already exist with available genotype and expression data that can be integrated with epigenome data. A downside, however, is that they cannot determine whether epigenetic differences are a result of disease-associated genetic differences, post-disease processes or disease-associated drug interventions.[1]
Family studies
Useful to study transgenerational inheritance patterns of epigenetic marks. A main limitation of EWAS is deciphering if a phenotype is associated with epigenetic changes as a result of a variable in question or a result of previous genomic variants leading to epigenetic alterations. Comparisons between parent and offspring genomic and epigenomic data allows one to rule out the possibility that a disease or phenotype is due to genomic variation. A limitation of this study design is that very few cohorts which are large enough exist.[1]
Monozygotic twin studies
Monozygotic twins carry identical genomic information. Therefore, if they are discordant for a particular disease or phenotype it is likely a result of epigenetic differences. However, unless the twins are studied longitudinally it is impossible to determine if epigenetic variation is the cause of or consequence of disease. Another limitation is recruiting a large enough cohort of discordant monozygotic twins with the disease of interest.[1]
Longitudinal cohorts
Longitudinal studies follow a cohort of individuals over an extended period of time, usually from birth or before disease onset. Samples are taken and records are kept over many years, making these studies extremely useful to determine causality of particular phenotypes. Since the same individuals are followed at time points before and after disease onset, it removes the confounding effects of differences between cases and controls. Longitudinal studies are not only useful for risk studies (using DNA samples prior to disease onset), but also in intervention studies using pre- and posttreatment with specific exposures to investigate environmental impacts on the epigenome.[4] A major disadvantage is the long timeline of the studies as well as the expense. Longitudinal studies using disease-discordant monozygotic twins gives the added benefit of ruling out genetic influences on epigenetic variation.[1]
2.2. Tissue of Interest
The tissue specificity of epigenomic marks create another challenge when designing an EWAS. Tissue choice is limited by both accessibility and stability of epigenetic patterning. It is crucial to choose a tissue in which epigenetic marks are variable in the population yet stable over time. If this isn’t possible, it would be required to use multiple serially collected samples from the same individuals to report robust associations with a particular phenotype. EWAS for diseases are often measured using DNA methylation in blood samples because disease-relevant tissues are difficult to obtain. In some cases, the pattern of methylation is not necessarily biologically relevant to the proposed phenotype. The choice of blood also requires stringent analysis and careful interpretation due to variable cell type composition. Choosing a surrogate tissue therefore requires that the interindividual differences correlate between the tissue of interest and the surrogate, but also for the exposure to induce similar changes in both tissues. To date, an underlying issue is that there is no clear evidence that, in general, epigenetic marks respond to environmental exposures in a similar way across tissues.[5]
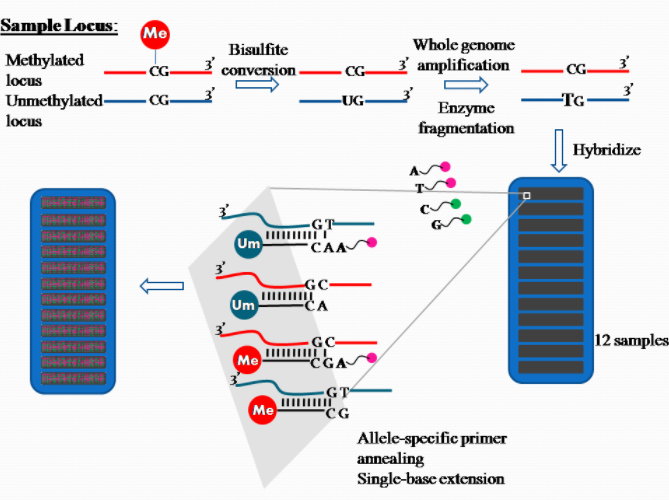
2.3. Quantification Method: DNA Methylation
The platform for epigenome-wide DNAm quantification utilizes the high throughput technology Illumina Methylation Assay. In the past, the 27k Illumina array covered on average two CpG sites in the promoter regions of approximately 14,000 genes and represented less than 0.1% of the 28 million CpG sites in the human genome. This falls short of being representative of the entire human epigenome. None of the early EWAS using this array [6][7] used independent validation to verify the associated probes. An interesting observation was a bias in the differences between cases and controls towards non-CpG island probes (which were significantly underrepresented in this array design), arguing strongly for the use of the latterly designed 450k array which does cover non-CpG islands with a higher density of probes. Presently, the Illumina 450k array is the most widely used platform in the last two years for studies reporting EWAS. The array still only covers less than 2% of the CpG sites in the genome, but does attempt to cover all known genes with a high density of probes in the promoters (including CpG islands and surrounding sequences), but also covers with a lower density across the gene bodies, 3′ untranslated regions, and other intergenic sequences.[8]
3. Data Analysis and Interpretation
3.1. Site-by-Site Analysis
DNA methylation is typically quantified on a scale of 0-1, as the methylation array measures the proportion of DNA molecules that are methylated at a particular CpG site. The initial analyses performed are univariate tests of association to identify sites where DNA methylation varies with exposure and/or phenotype. This is followed by multiple testing corrections and utilizing an analytical strategy to reduce batch effects and other technical confounding effects in the quantification of DNA methylation. The potential confounding effects arising from alterations in tissue composition is also taken into account. Additionally, adjusting for confounding factors such as age, gender and behaviours that may influence the methylation status as covariates is conducted. The association results are also corrected for the genomic control inflation factor in order to account for the population stratification.
Generally, mean levels of CpG methylation are compared across categories using linear regression[9] which allows for the adjustment of confounders and batch effects.[10] A P-value threshold of P < 1e-7[11] is generally used to identify CpGs associated with the tested phenotype/stimulus. These CpGs are considered to reach epigenome-wide significance. An effect size is also calculated at this significance level, indicating the difference in methylation when comparing two qualitative groups, or different quantitative values depending on your phenotype. CpG sites significantly associated with the phenotype and/or treatment/environmental stimulus are typically represented in a manhattan plot.[12]
3.2. Regional Changes Analysis
Single CpG sites are prone to single site natural variation effects and technical variation such as bad microarray probes and outliers. To make more robust associations and take into account such variation, using adjacent measurements can help increase power.[13][14] In previous studies, functionally relevant findings have been associated with genomic regions as opposed to single CpGs. Therefore, looking at the regional level can help identify associated regions with more confidence, guiding downstream functional studies.
3.3. Pre-Clustering or Grouping of CpG Sites
Another method of analysis is using unsupervised clustering to create classes of CpG sites based on similarity of methylation variation across samples. The average methylation values within each class is used to construct data sets of reduced dimensionality, facilitating efficient tests of association between DNA methylation and phenotypes of interest.[15] This is used to reduce the dimensionality of large data sets and take advantage of substantial biologically induced correlation. This method is useful for identifying gross patterns of methylation associated with the tested variable, but may miss specific CpG sites of interest. Besides differences in mean methylation levels, differences in variation of DNA methylation across samples may also be biologically meaningful, motivating scans for differential variability between groups.[12]
3.4. Functional and Gene Set Enrichment
The location of the associated CpG sites or islands/regions can then be analyzed in silico to imply possible functional relevance. For example, considering whether the associated CpGs are within a promoter region or determining distance from the transcription start site that may be relevant, especially when we assume that DNA methylation associated with a phenotype acts by regulating gene transcription. Many other inferences based on past biological knowledge can be inferred if that particular region of CpGs have been studied and associated with changes in transcription. This can be used as an additional filter for identifying regions to pursue for functional validation. Several bioinformatic tools that have been developed for functional enrichment analysis can be applied to differentially methylated regions by first mapping these regions to genes. This is done by mapping the distance between the CpGs and a gene promoter that is potentially regulated by this region. Enrichment analysis based on the genomic region has thus been suggested as a complementary approach and confers substantial interpretive potential.[12] Differentially methylated regions can then be compared to a catalog of genomic regions including, for example, sites enriched for specific chromatin modifications or transcription factor binding sites.
3.5. Methylation Odds Ratio
A methylation odds ratio can be calculated if we consider the mean methylation rate at a site in cases (or controls) to represent the methylation probability for a randomly chosen DNA strand in the case (or control) tissue samples. The methylation odds ratio is the odds for a random DNA strand in the tissue sample from a random case to be methylated, divided by the same odds for controls. This provides a measure of effect size that incorporates relative magnitudes, but also does not allow for the difference between cases and controls of features of the methylation spectrum, such as variance. The methylation odds ratio is also comparable across prospective and retrospective studies and its value only measures association and does not imply causation. Methylation risk scores have also been calculated which can integrate information across CpG sites by calculating a weighted methylation risk score as the sum of methylation values at each of the markers associated with the phenotype, weighted by marker-specific effect size[16]
3.6. Replication
Replication using an independent cohort is required to rule out false positives identified in the initial study. This can be done in a human cohort or in a more focused manner in animal models. It is important that, when selecting the replication cohort, the individuals are reflective of the initial cohort and that the same confounding variables are taken into account. Replication, however, can be limited due to the availability of individuals and samples.
4. Limitations and Concerns
4.1. Causality or Consequence
Variations in the epigenome can cause disease but can also arise as a consequence of disease, and distinguishing between the two is a major limitation in EWAS. A way to circumvent this is to determine whether the epigenetic variation is present before any symptoms of disease, preferably via longitudinal studies following the same cohort of people over many years (this in itself has its own setbacks of expense and study time frame). Also needed to be taken into consideration is the possibility that epigenetic variation which arises before disease onset does not necessarily constitute causation for disease.
4.2. Sample Heterogeneity
The most commonly used tissue an EWAS is blood. However, blood samples contain multiple different cell types each of which have a unique epigenetic signature. In this way, it is extremely difficult to determine if the sample you have taken is homogeneous and is therefore difficult to determine if the variation in epigenetic marks are due to the differences in phenotype/stimulus or due to the sample heterogeneity.
4.3. Tissue Availability
Currently many EWAS use blood as a surrogate tissue due to its availability and ease of collection. However, epigenetic changes in the blood may not be associated with the changes in the particular tissue associated with the disease. Many intriguing disorders that could have epigenetic causative factors affect tissues such as brain, lung, heart, etc. However, when studying human patients it is not an option to take these tissues for sampling, and they are therefore left unstudied.
5. Related Database
5.1. EWAS Atlas
EWAS Atlas[17] (http://bigd.big.ac.cn/ewas) is a curated knowledgebase of EWAS that provides a comprehensive collection of EWAS knowledge. Unlike extant data-oriented epigenetic resources, EWAS Atlas features manual curation of EWAS knowledge from extensive publications. In the current implementation, EWAS Atlas focuses on DNA methylation—one of the key epigenetic marks; it integrates a large number of 388,851 high-quality EWAS associations, involving 126 tissues/cell lines and covering 351 traits, 2,230 cohorts and 390 ontology entities, which are completely based on manual curation from 649 studies reported in 495 publications. In addition, it is equipped with a powerful trait enrichment analysis tool, which is capable of profiling trait-trait and trait-epigenome relationships. Future developments include regular curation of recent EWAS publications, incorporation of more epigenetic marks and possible integration of EWAS with GWAS. Collectively, EWAS Atlas is dedicated to the curation, integration and standardization of EWAS knowledge and has the great potential to help researchers dissect molecular mechanisms of epigenetic modifications associated with biological traits.
5.2. EWAS Data Hub
EWAS Data Hub[18] (https://bigd.big.ac.cn/ewas/datahub) is a resource for collecting and normalizing DNA methylation array data as well as archiving associated metadata. The current release of EWAS Data Hub integrates a comprehensive collection of DNA methylation array data from 75 344 samples and employs an effective normalization method to remove batch effects among different datasets. Accordingly, taking advantages of both massive high-quality DNA methylation data and standardized metadata, EWAS Data Hub provides reference DNA methylation profiles under different contexts, involving 81 tissues/cell types (that contain 25 brain parts and 25 blood cell types), six ancestry categories, and 67 diseases (including 39 cancers). In summary, EWAS Data Hub bears great promise to aid the retrieval and discovery of methylation-based biomarkers for phenotype characterization, clinical treatment and health care.
The content is sourced from: https://handwiki.org/wiki/Biology:Epigenome-wide_association_study_(EWAS)
References
- Rakyan, Vardhman K.; Down, Thomas A.; Balding, David J.; Beck, Stephan (2011). "Epigenome-wide association studies for common human diseases". Nature Reviews Genetics 12 (8): 529–541. doi:10.1038/nrg3000. PMID 21747404. http://www.pubmedcentral.nih.gov/articlerender.fcgi?tool=pmcentrez&artid=3508712
- Dawson, Mark A.; Kouzarides, Tony (2012-07-06). "Cancer Epigenetics: From Mechanism to Therapy". Cell 150 (1): 12–27. doi:10.1016/j.cell.2012.06.013. PMID 22770212. http://www.cell.com/cell/abstract/S0092-8674(12)00762-3. Retrieved 2017-03-02.
- Relton, Caroline L.; Smith, George Davey (2010-10-26). "Epigenetic Epidemiology of Common Complex Disease: Prospects for Prediction, Prevention, and Treatment". PLOS Medicine 7 (10): –1000356. doi:10.1371/journal.pmed.1000356. PMID 21048988. http://www.pubmedcentral.nih.gov/articlerender.fcgi?tool=pmcentrez&artid=2964338
- Feinberg, Andrew P.; Irizarry, Rafael A. (2010-01-26). "Stochastic epigenetic variation as a driving force of development, evolutionary adaptation, and disease". Proceedings of the National Academy of Sciences 107 (suppl 1): 1757–1764. doi:10.1073/pnas.0906183107. PMID 20080672. http://www.pubmedcentral.nih.gov/articlerender.fcgi?tool=pmcentrez&artid=2868296
- Beck, Stephan; Rakyan, Vardhman K. (2008-05-01). "The methylome: approaches for global DNA methylation profiling". Trends in Genetics 24 (5): 231–237. doi:10.1016/j.tig.2008.01.006. PMID 18325624. http://www.cell.com/trends/genetics/abstract/S0168-9525(08)00057-7. Retrieved 2017-03-02.
- Teschendorff, Andrew E.; Menon, Usha; Gentry-Maharaj, Aleksandra; Ramus, Susan J.; Gayther, Simon A.; Apostolidou, Sophia; Jones, Allison; Lechner, Matthias et al. (2009-12-18). "An Epigenetic Signature in Peripheral Blood Predicts Active Ovarian Cancer". PLOS ONE 4 (12): –8274. doi:10.1371/journal.pone.0008274. PMID 20019873. Bibcode: 2009PLoSO...4.8274T. http://www.pubmedcentral.nih.gov/articlerender.fcgi?tool=pmcentrez&artid=2793425
- Marsit, Carmen J.; Koestler, Devin C.; Christensen, Brock C.; Karagas, Margaret R.; Houseman, E. Andres; Kelsey, Karl T. (2011-03-20). "DNA Methylation Array Analysis Identifies Profiles of Blood-Derived DNA Methylation Associated With Bladder Cancer". Journal of Clinical Oncology 29 (9): 1133–1139. doi:10.1200/JCO.2010.31.3577. PMID 21343564. http://www.pubmedcentral.nih.gov/articlerender.fcgi?tool=pmcentrez&artid=3083868
- Flanagan, JamesM. (2015-01-01). "Epigenome-Wide Association Studies (EWAS): Past, Present, and Future". in Mukesh Verma (ed.). Cancer Epigenetics. Methods in Molecular Biology. 1238. Springer New York. pp. 51–63. doi:10.1007/978-1-4939-1804-1_3. ISBN 978-1-4939-1803-4. https://semanticscholar.org/paper/f38c9dd8263a6f7fa182912b073b40eaf9b5a769.
- Smyth, Gordon K. (2004). "Linear models and empirical Bayes methods for assessing differential expression in microarray experiments". Stat. Appl. Genet. Mol. Biol 3 (1).
- Johnson, W. Evan; Li, Cheng; Rabinovic, Ariel (2007-01-01). "Adjusting batch effects in microarray expression data using empirical Bayes methods". Biostatistics 8 (1): 118–127. doi:10.1093/biostatistics/kxj037. PMID 16632515. https://dx.doi.org/10.1093%2Fbiostatistics%2Fkxj037
- Lehne, Benjamin; Drong, Alexander W.; Loh, Marie; Zhang, Weihua; Scott, William R.; Tan, Sian-Tsung; Afzal, Uzma; Scott, James et al. (2015). "A coherent approach for analysis of the Illumina HumanMethylation450 BeadChip improves data quality and performance in epigenome-wide association studies". Genome Biology 16: 37. doi:10.1186/s13059-015-0600-x. PMID 25853392. http://www.pubmedcentral.nih.gov/articlerender.fcgi?tool=pmcentrez&artid=4365767
- Michels, Karin B.; Binder, Alexandra M.; Dedeurwaerder, Sarah; Epstein, Charles B.; Greally, John M.; Gut, Ivo; Houseman, E. Andres; Izzi, Benedetta et al. (October 2013). "Recommendations for the design and analysis of epigenome-wide association studies". Nature Methods 10 (10): 949–955. doi:10.1038/nmeth.2632. PMID 24076989. https://dx.doi.org/10.1038%2Fnmeth.2632
- Jaffe, Andrew E.; Murakami, Peter; Lee, Hwajin; Leek, Jeffrey T.; Fallin, M. Daniele; Feinberg, Andrew P.; Irizarry, Rafael A. (2012-02-01). "Bump hunting to identify differentially methylated regions in epigenetic epidemiology studies". International Journal of Epidemiology 41 (1): 200–209. doi:10.1093/ije/dyr238. PMID 22422453. http://www.pubmedcentral.nih.gov/articlerender.fcgi?tool=pmcentrez&artid=3304533
- Hansen, Kasper D.; Langmead, Benjamin; Irizarry, Rafael A. (2012). "BSmooth: from whole genome bisulfite sequencing reads to differentially methylated regions". Genome Biology 13 (10): –83. doi:10.1186/gb-2012-13-10-r83. PMID 23034175. http://www.pubmedcentral.nih.gov/articlerender.fcgi?tool=pmcentrez&artid=3491411
- Langevin, Scott M; Houseman, E Andres; Christensen, Brock C; Wiencke, John K; Nelson, Heather H; Karagas, Margaret R; Marsit, Carmen J; Kelsey, Karl T (July 2011). "The influence of aging, environmental exposures and local sequence features on the variation of DNA methylation in blood". Epigenetics 6 (7): 908–919. doi:10.4161/epi.6.7.16431. PMID 21617368. http://www.pubmedcentral.nih.gov/articlerender.fcgi?tool=pmcentrez&artid=3154431
- Wahl, Simone; Drong, Alexander; Lehne, Benjamin; Loh, Marie; Scott, William R.; Kunze, Sonja; Tsai, Pei-Chien; Ried, Janina S. et al. (2017-01-05). "Epigenome-wide association study of body mass index, and the adverse outcomes of adiposity". Nature 541 (7635): 81–86. doi:10.1038/nature20784. PMID 28002404. Bibcode: 2017Natur.541...81W. http://www.pubmedcentral.nih.gov/articlerender.fcgi?tool=pmcentrez&artid=5570525
- Li M, Zhang Z (2018). "EWAS Atlas: a curated knowledgebase of epigenome-wide association studies[J]. Nucleic acids research". Nucleic Acids Research 47 (D1).
- Xiong Z, Bao Y (2019). "EWAS Data Hub: a resource of DNA methylation array data and metadata. Nucleic acids research". Nucleic Acids Research. doi:10.1093/nar/gkz840. PMID 31584095. https://dx.doi.org/10.1093%2Fnar%2Fgkz840