Transmission electron microscopy DNA sequencing is a single-molecule sequencing technology that uses transmission electron microscopy techniques. The method was conceived and developed in the 1960s and 70s, but lost favor when the extent of damage to the sample was recognized. In order for DNA to be clearly visualized under an electron microscope, it must be labeled with heavy atoms. In addition, specialized imaging techniques and aberration corrected optics are beneficial for obtaining the resolution required to image the labeled DNA molecule. In theory, transmission electron microscopy DNA sequencing could provide extremely long read lengths, but the issue of electron beam damage may still remain and the technology has not yet been commercially developed.
- electron microscopy
- sequencing technology
- single-molecule
1. History
Only a few years after James Watson and Francis Crick deduced the structure of DNA, and nearly two decades before Frederick Sanger published the first method for rapid DNA sequencing, Richard Feynman, an American physicist, envisioned the electron microscope as the tool that would one day allow biologists to "see the order of bases in the DNA chain".[1] Feynman believed that if the electron microscope could be made powerful enough, then it would become possible to visualize the atomic structure of any and all chemical compounds, including DNA.
In 1970, Albert Crewe developed the high-angle annular dark-field imaging (HAADF) imaging technique in a scanning transmission electron microscope. Using this technique, he visualized individual heavy atoms on thin amorphous carbon films.Cite error: Closing </ref> missing for <ref> tag however transmission electron microscopy DNA sequencing technology is still far from being commercially available.[2]
2. Principle
The electron microscope has the capacity to obtain a resolution of up to 100 pm, whereby microscopic biomolecules and structures such as viruses, ribosomes, proteins, lipids, small molecules and even single atoms can be observed.[3]
Although DNA is visible when observed with the electron microscope, the resolution of the image obtained is not high enough to allow for deciphering the sequence of the individual bases, i.e., DNA sequencing. However, upon differential labeling of the DNA bases with heavy atoms or metals, it is possible to both visualize and distinguish between the individual bases. Therefore, electron microscopy in conjunction with differential heavy atom DNA labeling could be used to directly image the DNA in order to determine its sequence.[2][4][5][6]
3. Workflow
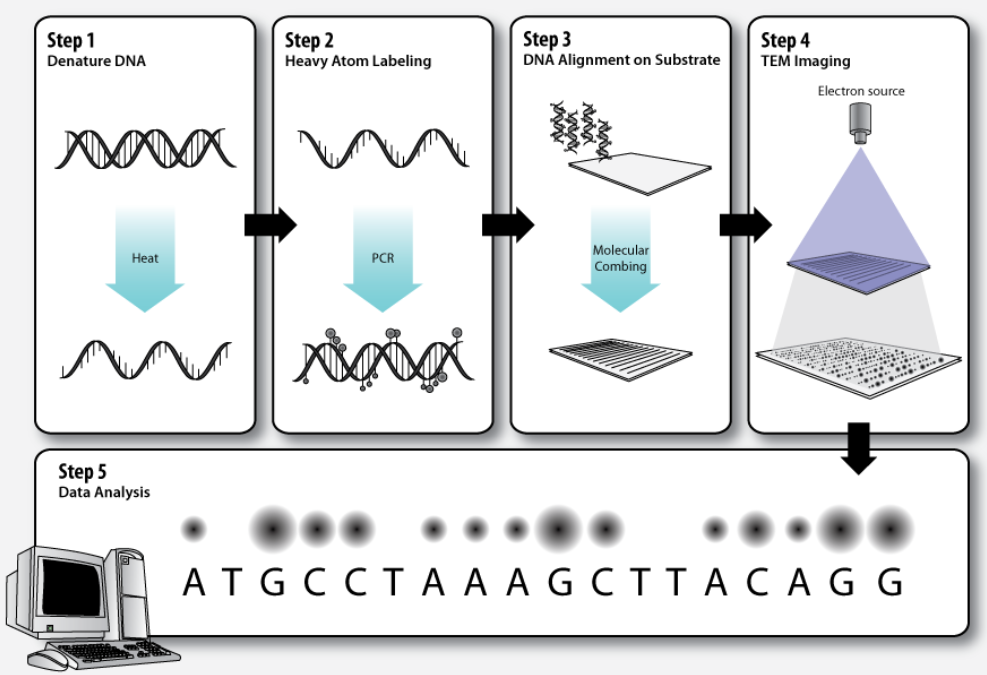
3.1. Step 1 – DNA Denaturation
As in a standard polymerase chain reaction (PCR), the double stranded DNA molecules to be sequenced must be denatured before the second strand can be synthesized with labeled nucleotides.
3.2. Step 2 – Heavy Atom Labeling
The elements that make up biological molecules (C, H, N, O, P, S) are too light (low atomic number, Z) to be clearly visualized as individual atoms by transmission electron microscopy. To circumvent this problem, the DNA bases can be labeled with heavier atoms (higher Z). Each nucleotide is tagged with a characteristic heavy label, so that they can be distinguished in the transmission electron micrograph.
- ZS Genetics proposes using three heavy labels: bromine (Z=35), iodine (Z=53), and trichloromethane (total Z=63). These would appear as differential dark and light spots on the micrograph, and the fourth DNA base would remain unlabeled.
- Halcyon Molecular, in collaboration with the Toste group, proposes that purine and pyrimidine bases can be functionalized with platinum diamine or osmium tetraoxide bipyridine, respectively. Heavy metal atoms such as osmium (Z=76), iridium (Z=77), gold (Z=79), or uranium (Z=92) can then form metal-metal bonds with these functional groups to label the individual bases.[7]
3.3. Step 3 – DNA Alignment on Substrate
The DNA molecules must be stretched out on a thin, solid substrate so that order of the labeled bases will be clearly visible on the electron micrograph. Molecular combing is a technique that utilizes the force of a receding air-water interface to extend DNA molecules, leaving them irreversibly bound to a silane layer once dry.[8][9] This is one means by which alignment of the DNA on a solid substrate may be achieved.
3.4. Step 4 – TEM Imaging
Transmission electron microscopy (TEM) produces high magnification, high resolution images by passing a beam of electrons through a very thin sample. Whereas atomic resolution has been demonstrated with conventional TEM, further improvement in spatial resolution requires correcting the spherical and chromatic aberrations of the microscope lenses. This has only been possible in scanning transmission electron microscopy where the image is obtained by scanning the object with a finely focused electron beam, in a way similar to a cathode ray tube. However, the achieved improvement in resolution comes together with irradiation of the studied object by much higher beam intensities, the concomitant sample damage and the associated imaging artefacts.[10] Different imaging techniques are applied depending on whether the sample contains heavy or light atoms:
- Annular dark-field imaging measures the scattering of electrons as they deflect off the nuclei of the atoms in the transmission electron microscopy sample.[11] This is best suited to samples containing heavy atoms, as they cause more scattering of electrons. The technique has been used to image atoms as light as boron, nitrogen, and carbon;[11] however, the signal is very weak for such light atoms. If annular dark-field microscopy is put to use for transmission electron microscopy DNA sequencing, it will certainly be necessary to label the DNA bases with heavy atoms so that a strong signal can be detected.
- Annular bright-field imaging detects electrons transmitted directly through the sample, and measures the wave interference produced by their interactions with the atomic nuclei. This technique can detect light atoms with greater sensitivity than annular dark-field imaging methods. In fact, oxygen,[12] nitrogen,[12] lithium,[13] and hydrogen[14] in crystalline solids have been imaged using annular bright-field electron microscopy. Thus, it is theoretically possible to obtain direct images of the atoms in the DNA chain; however, the structure of DNA is much less geometric than crystalline solids, so direct imaging without prior labeling may not be achievable.
3.5. Step 5 – Data Analysis
Dark and bright spots on the electron micrograph, corresponding to the differentially labeled DNA bases, are analyzed by computer software.
4. Applications
Transmission electron microscopy DNA sequencing is not yet commercially available, but the long read lengths that this technology may one day provide will make it useful in a variety of contexts.
4.1. De novo Genome Assembly
When sequencing a genome, it must be broken down into pieces that are short enough to be sequenced in a single read. These reads must then be put back together like a jigsaw puzzle by aligning the regions that overlap between reads; this process is called de novo genome assembly. The longer the read length that a sequencing platform provides, the longer the overlapping regions, and the easier it is to assemble the genome. From a computational perspective, microfluidic Sanger sequencing is still the most effective way to sequence and assemble genomes for which no reference genome sequence exists. The relatively long read lengths provide substantial overlap between individual sequencing reads, which allows for greater statistical confidence in the assembly. In addition, long Sanger reads are able to span most regions of repetitive DNA sequence which otherwise confound sequence assembly by causing false alignments. However, de novo genome assembly by Sanger sequencing is extremely expensive and time-consuming. Second generation sequencing technologies,[15] while less expensive, are generally unfit for de novo genome assembly due to short read lengths. In general, third generation sequencing technologies,[6] including transmission electron microscopy DNA sequencing, aim to improve read length while maintaining low sequencing cost. Thus, as third generation sequencing technologies improve, rapid and inexpensive de novo genome assembly will become a reality.
4.2. Full Haplotypes
A haplotype is a series of linked alleles that are inherited together on a single chromosome. DNA sequencing can be used to genotype all of the single nucleotide polymorphisms (SNPs) that constitute a haplotype. However, short DNA sequencing reads often cannot be phased; that is, heterozygous variants cannot be confidently assigned to the correct haplotype. In fact, haplotyping with short read DNA sequencing data requires very high coverage (average >50x coverage of each DNA base) to accurately identify SNPs, as well as additional sequence data from the parents so that Mendelian transmission can be used to estimate the haplotypes.[16] Sequencing technologies that generate long reads, including transmission electron microscopy DNA sequencing, can capture entire haploblocks in a single read. That is, haplotypes are not broken up among multiple reads, and the genetically linked alleles remain together in the sequencing data. Therefore, long reads make haplotyping easier and more accurate, which is beneficial to the field of population genetics.
4.3. Copy Number Variants
Genes are normally present in two copies in the diploid human genome; genes that deviate from this standard copy number are referred to as copy number variants (CNVs). Copy number variation can be benign (these are usually common variants, called copy number polymorphisms) or pathogenic.[17] CNVs are detected by fluorescence in situ hybridization (FISH) or comparative genomic hybridization (CGH). To detect the specific breakpoints at which a deletion occurs, or to detect genomic lesions introduced by a duplication or amplification event, CGH can be performed using a tiling array (array CGH), or the variant region can be sequenced. Long sequencing reads are especially useful for analyzing duplications or amplifications, as it is possible to analyze the orientation of the amplified segments if they are captured in a single sequencing read.
4.4. Cancer
Cancer genomics, or oncogenomics, is an emerging field in which high-throughput, second generation DNA sequencing technology is being applied to sequence entire cancer genomes. Analyzing this short read sequencing data encompasses all of the problems associated with de novo genome assembly using short read data.[18] Furthermore, cancer genomes are often aneuploid.[19] These aberrations, which are essentially large scale copy number variants, can be analyzed by second-generation sequencing technologies using read frequency to estimate the copy number.[18] Longer reads would, however, provide a more accurate picture of copy number, orientation of amplified regions, and SNPs present in cancer genomes.
4.5. Microbiome Sequencing
The microbiome refers the total collection of microbes present in a microenvironment and their respective genomes. For example, an estimated 100 trillion microbial cells colonize the human body at any given time.[20] The human microbiome is of particular interest, as these commensal bacteria are important for human health and immunity. Most of the Earth's bacterial genomes have not yet been sequenced; undertaking a microbiome sequencing project would require extensive de novo genome assembly, a prospect which is daunting with short read DNA sequencing technologies.[21] Longer reads would greatly facilitate the assembly of new microbial genomes.
5. Strengths and Weaknesses
Compared to other second- and third-generation DNA sequencing technologies, transmission electron microscopy DNA sequencing has a number of potential key strengths and weaknesses, which will ultimately determine its usefulness and prominence as a future DNA sequencing technology.
5.1. Strengths
- Longer read lengths: ZS Genetics has estimated potential read lengths of transmission electron microscopy DNA sequencing to be 10,000 to 20,000 base pairs with a rate of 1.7 billion base pairs per day.[2] Such long read lengths would allow easier de novo genome assembly and direct detection of haplotypes, among other applications.[6]
- Lower cost: Transmission electron microscopy DNA sequencing is estimated to cost just US$5,000-US$10,000 per human genome, compared to the more expensive second-generation DNA sequencing alternatives.[5]
- No dephasing: Dephasing of the DNA strands due to loss in synchronicity during synthesis is a major problem of second-generation sequencing technologies. For transmission electron microscopy DNA sequencing and several other third-generation sequencing technologies, sychronization of the reads is unnecessary as only one molecule is being read at a time.[2][6]
- Shorter turnaround time: The capacity to read native fragments of DNA renders complex template preparation an unnecessary step in the general workflow of whole genome sequencing. Consequently, shorter turnaround times are possible.[6]
5.2. Weaknesses
- High capital cost: A transmission electron microscope with sufficient resolution required for transmission electron microscopy DNA sequencing costs approximately US$1,000,000, therefore pursuing DNA sequencing by this method requires a substantial investment.[5]
- Technically challenging: Selective heavy atom labeling and attaching and straightening the labeled DNA to a substrate are a serious technical challenge.[5] Further, the DNA sample should be stable to the high vacuum of electron microscope and irradiation by a focused beam of high-energy electrons.
- Potential PCR bias and artefacts: Although PCR is only being utilized in transmission electron microscopy DNA sequencing as a means to label the DNA strand with heavy atoms or metals, there could be the possibility of introducing bias in template representation or errors during the single amplification.[5]
5.3. Comparison to Other Sequencing Technologies
Many non-Sanger second- and third-generation DNA sequencing technologies have been or are currently being developed with the common aim of increasing throughput and decreasing cost such that personalized genetic medicine can be fully realized.
Both the US$10 million Archon X Prize for Genomics supported by the X Prize Foundation (Santa Monica, CA, USA) and the US$70 million in grant awards supported by the National Human Genome Research Institute of the National Institutes of Health (NIH-NHGRI) are fueling the rapid burst of research activity in the development of new DNA sequencing technologies.[2]
Since different approaches, techniques, and strategies are what define each DNA sequencing technology, each has its own strengths and weaknesses. Comparison of important parameters between various second- and third-generation DNA sequencing technologies are presented in Table 1.
| Platform | Generation | Read length (bp) | Accuracy | Cost per human genome (US$) | Cost of instrument (US$) | Run time (h/Gbp)[2] |
|---|---|---|---|---|---|---|
| Massively parallel pyrosequencing by synthesis | Second | 400–500 | Q20 read length of 40 bases (99% at 400 bases and higher for prior bases) | 1,000,000 | 500,000 | 75 |
| Sequencing by synthesis | Second | 2×75 | Base call with Q30 (>70%) | 60,000 | 450,000 | 56 |
| Bead-based massively parallel clonal ligation based sequencing | Second | 100 | 99.94% | 60,000 | 591,000 | 42 |
| Massively parallel single-molecule sequencing by synthesis | Third | 30–35 | 99.995% at >20×coverage (raw error rate: ≤ 5%) | 70,000 | 1,350,000 | ~12 |
| Single molecule, real time sequencing by synthesis | Third | 1000–1500 | 99.3% at 15×coverage (error rate of a single read: 15–20%) | – | – | <1 |
| Nanopore sequencing | Third | Potentially unlimited? | -- | -- | -- | >20 |
| Transmission electron microscopy single-molecule sequencing (ZS Genetics, Halcyon Molecular) | Third | Potentially unlimited? | -- | ~10,000 | ~1,000,000 | ~14 |
The content is sourced from: https://handwiki.org/wiki/Engineering:Transmission_electron_microscopy_DNA_sequencing
References
- Feynman R. (1959) There's plenty of room at the bottom. Caltech lecture. http://www.zyvex.com/nanotech/feynman.html
- Gupta PK (2008). "Single-molecule DNA sequencing technologies for future genomics research". Trends in Biotechnology 26 (11): 602–11. doi:10.1016/j.tibtech.2008.07.003. PMID 18722683. https://dx.doi.org/10.1016%2Fj.tibtech.2008.07.003
- Campbell NA and Reece JB. (2002) Biology (6th ed.). San Francisco: Benjamin Cummings. ISBN:0-8053-6624-5
- Dear PH (2003). "One by one: Single molecule tools for genomics". Briefings in Functional Genomics and Proteomics 1 (4): 397–416. doi:10.1093/bfgp/1.4.397. PMID 15239886. https://dx.doi.org/10.1093%2Fbfgp%2F1.4.397
- Xu, M et al. (2009). "Perspectives and Challenges of Emerging Single-Molecule DNA Sequencing Technologies". Small 5 (23): 2638–49. doi:10.1002/smll.200900976. PMID 19904762. https://dx.doi.org/10.1002%2Fsmll.200900976
- Schadt EE et al. (2010). "A window into third-generation sequencing". Human Molecular Genetics 19 (R2): R227-40. doi:10.1093/hmg/ddq416. PMID 20858600. https://dx.doi.org/10.1093%2Fhmg%2Fddq416
- Advanced Sequencing Technology Awards 2010. Genome.gov. Retrieved on 2011-02-25. http://www.genome.gov/27541189
- Bensimon A et al. (1994). "Alignment and sensitive detection of DNA by a moving interface". Science 265 (5181): 2096–8. doi:10.1126/science.7522347. PMID 7522347. Bibcode: 1994Sci...265.2096B. https://dx.doi.org/10.1126%2Fscience.7522347
- "Dynamic Molecular Combing: Stretching the Whole Human Genome for High-Resolution Studies". Science 277 (5331): 1518–23. 1997. doi:10.1126/science.277.5331.1518. PMID 9278517. https://semanticscholar.org/paper/b46a1b61c7780792d2ebb5f418d3ee8c87a5df63.
- Haider M et al. (1998). "Electron microscopy image enhanced". Nature 392 (6678): 768. doi:10.1038/33823. Bibcode: 1998Natur.392..768H. https://dx.doi.org/10.1038%2F33823
- error
- Okunishi E et al. (2009). "Visualization of Light Elements at Ultrahigh Resolution by STEM Annular Bright Field Microscopy". Microscopy and Microanalysis 15 (S2): 164–165. doi:10.1017/S1431927609093891. Bibcode: 2009MiMic..15S.164O. https://dx.doi.org/10.1017%2FS1431927609093891
- Oshima Y et al. (2010). "Direct imaging of lithium atoms in LiV2O4 by spherical aberration-corrected electron microscopy". Journal of Electron Microscopy 59 (6): 457–61. doi:10.1093/jmicro/dfq017. PMID 20406731. https://dx.doi.org/10.1093%2Fjmicro%2Fdfq017
- Ishikawa R et al. (2011). "Direct imaging of hydrogen-atom columns in a crystal by annular bright-field electron microscopy". Nature Materials 10 (4): 278–281. doi:10.1038/nmat2957. PMID 21317899. Bibcode: 2011NatMa..10..278I. https://dx.doi.org/10.1038%2Fnmat2957
- "Next-generation DNA sequencing". Nature Biotechnology 26 (10): 1135–45. 2008. doi:10.1038/nbt1486. PMID 18846087. https://dx.doi.org/10.1038%2Fnbt1486
- Durbin, Richard M.; Altshuler, David L.; Durbin, Richard M.; Abecasis, Gonçalo R.; Bentley, David R.; Chakravarti, Aravinda; Clark, Andrew G.; Collins, Francis S. et al. (2010). "A map of human genome variation from population-scale sequencing". Nature 467 (7319): 1061–73. doi:10.1038/nature09534. PMID 20981092. Bibcode: 2010Natur.467.1061T. http://www.pubmedcentral.nih.gov/articlerender.fcgi?tool=pmcentrez&artid=3042601
- Rodruiguez-Revenga L. et al. (2007). "Structural variation in the human genome: the impact of copy number variants on clinical diagnosis". Genetics in Medicine 9 (9): 600–6. doi:10.1097/GIM.0b013e318149e1e3. PMID 17873648. https://dx.doi.org/10.1097%2FGIM.0b013e318149e1e3
- Tucker T et al. (2009). "Massively Parallel Sequencing: The Next Big Thing in Genetic Medicine". The American Journal of Human Genetics 85 (2): 142–54. doi:10.1016/j.ajhg.2009.06.022. PMID 19679224. http://www.pubmedcentral.nih.gov/articlerender.fcgi?tool=pmcentrez&artid=2725244
- Torres EM et al. (2008). "Aneuploidy: Cells Losing Their Balance". Genetics 179 (2): 737–46. doi:10.1534/genetics.108.090878. PMID 18558649. http://www.pubmedcentral.nih.gov/articlerender.fcgi?tool=pmcentrez&artid=2429870
- Savage DC (1977). "Microbial Ecology of the Gastrointestinal Tract". Annual Review of Microbiology 31: 107–33. doi:10.1146/annurev.mi.31.100177.000543. PMID 334036. https://dx.doi.org/10.1146%2Fannurev.mi.31.100177.000543
- "Microbial community profiling for human microbiome projects: Tools, techniques, and challenges". Genome Research 19 (7): 1141–52. 2009. doi:10.1101/gr.085464.108. PMID 19383763. http://www.pubmedcentral.nih.gov/articlerender.fcgi?tool=pmcentrez&artid=3776646