Intensive and prolonged exercise leads to a rise of troponin concentration in blood. The mechanism responsible for troponin release during exercise remains ill-defined. The study aim was to search for risk factors of troponin increase after a prolonged endurance competition. Methods: The study included a group of 18 amateurs, healthy volunteers (median age 41.5 years, interquartile range – IQR 36–53 years, 83% male) who participated in a 100 km running ultra-marathon. Information on demographic characteristics, pre- and post-race heart rate, blood pressure, body composition and glucose, lactate (L), troponin T (hs-TnT) and C reactive protein (hs-CRP) concentration were obtained. Additionally, data on L and glucose levels every 9.2 km and fluid/food intakes during the race were collected. Results: There was a significant hs-TnT increase after the race exceeding upper reference values in 66% of runners (from 5 IQR 3–7 ng/L to 14 IQR 12–26 ng/L, p < 0.0001). None of the baseline parameters predicted a post-race hs-TnT increase. The only factors, correlating with changes of hs-TnT were mean L concentration during the race (rho = 0.52, p = 0.03) and change of hs-CRP concentration (rho = 0.59, p = 0.01). Conclusions: Participation in a 100 km ultra-marathon leads to a modest, but significant hs-TnT increase in the majority of runners. Among analysed parameters only mean lactate concentration during the race and change in hs-CRP correlated with troponin change.
- running
- exercise
- marathon
- troponin
- risk factor
1. Introduction
Regular physical activity leads to many health benefits including cardio-protective activity [1][2]. Recent guidelines of the European Society of Cardiology have increased the recommended weekly volume of moderate to vigorous exercise from 150 min to 210–420 min as optimal cardiovascular prevention [3]. However, there is a group of athletes who far exceed these recommendations by engaging in long-lasting training and ultra-endurance competitions. The effects of these extreme forms of exercise on health are much less studied [2].
Bouts of intensive or long-lasting exercise (such as marathons or ultra-marathons) have been shown to increase blood levels of cardiac troponin, a known selective marker for myocardial injury and a major component of a current diagnosis of myocardial infarction [4][5][6][7]. Troponin rise after exercise is usually discrete with levels returning to reference values within hours [8] and may be accompanied by an increase of natriuretic peptide levels and transient decrease of left or right ventricular systolic function without long-term consequences [9][10][11][12]. In line with that, recent studies with new imaging techniques demonstrated that intensive endurance training does not seem to promote myocardial fibrosis [6][13][14][15].
It is believed that cardiac troponin released after endurance exercise comes from the cytosolic pool and does not signify injury to contractile parts of the cardiomyocytes [4][7]. However, the exact mechanism explaining troponin rise related to physical activity remains ill-defined [4][7]. It has been previously related to athletes age and experience, exercise duration and intensity potentially influencing dehydration, inflammation or pH imbalance during the exercise [4][7]. More detailed knowledge of the risk factors of this form of troponin increase could help in understanding the mechanism behind this phenomenon. They may also improve differential diagnosis in case of post-exercise suspicion of the coronary events in athletes [5][7].
Therefore, we aimed to search for risk factors of troponin increase after participation in a 100 km ultra-marathon in middle-age, amateur healthy runners.
2. hs-TnT Concentration
Subsequently, we have analysed, which of the parameters correlated with the change of hs-TnT concentration (Table 1). Interestingly, this was not the case for any of the analysed baseline demographic, clinical and biochemical parameters. We also did not find any correlation between the delta of hs-TnT and the time of running, running pace, fluid and food intake during the race, changes in body composition or pre-post race changes in L and Glu concentration. The only factor correlating with the change of hs-TnT was the change of hs-CRP.
Table 1. Correlation between change in hs-TnT and analysed parameters.
|
|
hs-TnT Change |
|
|
rho |
p |
|
|
Baseline Parameters |
||
|
Age, yrs |
0.04 |
0.86 |
|
Weekly distance covered, km |
0.23 |
0.34 |
|
Body mass pre, kg |
0.34 |
0.16 |
|
TBW pre, kg |
0.17 |
0.49 |
|
FFM pre, kg |
0.31 |
0.20 |
|
HR pre, bpm |
0.01 |
0.96 |
|
SBP pre, mmHg |
0.04 |
0.86 |
|
DBP pre, mmHg |
0.01 |
0.99 |
|
L, mmol/L |
0.11 |
0.66 |
|
Glu, mg/dL |
-0.26 |
0.28 |
|
Hs-CRP, mg/dL |
0.17 |
0.49 |
|
Hs-TnT, mmol/L |
0.23 |
0.32 |
|
Race Parameters and Post-Race Changes |
||
|
Race time, hours |
0.45 |
0.18 |
|
Pace, min/km |
0.12 |
0.62 |
|
Water intake during the race, ml |
-0.04 |
0.87 |
|
Food intake during the race, kcal |
0.07 |
0.76 |
|
Delta body mass, kg |
0.08 |
0.74 |
|
Delta TBW, kg |
0.31 |
0.20 |
|
Delta FFM, kg |
0.29 |
0.23 |
|
Delta L, mmol/L |
0.30 |
0.21 |
|
Delta Glu, mg/dL |
0.04 |
0.85 |
|
Delta hs-CRP, mg/dL |
0.59 |
0.01 |
DBP—diastolic blood pressure, FFM—ree fatty mass, Glu—glucose, HR- heart rate, L—lactate concentration, SBP—systolic blood pressure, TBW—total body water, hs-TnT—high-sensitivity troponin T.
We have demonstrated that participation in a 100 km marathon leads to a significant increase of hs-TnT beyond upper reference limits in 66% of runners. High-sensitivity troponin T measured with a fourth-generation assay, as in our study, is a cardio-selective marker and its increase is believed to have purely cardiac and not skeletal muscle origin [4]. However, it should be noted, that maximal values of post-race hs-TnT in studied runners remained within low probability range of acute coronary syndrome suspicion [5].
There was no significant change between L values before in comparison to after the race. However, L concentration fluctuated during the race in all runners, with an example demonstrated in Figure 1 affecting mean L concentration during the race rather than post-race L values. Runners with significant hs-TnT increase after the race had more L peaks > 2 mmol/L during the race (median 7 IQR 4–8 vs. 3.5 IQR 2–5, p = 0.04). In consequence, those with mean L concentration during the race above the median of 2.1 mmol/L had a significantly higher increase of hs-TnT (15 IQR 11–19 vs. 8 IQR 7–12 vs. ng/L, p = 0.02) as demonstrated on Figure 2. Mean L concentration during the race correlated with change in hs-TnT (rho = 0.52, p = 0.03).
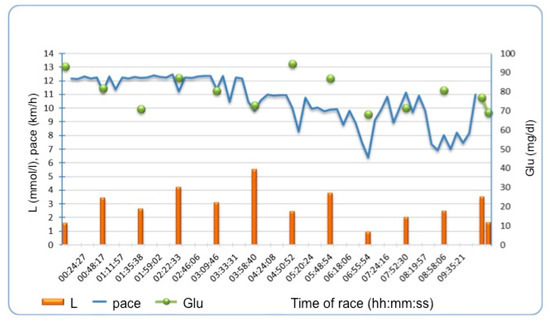
Figure 1. Example of lactate and glucose fluctuations during the race and running pace in one of the runners. L—lactate, Glu- glucose.
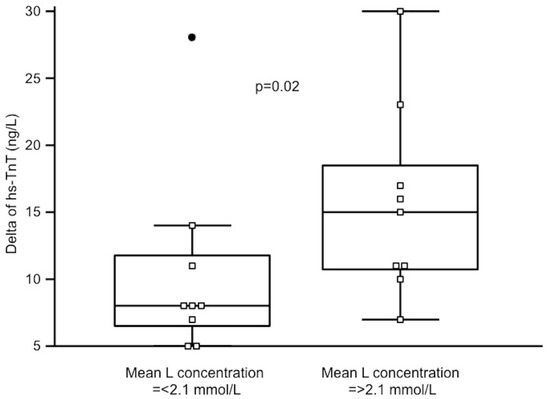
Figure 2. Changes of high-sensitivity TnT (hs-TnT) in runners with mean lactate (L) concentration during the race below and above the median. A black dot on the left is an outstanding result in one of the runners.
Participation in a 100 km ultra-marathon leads to a modest, but significant high-sensitivity troponin T increase in the majority of runners. Among analysed parameters only mean lactic acid concentration and change of high-sensitivity C reactive protein correlated with the change of troponin level.
This entry is adapted from the peer-reviewed paper 10.3390/diagnostics10030167
References
- Haemi Jee; Jaehyun Park; Jae-Gun Oh; Yoon-Hee Lee; Kyung-A Shin; Young-Joo Kim; Effect of a Prolonged Endurance Marathon on Vascular Endothelial and Inflammation Markers in Runners with Exercise-Induced Hypertension. American Journal of Physical Medicine & Rehabilitation 2013, 92, 513-522, 10.1097/phm.0b013e31829232db.
- Ahmed Merghani; Aneil Malhotra; Sanjay Sharma; Press Enter Key For Correspondence Information; The U-shaped relationship between exercise and cardiac morbidity. Trends in Cardiovascular Medicine 2016, 26, 232-240, 10.1016/j.tcm.2015.06.005.
- François Mach; Colin Baigent; Alberico L. Catapano; Konstantinos C. Koskinas; Manuela Casula; Lina Badimon; M. John Chapman; Guy G. De Backer; Victoria Delgado; Brian A. Ference; et al. 2019 ESC/EAS guidelines for the management of dyslipidaemias: Lipid modification to reduce cardiovascular risk. Atherosclerosis 2019, 290, 140-205, 10.1016/j.atherosclerosis.2019.08.014.
- Polly Baker; Todd Leckie; Derek Harrington; Alan Richardson; Exercise-induced cardiac troponin elevation: An update on the evidence, mechanism and implications.. IJC Heart & Vasculature 2019, 22, 181-186, 10.1016/j.ijcha.2019.03.001.
- Roffi, M.; Patrono, C.; Collet, J.P.; Mueller, C.; Valgimigli, M.; Andreotti, F.; Bax, J.J.; Borger, M.A.; Brotons, C.; Chew, D.P.; et al. 2015 ESC Guidelines for the management of acute coronary syndromes in patients presenting without persistent ST-segment elevation: Task Force for the Management of Acute Coronary Syndromes in Patients Presenting without Persistent ST-Segment Elevation of the European Society of Cardiology (ESC). Eur. Heart J. 2016, 37, 267–315.
- Eijsvogels, T.M.; Fernandez, A.B.; Thompson, P.D. Are there deleterious cardiac effects of acute and chronic endurance exercise? Physiol. Rev. 2016, 96, 99–125.
- George A. Stavroulakis; Keith P. George; Exercise-induced release of troponin.. Clinical Cardiology 2020, , , 10.1002/clc.23337.
- Natalie Middleton; Keith George; Greg Whyte; David Gaze; Paul Collinson; Rob Shave; Cardiac Troponin T Release Is Stimulated by Endurance Exercise in Healthy Humans. Journal of the American College of Cardiology 2008, 52, 1813-1814, 10.1016/j.jacc.2008.03.069.
- Valérie Gaudreault; Helena Tizón-Marcos; Paul Poirier; Philippe Pibarot; Philippe Gilbert; Marc Amyot; Josep Rodés-Cabau; Jean-Pierre Després; Olivier Bertrand; Eric LaRose; et al. Transient Myocardial Tissue and Function Changes During a Marathon in Less Fit Marathon Runners. Canadian Journal of Cardiology 2013, 29, 1269-1276, 10.1016/j.cjca.2013.04.022.
- Rachel N. Lord; Victor Utomi; David Oxborough; Bryony Curry; Megan Brown; Keith P. George; Left ventricular function and mechanics following prolonged endurance exercise: an update and meta-analysis with insights from novel techniques.. European Journal of Applied Physiology 2018, 118, 1291-1299, 10.1007/s00421-018-3906-z.
- Cristina Vassalle; Silvia Masotti; Valter Lubrano; Giuseppina Basta; Concetta Prontera; Pietro Di Cecco; Serena Del Turco; Laura Sabatino; Alessandro Pingitore; Traditional and new candidate cardiac biomarkers assessed before, early, and late after half marathon in trained subjects. European Journal of Applied Physiology 2017, 118, 411-417, 10.1007/s00421-017-3783-x.
- Vanessa Martinez; Maria Sanz-De La Garza; Gonzalo Grazioli; Bart H. Bijnens; Jaume Trapé; Gloria Garcia; Pilar Corzan; Angels Clemente; Barbara González; Marta Sitges; et al. Cardiac performance after an endurance open water swimming race. European Journal of Applied Physiology 2019, 119, 961-970, 10.1007/s00421-019-04085-x.
- Sandra Pujadas; Maite Doñate; Chi-Hion Li; Soraya Merchan; Ana Cabanillas; Xavier AlOmar; Guillem Pons-Llado; Ricard Serra-Grima; Francesc Carreras; Myocardial remodelling and tissue characterisation by cardiovascular magnetic resonance (CMR) in endurance athletes. BMJ Open Sport & Exercise Medicine 2018, 4, e000422, 10.1136/bmjsem-2018-000422.
- Łukasz A. Małek; Marzena Barczuk-Falęcka; Konrad Werys; Anna Czajkowska; Anna Mróz; Katarzyna Witek; Matthew K Burrage; Wawrzyniec Bakalarski; Dariusz Nowicki; Danuta Roik; et al. Cardiovascular magnetic resonance with parametric mapping in long-term ultra-marathon runners.. European Journal of Radiology 2019, 117, 89-94, 10.1016/j.ejrad.2019.06.001.
- Łukasz A. Małek; Chiara Bucciarelli-Ducci; Myocardial fibrosis in athletes-Current perspective. Clinical Cardiology 2020, , , 10.1002/clc.23360.