Your browser does not fully support modern features. Please upgrade for a smoother experience.
Please note this is an old version of this entry, which may differ significantly from the current revision.
There are two types of adsorbents, namely, natural and synthetic adsorbents. Several examples of natural adsorbents include clay and zeolite (abundant and cheap). On the other hand, researchers can produce synthetic adsorbents (activated carbon) via agricultural waste, industrial waste, and household waste.
- activated carbon
- adsorption
- zeolite
- dyes
- Langmuir model
- pseudo-second-order kinetic model
1. Introduction
The rapid development of industrial production throughout the globe has been followed by increasing wastewater. The discharge of wastewater (e.g., brine) degrades water quality [1], and thus water cannot be directly used for potable water (via desalination) and industrial applications [2][3]. Wastewater containing pesticides, dyes, phenol, and phenolic compounds may be life-threatening to humans and marine aquatic species, even at low concentrations. Phenols are employed in the manufacture of nylon, resins, and fibers. It is classified as highly toxic due to being carcinogenic in nature [4] and very difficult to degrade through biological methods. Pesticides (including herbicides, insecticides, and fungicides) are used to control pests and cultivate plants [5]. However, they can cause acute and chronic effects on humans and animals. Dyes, described as a colored substance [6], are utilized to impart color in several industries (paper, ink, leather, textiles). Highly colored wastewater should be treated prior to discharge in order to comply with environmental-protection laws. In recent years, numerous techniques [7] have been reported by different researchers from around the globe to remove these pollutants. The advantages of these methods were highlighted such as ozonation (no sludge production), oxidative process (simplicity of application), fenton reagents (high efficiency of water soluble, non-water soluble pollutants), photo chemical degradation (no sludge production), adsorption (high efficiency for removal of different types of dyes and metal ions), ionic exchange (regeneration-no adsorbent loss), electro kinetic coagulation (low cost), irradiation (effective oxidation at lab scale), biological process (ecological feasible) and coagulation/flocculation (low cost). However, some of these techniques have major issues. For example: high sludge production (electro kinetic coagulation), low adsorption capacity (ionic exchange), high costs (irradiation), very slow process (biological process) and Heavy chemical consumption (coagulation/flocculation). The adsorption process (so-called surface phenomenon) has some advantages [8], such as simple design, lower capital cost, and lower operating cost. Recently, researchers have been looking for low-cost adsorbents that can be produced by using agricultural wastes, industrial wastes, and natural materials. The selection of adsorbent mainly depends on factors [9] such as low-cost production, adsorption capacity, re-generability properties, high surface area, and high pore volumes. During the adsorption process, the solute will be deposited onto the adsorbent’s surface due to the forces of attraction [10]. Eventually, it can form a monolayer [8] or multilayer (Figure 1) based on the experimental results. Researchers observed that the adsorption process was spontaneous, a low temperature is favorable, and the concentration of substance will be increased (on the adsorbent surface) over longer timeframes. The adsorption process can be classified into two groups (Figure 2), namely, physical adsorption and chemical adsorption [11].
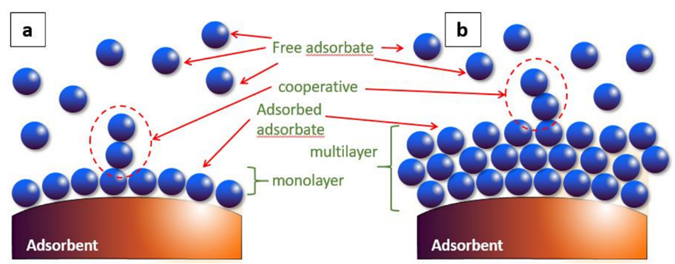
Figure 1. Monolayer (a) and multilayer formation (b) [11].

Figure 2. Physical adsorption (a) and chemical adsorption (b) [11].
2. Types of Adsorbents
There are two types of adsorbents, namely, natural and synthetic adsorbents [12]. Several examples of natural adsorbents include clay and zeolite (abundant and cheap). On the other hand, researchers can produce synthetic adsorbents (activated carbon) via agricultural waste, industrial waste, and household waste. Each of these adsorbents has a unique surface area [13] and porosity structure that enhance the adsorption capacities.
Chitosan can be prepared from chitin (aminopolysaccharide polymer). Chitin occurs in nature (skeletons of crab, shrimp, and lobster), as indicated in Figure 3, contributing to the second most abundant polysaccharide. Chitosan is a non-toxic biopolymer [14], biodegradable, and biocompatible. Chitosan consists of β-(1–4)-D-glucosamine [15], which can be considered a partially deacetylated product of chitin (Figure 4). Chitosan contains nitrogen, in contrast to other polysaccharides, and the hydroxyl group in cellulose is replaced by an amino group at carbon-2 in chitosan (Figure 5) in terms of structure. It has been noted that flake chitosan is a non-porous material with a lower surface area (less than 10 m2/g). Therefore, physical and chemical modifications are required to enhance the surface area and improve the adsorption capacity. Chitosan has been used to remove pollutants due to several advantages [16], such as chemical stability, being the cheapest adsorbent, excellent reactivity (due to hydroxyl and amino groups), and selectivity. The world chitosan market size was USD 1.7 billion in 2019 and is expected to reach USD 4.7 billion in 2027 due to a rapid growth in waste (seafood industry) and full support from the government [17]. Nowadays, the top global chitosan manufacturers include Primex (Siglufjordur, Iceland), AgraTech (New Jersey, United States), Advanced Biopolymers (Haugesund, Norway), NovaMatrix (Sandvika, Norway) and Dainichiseika Color & Chemicals Mfg. Co., Ltd. (Tokyo, Japan), Bioline (Chonburi, Thailand).
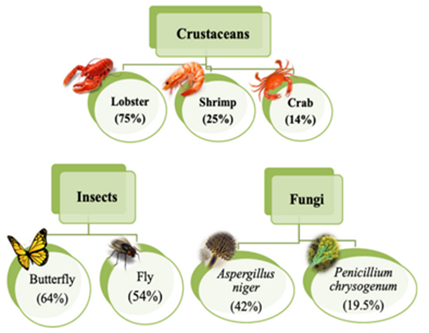
Figure 3. Chitin content can be observed in various sources [15].

Figure 4. Production of chitosan after deacetylation of chitin via alkaline treatment [15].
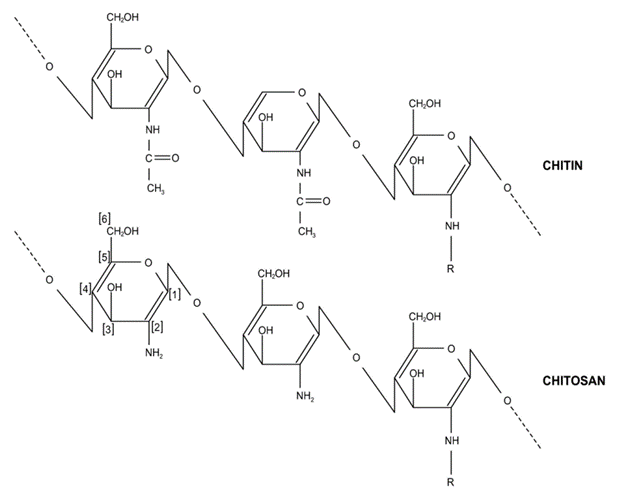
Figure 5. Chemical structure of chitosan and chitin [15].
Fly ash is considered a waste residue from the coal-combustion process and results in water, air, and soil pollution if not treated well [18]. It is deposited in different ways, such as in dry landfills and ash ponds [19]. Fly ash is considered a natural adsorbent and shows unique properties, such as very high carbon content, excellent adsorptive capacity (hydrophilic surface), highly porous structure with a large surface area [20], and large pore volume. In addition, it is composed of SiO2 (93%) and Al2O3 (90.79%) with small amounts of Fe2O3, TiO2, CaO, P2O5, MgO, Na2O, BaO, K2O, SrO, MnO, Cr2O3, and NiO. Some researchers have concluded that fly ash is readily available and cheaper compared to activated carbon. Activated carbon is costly and has high production costs. Experimental results showed that chemically modified fly ash successfully improved the surface area and pore volume, with low energy consumption and better adsorption capacity. For example, the surface area and total pore volume were found to be 4.975 and 45.716 m2/g and 0.0137 and 0.157 cm3/g in raw fly ash and acid-treated (hydrochloric acid) fly ash, respectively [21]. A variety of factors, such as combustion conditions, the type of coal, collector setup, and air–fuel ratio, may have an effect on the properties of fly ash. Experimental findings showed that the average size and bulk density were 20 µm and 0.54–0.86 g/cm3, respectively. Morphology analysis revealed that 70–90% of the particles were solid glassy spheres, while the balance consisted of magnetite, hematite, mullite, quartz, and a small part of unburned carbon. Sanjuan and co-workers [22] studied the morphology of coal fly ash obtained from a coal-fired power station (Spain). Figure 6 indicates the SEM image and particle size distribution of the samples. The scanning electron microscopy (SEM) image showed that the coal fly ash contained many fine particles that were spherically shaped and had a predominantly amorphous structure. Fly ash is fine powder that is a by-product of burning coal in power plant. Most of the fly ash is mainly spherical, produced in high temperature conditions. Particle sizes were in the range of 0.3 µm to 250 µm. The major fraction was observed in the range of 20 µm to 25 µm.
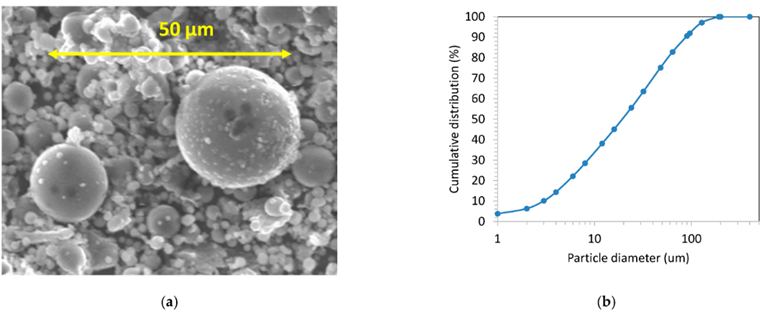
Figure 6. Scanning electron microscopy image (a) and particle size distribution (b) of the coal fly ash [22].
Carbon nanotubes were identified as carbon-based materials [23] and successfully discovered by Sumio Iijima in the 1990s. They can be divided into single-walled (single graphite sheet) carbon nanotubes and multi-walled (multiple concentric) carbon nanotubes [24] based on the number of layers (Figure 7). There are several methods (laser deposition, chemical vapor deposition, and arc discharge method) that can be used to produce carbon nanotubes from different sources (xylene, methane, acetylene, benzene, and carbon monoxide ethylene). Chemical vapor deposition has several advantages (low temperature, economical, and potential for mass production) compared to the arc discharge method (which requires high temperatures such as 900–1200 °C). Danikiewicz and co-workers [25] have produced a multi-walled carbon nanotube using the chemical vapor deposition technique. A high-resolution transmission electron microscopy (HRTEM) image confirmed homogeneity morphology with a diameter of 10 nm. A Raman spectrum showed that three peaks appeared at 1345 cm−1 (structure disorder (D)), 1576 cm−1 (nanotube graphitization (G)), and 2685 cm−1 (stresses (2D)). Several researchers found that carbon nanotubes were more attractive than activated carbon and clay because of their high selectivity and favorable physico-chemical stability [26]. Other unique properties, such as excellent electric properties, large specific surface area (Table 2), good superior thermal conductivity (2000–6000 W/(m.K)), high elastic modulus (1000–3000 GPa), and high tensile strength (50–100 GPa) were also highlighted. In 2017, the world carbon nanotube market was USD 15.3 billion and is expected to achieve USD 103.2 billion in 2030 [27]. Currently, major global carbon nanotube producers are Arkema SA (multi-walled CNT), Nanocyl SA (multi-walled CNT), Nanoshell LLC (multi-walled CNT), Carbon Solutions Inc. (single-walled CNT), Hyperion Catalysis International (multi-walled CNT), SHOWA DENKO KK (CNT), and Klean Commodities (single-walled CNT).
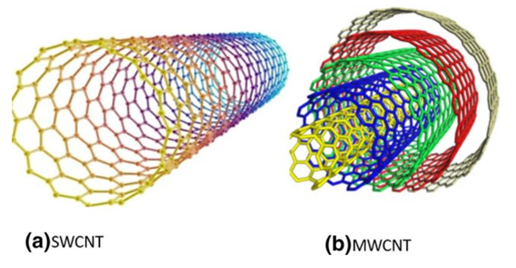
Figure 7. Internal view of single-walled carbon nanotube (SWCNT) and multi-walled nanotube (MWCNT) [24].
Table 2. Physical properties of prepared carbon nanotube.
| Type | Physical Properties |
|---|---|
| Multi-walled carbon nanotube | Pore volume = 0.8 cm3/g |
| Specific surface area = 40–600 m2/g | |
| Outside diameter = 40–60 nm | |
| Core diameter = 5–10 nm [28] | |
| Length = 5–15 µm | |
| Surface area: 1000 m2/g | |
| Microspore volume = 0.5 cm3/g [29] | |
| Surface area = 407–650 m2/g | |
| Average pore width = 2.77 to 2.13 nm [30] | |
| Surface area = 98.7 m2/g | |
| Average pore diameter = 30.9 nm [31] | |
| Pore volume = 0.764 cm3/g | |
| Single-walled carbon nanotube | Surface area = 381 to 1068 m2/g |
| Average bundle size = 10–30 nm [32] | |
| Surface area = 302 m2/g [33] | |
| Pore volume of the bundles = 0.14 cm3/g | |
| Skeletal density = 0.806 g/cm3 | |
| Pore volume = 0.1 cm3/g | |
| Surface area = 911 m2/g | |
| Diameter = 9–25 Å [34] | |
| Surface area = 398 m2/g [35] | |
| Average pore size = 10.8 nm | |
| Pore volume = 0.92 cm3/g |
Activated carbon can be synthesized from any carbonaceous materials (agricultural waste, different parts of the plants, biomass) containing high amounts of carbon and less inorganic content [36]. The obtained activated carbon (powdered, granular, fibers, and extruded form) showed a high surface area and high-porosity structure [37] and can be used to remove pollutants from aqueous solutions. Granular activated carbon can be used in the food and beverage industry, wastewater treatment, and air and gas purification [38]. There is a high demand for the granular form due to its simple regeneration and reusability [39]. On the other hand, powdered activated carbon showed a larger surface-area-to-volume ratio with a particle size less than 0.177 mm. It can be employed for the removal of unwanted odor, taste, and color. Generally, activated carbon can be categorized into three groups, namely, microporous (smaller than 2 nm), mesoporous (2 to 50 nm), and macroporous (more than 50 nm), depending on pore sizes based on the IUPAC definition. During the preparation of activated carbon, there are various types of precursors that can be converted into activated carbon through physical activation (under an inert atmosphere in the carbonization process) and chemical activation (activating agent: acidic, basic, or salt). Octoli and co-workers [40] have produced sago waste-based activated carbon by using different activating agents, such as phosphoric acid, zinc chloride, potassium permanganate, and potassium hydroxide. The textural properties of these activated carbons are highlighted in Table 3. Mistar and co-workers [41] pointed out that the surface area was strongly dependent on the experimental conditions (pyrolysis temperature and weight ratio between carbon and sodium hydroxide (NaOH)). The Bambusa vulgaris-based activated carbon produced by using a weight ratio of 1:1 (carbon to NaOH) at a temperature of 700 °C and at 800 °C showed that the surface area was 308 m2/g and 560 m2/g, respectively. In addition, experimental results revealed that a higher surface area could be obtained when the weight ratio was increased from 1:2 (635 m2/g) to 1:3 (1041 m2/g). It was noted that a similar trend result was observed in the total pore volume as well. When the residual loss of hydrocarbons increased, it resulted in more pores, an increased surface area, and contributed to a bigger pore diameter. Based on Equation (4), NaOH reacted with carbon (C) to produce carbon dioxide (CO2) gas, corroded the carbon wall, and formed new pores.
Table 3. Textural properties of sago wastes-based activated carbon produced by using different chemical activation agents [40].
| Activating Agent | Microporous Volume (cm3/g) | Mesoporous Volume (cm3/g) | Total Pore Volume (cm3/g) | Surface Area (m2/g) | Average Pore Diameter (nm) | Yield (%) | Fixed Carbon (%) | Ash (%) |
|---|---|---|---|---|---|---|---|---|
| KOH | 0.101 | 0.085 | 0.186 | 374.03 | 5.12 | 30.5 | 43.78 | 10.9 |
| H3PO4 | 0.194 | 0.097 | 0.291 | 480.23 | 4.21 | 22.39 | 2.56 | 29.6 |
| Zinc chloride (ZnCl2) | 0.225 | 0.076 | 0.301 | 546.61 | 3.32 | 23.34 | 40.9 | 23.8 |
| Potassium Permanganate (KMnO4) | 0.152 | 0.092 | 0.244 | 274.92 | 4.3 | 29.98 | 14.02 | 26.02 |
Toni and co-workers [42] have reported the influence of zinc chloride on the properties of peat-based activated carbon. The percentage of yield reduced (45.7% to 14.2%), while total carbon increased (87.2% to 96%) with an increase in the carbonizing temperature (723 K to 1073 K). The volatilization process and decomposition of the carbon occurred rapidly (enhanced pore development) when the carbonization temperature was increased. The percentage of yield increased when reducing the impregnation ratio (from 2 to ¼) due to zinc chloride reacting with hydrogen atoms and oxygen atoms to form a water molecule and hydrogen molecule, respectively. However, the mesoporosity structure increased when the impregnation ratio was increased from ¼ (57.9% to 65.5%) to 2 (65.7% to 80.2%). Jiang and co-workers [43] compared the psychical properties of commercial activated carbon and acid-treated carbon (sulfuric acid). Research findings confirmed that BET surface area (1126 to 1234 m2/g), acidic surface oxygen complexes (0.071 to 1.986 meq/g), and mesoporous volume (0.243 to 0.452 mL/g) were increased after the impregnation process (concentrated sulfuric acid). When the treatment temperature was at 250 °C, several observations could be described. These included the opening of micro pores, the destruction of pore walls, and the production of carboxyl and hydroxyl groups.
The world’s activated carbon market volume increased from 2015 (2.7 million metric tons), 2017 (3.4 million metric tons), 2019 (4.3 million metric tons) to 2021 (5.4 million metric tons) due to the environmental regulations [44]. Activated carbon has been used in water treatment (38%), air purification (24%), and food processing (19%). China accounted for the world′s largest consumption [45] of activated carbon in 2020, followed by the United States and Western Europe (Figure 8). Currently, the major activated carbon manufacturers globally include Jacobi Carbons Groups located in Kalmar, Sweden (coconut shell), Kuraray Co. Ltd. Located in Tokyo, Japan (coal and coconut shell), Haycarb (Pvt) Ltd. Located in Chennai, India (coconut shell), General Carbon Corp located in New Jersey, United States (wood, coal, coconut shell), and Cabot Norit located in Amersfoort, The Netherlands and Texas, United States (wood, peat, coconut shell).

Figure 8. Global consumption of activated carbon in 2020 [45].
Zeolite has been used in gas adsorption [46], water treatment, soil amendment, construction, agriculture, petroleum refining, detergent builders, catalysts, and animal feed additives. Zeolite is produced from alumina (AlO5−4) and silica (SiO4−4) via the interlinkage of oxygen atoms [47]. The primary (consisting of the central atom and terminal oxygen) and secondary building blocks (bridging via oxygen–oxygen atoms) can be observed (Figure 9) in zeolites [48]. Generally, zeolite can be classified into natural zeolites (volcanic and sedimentary rocks) and synthetic zeolites, which account for 37% and 63% of the total zeolite consumption, respectively. Currently, China is the largest producer (of natural zeolite) in the world, followed by South Korea and Slovakia.
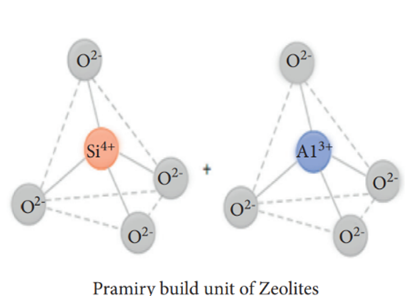
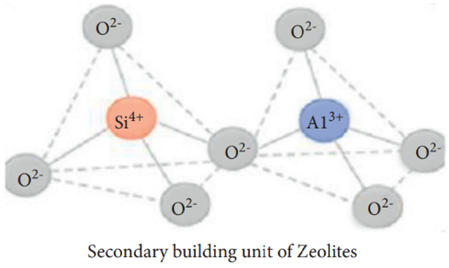
Figure 9. Primary and secondary building units of zeolites [48].
Synthetic zeolite can be produced by using different methods, including hydrothermal, solvothermal, and inothermal methods. Zeolite X and zeolite Y showed a bigger void space with a rigid structure. Zeolite A, produced from sodium aluminosilicate, had an excellent ion-exchange capacity with a specific particle size (4 to 10 µm). Zeolite can be prepared by using natural sources. These zeolites are low in cost and exhibit interesting properties (hydrophilic in nature, highly porous cavities, and specific surface area). In addition, experimental results showed that the size was estimated to be 0.3 to 1 nm, and thermal stability and resistance to acid were increased when the silicon to aluminum ratio was increased [49].
Sometimes, modified zeolite (to improve adsorption capacity) is created in the laboratory through different methods such as physical modification (thermal and ultrasonic modification), chemical modification (by using salt, acid, base, a cationic surfactant, and rare earth), and composite modification. Thermal (muffle or microwave heating) and ultrasonic modification (sound waves) have been observed to reduce surface resistance and eliminate impurities in the pores. Acid has the potential to dissolve impurities in the pores; the H+ ions replaced K+, Ca2+, and Mg2+ in order to increase porosity. In the alkali-modification process, NaOH reduced the ratio of silicon to aluminum and formed a mesoporous structure. Salt modification can be carried out through ammonium chloride, aluminum chloride, sodium chloride, and magnesium chloride. During the modification process, the salt solution removed impurities and exchanged the zeolite cations with cations from the salt solution.
The surfactant-modified zeolite [50] was created by mixing a cationic surfactant with natural zeolite (Figure 10). The negative charge (zeolite surface) could adsorb surfactant cations through electrostatic force when the concentration of surfactant was equal to or smaller than the critical micelle concentration. However, the alkyl chain of the surfactant was attracted via hydrophobic interaction when the concentration of the surfactant exceeded the critical micelle concentration. Eventually, a positive charge was produced on the zeolite to remove anionic contaminants.
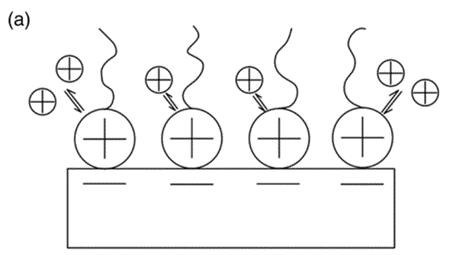
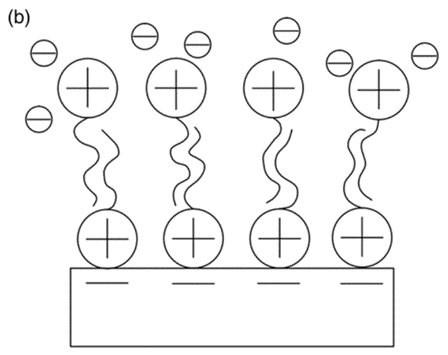
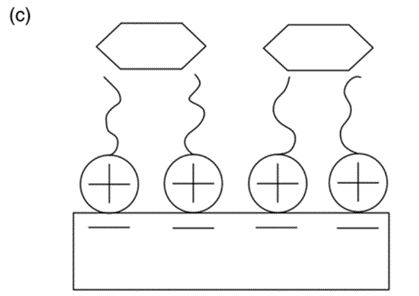
Figure 10. The cationic surfactant on surface of zeolite can remove cation ion (a), anion ion (b), and organic ion (c) [51].
Rare earth modification can be achieved through lanthanum, zirconium, and cerium hydroxide. These zeolites can remove ammonium (cation exchange with zeolite) and phosphate (exchange of the ligand and electrostatic attraction) effectively. Composite modification can be carried out through several techniques. Alkali/acid/salt composite modification can reduce the adsorption period. Zeolite was treated at high temperatures to increase the porosity under heating composite modification. The ultrasound and salt-modification process can dissolve impurities and reduce the reaction time as well [50].
Currently, the largest manufacturing companies [52] include Zeolyst International located in Pennsylvania, United States (zeolite Y, zeolite beta, ZSM-5, ferrierite, Mordenite), Rota Mining Co located in Istanbul, Turkey (clinoptilolite), Clariant located in Bitterfeld, Germany (advanced zeolite powder), W.R. Grace & Co. located in Maryland, United States (zeolite molecular sieves), Zeocem AG, located in Bystre, Slovak Republic (natural zeolite), CWK Chemiewerk Bad Kostritz GmbH, located in Bad Kostritz, Germany (zeolite molecular sieves), Bear River Zeolite Co, located in Montana, United States (natural zeolite), Northern Filter Media Inc located in Lowa, United States (resin zeolite), Grace & Co, located in Worms, Germany (zeolite catalysts), Zeo Inc. located in Texas, United States (natural zeolite), Anten Chemical Co. Ltd. Located in Xiamen, China (zeolite powder), Arkema located in Paris, France (molecular sieves), and ZeoliteMin located in Xiamen, China (natural zeolite).
This entry is adapted from the peer-reviewed paper 10.3390/w14203203
References
- Panagopoulos, A.; Giannika, V. Comparative techno-economic and environmental analysis of minimal liquid discharge (MLD) and zero liquid discharge (ZLD) desalination systems for seawater brine treatment and valorization. Sustain. Energy Technol. Assess. 2022, 53, 102477.
- Panagopoulos, A. Brine management (saline water & wastewater effluents): Sustainable utilization and resource recovery strategy through Minimal and Zero Liquid Discharge (MLD & ZLD) desalination systems. Chem. Eng. Process. 2022, 176, 108944.
- Panagopoulos, A. Techno-economic assessment and feasibility study of a zero liquid discharge (ZLD) desalination hybrid system in the Eastern Mediterranean. Chem. Eng. Process. 2022, 178, 109029.
- Amine, M.; Dora, T.; Ben, S.; Bechir, H. Phenol removal from water by AG reverse osmosis membrane. Environ. Prog. Sustain. Energy. 2015, 34, 982–989.
- Mukherjee, A.; Mehta, R.; Saha, S. Removal of multiple pesticide residues from water by low-pressure thin-film composite membrane. Appl. Water Sci. 2020, 10, 244.
- Nathan, G.; Nishil, M.; Wei, S.; Berry, M.; Tam, C. Dye Removal Using Sustainable Membrane Adsorbents Produced from Melamine Formaldehyde−Cellulose Nanocrystals and Hard Wood Pulp. Ind. Eng. Chem. Res. 2020, 59, 20854–20865.
- Vesna, P.; Sanja, S.; Nesic, A.; Sava, V. Adsorption of azo dyes on polymer materials. Hem. Ind. 2013, 67, 881–900.
- Moosavi, S.; Li, W.; Gan, S.; Zamiri, G.; Omid, A. Application of Efficient Magnetic Particles and Activated Carbon for Dye Removal from Wastewater. ACS Omega 2020, 5, 2684–20697.
- Siyal, A.; Rashid, S.; Low, A.; Nurul, E. A review on recent developments in the adsorption of surfactants from wastewater. J. Environ. Manag. 2020, 254, 109797.
- Mustafa, T.; Sen, T.; Ang, H.; Afrze, S. Dye and its removal from aqueous solution by adsorption: A review. Adv. Colloid Interface Sci. 2014, 209, 172–184.
- Asep, B. Isotherm Adsorption of Carbon Microparticles Prepared from Pumpkin (Cucurbita maxima) Seeds Using Two-Parameter Monolayer Adsorption Models and Equations. Mor. J. Chem. 2020, 8, 745–761.
- Izabela, M.; Dariusz, W.; Aleksandra, S. Experimental investigation into CO2 capture from the cement plant by VPSA technology using zeolite 13X and activated carbon. J. CO2 Util. 2022, 61, 102027.
- Kumar, P.; Ramesh, D.; Karthikeyan, S.; Subramanian, P. Activated carbon production from coconut leaflets through chemical activation: Process optimization using Taguchi approach. Bioresour. Technol. Rep. 2022, 19, 101155.
- John, P.; Santos, M.; Noemi, Z. Synthesis, characterization and application of cross-linked chitosan/oxalic acid hydrogels to improve azo dye (Reactive Red 195) adsorption. React. Funct. Polym. 2020, 155, 104699.
- Silva, A.; Healy, B.; Pinto, L.; Cadaval, T.; Breslin, C. Recent Developments in Chitosan-Based Adsorbents for the Removal of Pollutants from Aqueous Environments. Molecules 2021, 26, 594.
- Paula, M.; Natalia, G.; Taina, K.; Franco, P. Adsorptive removal of basic dye onto sustainable chitosan beads: Equilibrium, kinetics, stability, continuous-mode adsorption and mechanism. Sustain. Chem. Pharm. 2020, 18, 100318.
- Chitosan Market. Available online: https://www.alliedmarketresearch.com/chitosan-market (accessed on 2 September 2022).
- Zhang, X.; Yu, J.; Huang, Y.; Wang, Z. Experimental research on the gaseous PbCl2 adsorption by thermal alkali modified coal fly ash. J. Environ. Chem. Eng. 2022, 10, 107912.
- Bing, Y.; Hu, H.; Biao, F.; Huang, Y.; Liu, H. Condensation and adsorption characteristics of gaseous selenium on coal-fired fly ash at low temperatures. Chemosphere 2022, 287, 132127.
- Xin, Z.; Zhao, H.; Ji, P.; Wang, L.; Hu, X. Effect and mechanisms of synthesis conditions on the cadmium adsorption capacity of modified fly ash. Ecotoxicol. Environ. Safety 2021, 223, 112550.
- Agus, T.; Hidayat, P.; Arif, H. Modified coal fly ash as low cost adsorbent for removal reactive dyes from batik industry. MATEC Web Conf. 2018, 154, 01037.
- Sanjuan, A.; Argiz, C. Fineness of coal fly ash for use in cement and concrete. Fuels 2021, 2, 471–486.
- Jiang, Z.; Kim, J.; John, L.; Barrera, V.; Valery, N. Improving the Dispersion and Integration of Single-Walled Carbon Nanotubes in Epoxy Composites through Functionalization. Nano Lett. 2003, 3, 1107–1113.
- Devi, R.; Gill, S. A squared bossed diaphragm piezoresistive pressure sensor based on CNTs for low pressure range with enhanced sensitivity. Microsyst. Technol. 2021, 27, 3225–3233.
- Danikiewicz, A.; Wolany, W.; Cichocki, D. Carbon nanotubes manufacturing using the CVD equipment against the background of other methods. Arch. Mater. Sci. Eng. 2021, 64, 103–109.
- Rajabi, M.; Moradi, O.; Mahanpoor, K. Removal of dye molecules from aqueous solution by carbon nanotubes and carbon nanotube functional groups: Critical review. RSC Adv. 2017, 7, 47083–47090.
- Carbon Nanotube Market. Available online: https://www.alliedmarketresearch.com/carbon-nanotube-market (accessed on 2 September 2022).
- Nour, T.; Ghadir, A.; Farag, S. Individual and competitive adsorption of phenol and nickel onto multi walled carbon nanotubes. J. Adv. Res. 2015, 6, 405–415.
- Pinero, E.; Amoros, C.; Szostak, K.; Beguin, F.; Delpeux, S. High surface area carbon nanotubes prepared by chemical activation. Carbon 2002, 40, 1597–1617.
- Sang, L.; Lee, S.; Jung, J.; Kim, H. Pore characterization of multi-walled carbon nanotubes modified by KOH. Chem. Phys. Lett. 2005, 416, 251–255.
- Sadeghpour, N.; Vadi, M.; Bagheri, N. Utilizing carbon nanotubes as efficient nanoadsorbent for pantprazole removal from aqueous solution samples: Kinetics, isotherm and thermodynamic studies. J. Chil. Chem. Soc. 2021, 66, 5324–5331.
- Soma, C.; Jayanta, C.; Peng, H.; Chen, Z.; Arnab, M.; Rolf, S. Surface Area Measurement of Functionalized Single-Walled Carbon Nanotubes. J. Phys. Chem. B 2006, 110, 24812–24815.
- Fernando, J.; Isabel, A.; Sandep, A.; Jose, B. Adsorption Equilibria of light organics on single walled carbon nanotube heterogeneous bundles: Thermodynamically aspects. J. Phys. Chem. 2011, 115, 2622–2629.
- Oleg, B.; Liu, J.; Joh, T. Characterization of single wall carbon nanotubes by nonane pre-adsorption. Carbon 2006, 44, 2039–2044.
- Jalil, A.; Karim, A.; Nordin, K.; Hassim, H. Grape-like mesostructured silica nanoparticle decorated single-walled carbon nanotubes: Silica growth and dye adsorptivity. RSC Adv. 2015, 5, 71796–71804.
- Ho, S.M. Removal of dye by adsorption onto activated carbons: Review. Eurasian J. Anal. Chem. 2018, 13, 332–338.
- Ho, S.M. Removal of Dyes from Wastewater by Adsorption onto Activated Carbon: Mini Review. J. Geosci. Environ. Prot. 2020, 8, 120–131.
- Sircar, S.; Rao, M. Activated carbon for gas separation and storage. Carbon 1996, 34, 1–12.
- Reza, M.; Saidur, R.; Yun, C.; Bakar, A. Shammya, Preparation of activated carbon from biomass and its’ applications in water and gas purification, a review. Arab J. Basic Appl. Sci. 2020, 27, 208–238.
- Octolia, T.; Mumfaijah, M.; Allo, Y.K.; Dahlan, K.; Ansanay, Y.O. The Effect of Chemical Activating Agent on the Properties of Activated Carbon from Sago Waste. Appl. Sci. 2021, 11, 11640.
- Mistar, M.; Ahmad, S.; Muslim, A.; Supardan, M. Preparation and characterization of a high surface area of activated carbon from Bambusa vulgaris—Effect of NaOH activation and pyrolysis temperature. IOP Conf. Ser. Mater. Sci. Eng. 2018, 334, 012051.
- Toni, V.; Bergna, D.; Riikk, L.; Romar, H.; Hu, T. Activated Carbon Production from Peat Using ZnCl2: Characterization and Applications. BioResources 2014, 12, 8078–8092.
- Jiang, Z.; Liang, C.; Liu, Y.; You, W.; Han, C.; Li, C. Activated Carbons Chemically Modified by Concentrated H2SO4 for the Adsorption of the Pollutants from Wastewater and the Dibenzothiophene from Fuel Oils. Langmuir 2003, 19, 731–736.
- Global Market Volume Activated Carbon. Available online: https://www.statista.com/statistics/963555/global-market-volume-activated-carbon/ (accessed on 2 September 2022).
- Available online: https://ihsmarkit.com/products/activated-carbon-chemical-economics-handbook.html (accessed on 2 September 2022).
- Pei, Y.; Mo, S.; Xie, Q.; Ma, L.; Lili, H. Stellerite-seeded facile synthesis of zeolite X with excellent aqueous Cd2+ and Ni2+ adsorption performance. Chin. J. Chem. Eng. 2022, in press.
- Chung, K.; Park, D.; Kim, K.; Lee, C. Adsorption equilibria and kinetics of ethane and ethylene on zeolite 13X pellets. Micropor. Mesopor. Mater. 2022, 343, 112199.
- Emami, S.; Razif, H.; Mohd, N.; Zakaria, R. Potential of zeolite and algae in biomass immobilization. BioMed Res. Int. 2018, 6563196.
- Shruti, A.; Kosankar, P. Review on Zeolite Synthesis. Zeichen J. 2020, 6, 395–399.
- Bo, L.; Dong, B.; Fang, C.; Chen, Z.; Zhao, Z. Effective adsorption of methylene blue from aqueous solution by coal gangue-based zeolite granules in a fluidized bed: Fluidization characteristics and continuous adsorption. Powder Technol. 2022, 408, 117764.
- Bo, L.; Dong, B.; Fang, C.; Chen, Z.; Zhao, Z. Effective adsorption of methylene blue from aqueous solution by coal gangue-based zeolite granules in a fluidized bed: Fluidization characteristics and continuous adsorption. Powder Technol. 2022, 408, 117764.
- Zeolites: Chemical Economics Handbook. Available online: https://ihsmarkit.com/products/zeolites-chemical-economics-handbook.html#:~:text=Mainland%20China%20is%20the%20largest,world%20production%20is%20highly%20decentralized (accessed on 2 September 2022).
This entry is offline, you can click here to edit this entry!
