Traffic congestion is a perpetual problem for the sustainability of transportation development. Traffic congestion causes delays, inconvenience, and economic losses to drivers, as well as air pollution. Identification and quantification of traffic congestion are crucial for decision-makers to initiate mitigation strategies to improve the overall transportation system’s sustainability. This study summarizes the current road traffic congestion measures and provides a constructive insight into the development of a sustainable and resilient traffic management system.
- transportation
- road
- traffic
- traffic congestion
- congestion measure
1. Introdution
To quantify the congestion level, numerous congestion measures have been developed considering different performance criteria. Depending on these criteria, the congestion measures can be categorized into five categories: (i) speed, (ii) travel time, (iii) delay, (iv) level of services (LoS), and (v) congestion indices, as shown in Figure 1. Moreover, some measures are used by the DOT-FHWA to quantify the congestion level annually. These federal congestion measures are listed in Section 3.6. The congestion measures employed in other countries may differ from the ones discussed in this paper will be discussed briefly in Section 3.7. Note that the measures presented in this paper are not exhaustive.
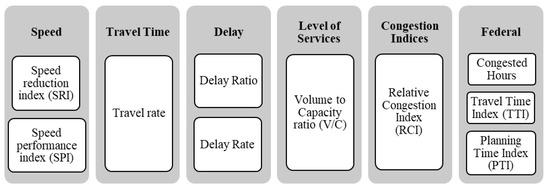
Figure 3. Congestion measures in different categories.
The measures, as mentioned above, were analyzed using real-time traffic datasets to evaluate the practicality and the consistency of each measure in capturing the traffic condition. In this section, the data analysis performed for the assessment of congestion measures is described, along with the results found.
2. Dataset Description
The evaluation of congestion measures was performed with an open-source dataset from the Chicago traffic tracker [1]. This dataset consists of the historical estimated congestion data for over 1,000 traffic segments, starting in approximately March 2018. Traffic congestion on Chicago’s arterial streets (non-freeway streets) in real-time can be estimated by continuously monitoring and analyzing GPS (Global Positioning System) traces received from Chicago Transit Authority (CTA) buses dataset. This dataset contains, speed, vehicle count, and segment length data for every 10 mins for seven consecutive days. For this paper, an entire week of data from 14 March 2018, to 20 March 2018, of one segment (from Michigan to Lake Shore Dr.) was considered. The specific road segment of the collected traffic data is shown in Figure 2a by using Open Street Map in both off-peak (Figure 2b) and peak hours conditions (Figure 2c,d). The traffic condition in Figure 2 was captured at the time of manuscript preparation on 18 December 2019. It is shown in Figure 2 that during an off-peak time, a driver typically needs only two minutes to travel through the road segment. However, during peak hours, a driver is estimated to need three to four minutes to travel through the road segment, depending on the congestion level.
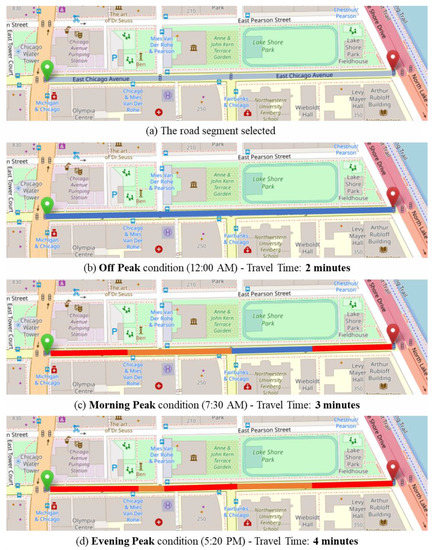
Figure 2. Traffic conditions in the segment from Michigan to Lake Shore Drive on 18 December 2019.
3. Data Analysis
All the congestion measures from Section 3 were implemented on the described dataset to analyze both daily and weekly traffic state at different times. The data for selected daily analysis was collected on 14 March 2018, and the weekly analysis was collected from 14 March 2018, to 20 March 2018.
3.1. Daily Data Analysis
For understanding the traffic congestion at different times of a day, SRI, SPI, travel rate, delay rate, delay ratio, V/C ratio, and RCI were employed to capture traffic conditions on 19 March 2018. The behavior of each measure at different times can be found in Figure 3, where the x-axis represents the time of each day for the day, and the y-axis indicates the congestion index obtained based on different congestion measures. The y-axis in all sub-figures in Figure 3, do not have units as they represent the congestion index. As shown in Figure 3, each sub-figure has a different range of congestion index. The different range of congestion indices complicates the process of comparing various congestion measures.
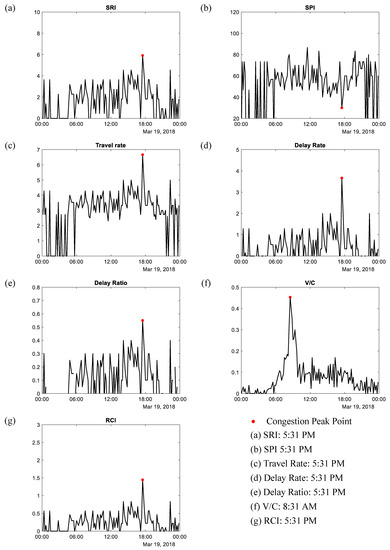
Figure 3. Congestion Measures: (a) SRI, (b) SPI, (c) travel rate, (d) delay rate, (e) delay ratio, (f) V/C, and (g) RCI for a day (19 March 2018).
For each measure, the peak points of different congestion measures for the daily data analysis are summarized in Table 1. It can be summarized that except for the V/C ratio, all the other measures show a similar trend and the peak point at 5:31 PM. For the V/C ratio, the peak point is at 8:31 AM. In addition, it was found that based on these particular days, the road segment index value is 0.45, which indicates less congestion. The average congested hours for the day are 5 h, and the travel time index (TTI) and the planning time index (PTI) values are 1.44 and 1.08, respectively. These numbers imply that the 44% additional travel time is needed compared to free-flow travel time, and the traveler might have to plan for 8% more time while traveling through this road.
Table 1. Peak points of different congestion measures on weekdays.
| Day | Monday | Tuesday | Wednesday | Thursday | Friday | |||||
|---|---|---|---|---|---|---|---|---|---|---|
| Congestion Measures | a.m. | p.m. | a.m. | p.m. | a.m. | p.m. | a.m. | p.m. | a.m. | p.m. |
| SRI | - | 5:31 | - | 5:21 | - | 2:10 | - | 5:31 | - | 4:11 |
| SPI | - | 5:31 | - | 5:21 | - | 2:10 | - | 5:31 | - | 4:11 |
| Travel rate | - | 5:31 | - | 5:21 | - | 2:10 | - | 5:31 | - | 4:11 |
| Delay rate | - | 5:31 | - | 5:21 | - | 2:10 | - | 5:31 | - | 4:11 |
| Delay ratio | - | 5:31 | - | 5:21 | - | 2:10 | - | 5:31 | - | 4:11 |
| V/C | 8:31 | - | 8:51 | - | - | 4:50 | 8:50 | - | 8:40 | - |
| RCI | - | 5:31 | - | 5:21 | 2:10 | - | 5:31 | - | 4:11 | |
3.2. Weekly Data Analysis
The weekly trend of the seven congestion measures is shown in Figure 4, where the x-axis represents the time of each day for an entire week, and the y-axis indicates the congestion index obtained based on different congestion measures. The y-axes in Figure 4 do not have a unit as they represent the congestion index from various congestion measures. It can be noted that each congestion measure has different ranges of congestion index. From Figure 4, it is observed that the trend of measurement values for each day is almost consistent for SRI, SPI, travel rate, delay rate, delay ratio, and RCI, except for the V/C ratio. This is because the SRI, SPI, travel rate, delay rate, delay ratio, and RCI are fundamentally calculated based on the travel speed and time. However, the V/C ratio shows a different perspective of congestion as it compares the volume of vehicles with the roadway capacity. It is also observed that the V/C ratio on Thursday, Saturday, and Sunday is significantly lower than that of the other four days.
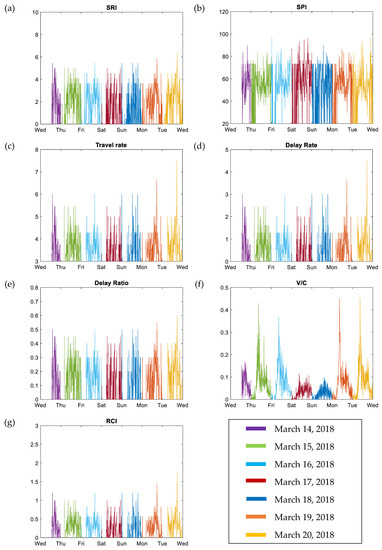
Figure 4. A one-week trend of different congestion measures. (a) SRI, (b) SPI, (c) travel rate, (d) delay rate, (e) delay ratio, (f) V/C, and (g) RCI.
The weekly peak point trend of these measures is also determined, which can be found in Table 1 for weekdays (Monday to Friday) and Table 2 for weekends (Saturday and Sunday). On weekdays Monday to Friday, congestion is observed mostly between peak hours, 6:00 a.m. to 9:00 a.m. and 4:00 p.m. to 7:00 p.m. The peak value for the most measure is found at 5:31 p.m., 5:21 p.m., 2:10 p.m., 5:31 p.m., and at 4:11 p.m. on Monday, Tuesday, Wednesday, Thursday, and Friday, respectively. However, the peak value is found to be different at weekends at 12:10 a.m. and 12:50 p.m. on Sunday, and 10:20 p.m. on Saturday.
Table 4. Peak points of different congestion measures on weekends.
| Day | Saturday | Sunday | ||
|---|---|---|---|---|
| Congestion Measures | a.m. | p.m. | a.m. | p.m. |
| SRI | - | 10:20 | 12:10 | 12:50 |
| SPI | - | 10:20 | 12:10 | 12:50 |
| Travel rate | - | 10:20 | 12:10 | 12:50 |
| Delay rate | - | 10:20 | 12:10 | 12:50 |
| Delay ratio | - | 10:20 | 12:10 | 12:50 |
| V/C | 8:50 | - | - | 2:40 |
| RCI | - | 10:20 | 12:10 | 12:50 |
When analyzing the congestion trend, a different type of trend is observed for the V/C ratio if compared to other measures. For the weekdays, on Monday, Tuesday, Wednesday, Thursday, and Friday, the peak point is at 8:31 a.m., 8:51 a.m., 4:50 p.m., 8:50 a.m., and 8:40 a.m., respectively. Further, on the weekends, the peak point based on the V/C ratio is observed at 8:50 a.m. on Saturday and at 2:40 p.m. on Sunday. The variation in congestion during weekdays and weekends could occur because of the high rate of flow and volume of vehicles on the road on weekdays, which is not typically observed on the weekends.
While measuring congestion with different measures, sometimes negative values may occur for delay rate and delay ratio. This is because the difference between the actual and acceptable travel time can be negative when the actual travel time is less than the acceptable travel time. It typically happens especially at midnight, when fewer vehicles are traveling, and the average vehicle speed is quite high. During this time, no congestion occurs as most cars take lesser time than average travel time. In all the subfigures, the value of zero does not indicate if there is no congestion. Instead, it means that there is no vehicle on the road. From this analysis, it is observed that different congestion measures may have a different numerical value, but they also indicate a consistent congestion level within the range of each measure.
Assuming the daily and weekly data used in the data analysis is the typical (recurring) congestions, the monthly and yearly recurring congestion trend may be similar to the weekly congestion trend in Figure 4. Slight variations of recurring congestions behavior from week to week in a year are expected due to variations in traffic flow, weather conditions, and season changes. In addition, nonrecurring congestions are expected in some days or weeks as well. However, to analyze the nonrecurring condition, additional information on nonrecurring congestions events is required.
3.3. Case Study Discussion
Different congestion measures may have an impact on a decision, for example, whether the current traffic condition should be classified as congested or not, and how bad the congestion level is. From all the seven measures employed in data analysis, some of the discussed measures have a cutoff value for the congestion state, for example, SRI indicates a congestion state when its value exceeds 4 to 5, and for RCI, the congestion state starts from 2. Apart from the congestion state, some measures offer a range of value to different levels of congestions. The SPI and V/C measures provide a set of values to indicate various levels of congestion, as shown in Table 1 and Table 2, respectively. The range of value is often useful in a detailed daily congestion analysis.
Comparing SRI that has a range of 0–10 and SPI that has a scale of 0–100, Table 3 summarized the congested conditions and congestion counts found at different times for each day in a whole week. It can be seen that SPI shows more congested points compared to SRI, although some of these time instants are similar. The reason may be the range of values for SPI is more significant than that of SRI. Thus, SPI shows more instances of the congested period in a day or a week compared to the SRI measure. Based on the data analysis, SPI shows a total of 114 counts of congestion incidents, while SRI showed a total of 57 congestion incidents in a week.
| Day | SRI | Count | SPI | Count | |
|---|---|---|---|---|---|
| Sunday | a.m. | 12:10, 8:20 | 2 | 12:10, 6:40, 8:01, 8:20, 11:20 | 5 |
| p.m. | 7:31, 7:01, 4:50, 2:31, 2:10, 1:40, 12:50 | 7 | 12:50,1:40, 2:10–2:31, 3:31, 4:01, 4:31, 4:50, 5:40, 7:01, 7:31, 9:40 | 11 | |
| Monday | a.m. | - | 12:20, 1:20, 7:31, 4:51, 10:40, 11:50 | 6 | |
| p.m. | 2:10, 3:01, 3:40, 4:40, 5:31, 10:20 | 6 | 1:21, 2:10, 3:01–4:10, 4:40, 5:31–5:50, 6:31–6:40, 10:20 | 7 | |
| Tuesday | a.m. | 6:21,7:21, 10:50 | 3 | 6:01, 6:21, 7:10,7:21, 7:40, 7:51, 10:50, 11:01 | 8 |
| p.m. | 12:31, 2:31, 2:50, 3:31–3:50, 5:01–5:31, 7:50 | 6 | 12:31, 1:10, 2:31, 3:01, 3:31–4:01, 5:01–5:31, 6:10, 7:50, 8:01, 8:20, 8:40, 11:50 | 12 | |
| Wednesday | a.m. | - | - | ||
| p.m. | 2:10, 4:01–4:40, 5:10, 5:40, 6:31 | 5 | 1:10, 2:10–2:21, 3:01, 4:01–4:40, 5:10, 5:21, 5:40, 6:31 | 8 | |
| Thursday | a.m. | 4:10, 8:31–8:40, 10:50, 11:01, 11:40 | 5 | 7:31, 7:40, 8:31, 8:40, 10:01, 10:50, 11:01, 11:40 | 8 |
| p.m. | 1:01, 3:10–3:21, 4:31, 5:31, 6:10, 7:50, 9:01 | 7 | 12:21, 1:01, 1:40, 3:10, 3:21, 3:50, 4:31, 5:10, 5:31, 5:50–6:10, 7:50, 9:01, 9:10 | 13 | |
| Friday | a.m. | 4:01, 6:40–6:50 | 2 | 5:40, 6:40, 6:50, 7:21, 7:51, 8:11, 9:01, 9:21, 10:10 | 9 |
| p.m. | 3:01, 3:30, 4:11, 6:50, 7:50 | 5 | 12:01, 2:31, 3:01, 3:30, 4:11, 5:30, 5:40, 6:40, 6:50, 7:50, 9:20, 11:40 | 12 | |
| Saturday | a.m. | 6:40, 8:01, 11:01,11:10 | 4 | 5:20, 6:40, 8:01, 10:20, 11:01, 11:10 11:40 | 7 |
| p.m. | 3:10, 3:40, 6:10, 9:01, 10:20 | 5 | 2:01, 3:10, 3:40, 5:31, 6:10, 9:01, 10:20, 11:31 | 8 | |
| Total Count | SRI | 57 | SPI | 114 | |
While SPI and SRI may indicate congestion incidents and counts in a period, there are other measures, such as V/C and RCI, that do not indicate any congested period. For RCI, the cutoff value for the congested state is 2, which is not found in Figure 4. Similarly, all values of V/C are less than 0.5, which indicates the normal traffic state. With these measures, the information on the congestion count cannot be directly measured or obtained.
Travel rate, delay rate, relay ratio, road segment index (Ri), and the federal measures do not explicitly provide a range of value, but only a point value, for congested traffic conditions. Nonetheless, the point value may also be handy when comparing daily, weekly, or monthly traffic conditions. The comparison of the road segment congestion index (Ri) and the three federal measures (congested hours, travel time index (TTI), and planning time index (PTI)) for the entire week can be found in Table 3 and Figure 5. In Figure 5, the x-axis represents the time of each day for a total week, and the y-axis indicates the congestion index. The y-axes in Figure 5 do not have units, as each of the y-axis in each sub-figure represents the congestion index. Similar to Figure 3 and Figure 4, all of these measures in Figure 5 also show a higher value for weekdays than weekends, which further indicate a comparatively higher congestion level on the weekdays compared to the weekends.
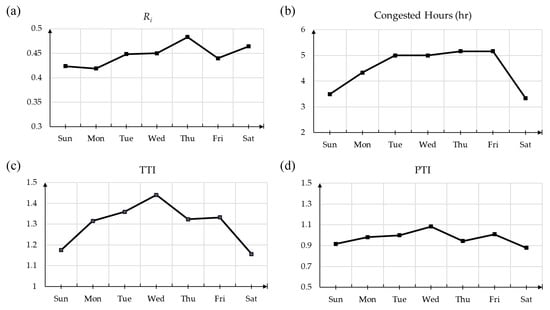
Figure 5. Weekly trends of (a) Ri, (b) congested hours, (c) TTI, and (d) PTI.
Table 3. Road segment index (Ri) and federal measures
| Day | Ri | Congested Hours | TTI | PTI |
|---|---|---|---|---|
| Sunday | 0.42 | 3.5 | 1.17 | 0.91 |
| Monday | 0.41 | 4.3 | 1.31 | 0.98 |
| Tuesday | 0.44 | 5 | 1.35 | 1 |
| Wednesday | 0.45 | 5 | 1.44 | 1.08 |
| Thursday | 0.48 | 5.16 | 1.32 | 0.94 |
| Friday | 0.44 | 5.16 | 1.33 | 1.01 |
| Saturday | 0.46 | 3.33 | 1.15 | 0.88 |
4. Conclusions
Traffic congestion is a global challenge in the development of sustainable and resilient traffic management systems. The currently available traffic congestion measures are categorized into: (i) speed, (ii) travel time, (iii) delay, (iv) level of services (LoS), (v) congestion indices, and (vi) federal approaches. For each category, congestion measures are described with their corresponding equations and quantitative ranges for various congestion levels. A real-time traffic tracker dataset was used to compare the congestion measures. Daily and weekly analysis of congestion were performed for a road segment. From the daily analysis, a similar peak congestion period was observed for different congestion measures. Additionally, the weekly analysis showed a slight difference of peak congestion period from day-to-day. Overall, this study determines current challenges in traffic congestion measurement approaches and provides a new insight towards the development of a sustainable and resilient traffic management system in the long run.
This entry is adapted from the peer-reviewed paper 10.3390/su12114660
References
- Chicago Traffic Tracker—Historical Congestion Estimates by Segment—2018-Current—Data.gov.s. Available online: https://catalog.data.gov/dataset/chicago-traffic-tracker-historical-congestion-estimates-by-segment-2018-current (accessed on 10 October 2019).
