Seismic reflection utilizes sound waves transmitted into the subsurface, reflected at rock boundaries, and recorded at the surface. Interpretation of their travel times and amplitudes are the key for reconstructing various geomorphological features across geological time (e.g., reefs, dunes, and channels). Furthermore, the integration of surface geomorphology technique mapping, such as digital elevation models, with seismic geomorphology can increase land and marine feature modelling and reduce data uncertainty, as well.
- seismic reflection
- quantitative geomorphology
- seismic geomorphology
- earth surface reconstruction
- remote sensing
- imaging
- aerial photogrammetry
- geological mapping
- integrated geomorphology
1. Introduction
-
Understanding the development of seascapes and landscapes in clastic and carbonate settings;
-
Advances in workflows directed toward lithological prediction through the integration of seismic stratigraphy and seismic geomorphology;
-
Revising and improving sequence stratigraphic models;
-
Development of new and increasingly sophisticated analytical techniques.
-
Height, defined as the vertical distance within a sediment conduit from its base to spill point;
-
Top width, defined as the horizontal distance between two spill points;
-
Base width, defined as the horizontal distance between two points in its floor;
-
Cross-sectional area (CSA), defined as the area of a sediment conduit perpendicular to its axis;
-
Aspect ratio, defined as the ratio between width and height of the sediment conduit’s CSA;
-
Sinuosity, defined as the ratio between a reference point and the sediment conduit’s axis;
-
Gradient, calculated from depth changes along the sediment conduit.
2. Seismic Attributes

- (1)
-
Amplitude (reflection strength, RMS amplitude, etc.), waveshape (apparent polarity and maximum peak amplitude), frequency (instantaneous frequency and average zero crossing), attenuation (amplitude slope and attenuation of sensitive bandwidth), phase (instantaneous phase and response phase), correlation (length and average), energy (reflection strength and vibration energy), and ratios (ratio of adjacent peak amplitudes).
- (2)
-
Bright and dim spots (slope of reflection strength), unconformity traps (average correlation), oil and gas bearing anomalies (instantaneous real amplitude), thin layer reservoirs (finite frequency–bandwidth energy), stratigraphic discontinuity (apparent polarity), clastic–carbonate differentiation (ratio of adjacent peak amplitudes), structural discontinuity (maximum–minimum correlation), and lithology pinch-out (cosine of instantaneous phase).
3. Seismic Sedimentology
-
Shale with medium-porosity gas sand.
-
Shale with low-porosity gas sand.
-
Gas sand and wet sand.
-
Wet sand and shale.

-
Good quality geologic-time framework should be in place.
-
Depositional system should be linear with lateral changes in thickness.
-
No significant angular unconformity.

- Volume Rendering and Geobody Extractions
The earth has always been three dimensional (3D). Such dimensions can be acquired using UAV [113] and analyzed for paleo-seismic offset studies (Figure 4). Today, seismic technology is able to image a small portion of the earth using 3D seismic reflection data (primarily for energy purposes) to identify, isolate, and extract seismic anomalies (e.g., geomorphology, reservoirs, fluids, volcanic features, salt, etc.). Volume rendering and the red-green-blue (RGB) blending method as part of the seismic geomorphology technique allow users to interactively blend multiple seismic reflection volumes, identify and isolate areas of interest, and extract any relevant geologic and geomorphologic features from a 3D object called a geobody [25,26,114–121].
In volume rendering, the volume is considered as a semi-transparent medium for each pixel of the screen, and the computation of a volume rendering integral accumulates the voxels’ contribution along a virtual viewing ray [114–117,119–123]. On the other hand, the seismic volume rendering process is a display of all data within a seismic volume at the same time. By rendering a seismic volume and working with the opacity to make it partially opaque (high amplitude) and partially transparent (crossover amplitudes), it is possible to identify hidden structural, geomorphological, or depositional features.
However, at times, it is difficult to identify areas of interest with volume rendering. Therefore, the RGB method is the best option for this situation because it allows for the blending of different seismic attributes, and its opacity scale uses the primary colors (red, green, and blue), which facilitates better visualization of geological and geomorphological features [114].
Furthermore, Chopra and Marfurt [116] suggested that co-rendering seismic attributes (blending two or more seismic attributes) into a single 3D seismic volume could demonstrate the maximum value of volumetric interpretation of seismic reflection data. In addition, a false-color guidance of red-green-blue blending on co-rendering seismic attributes are as follows [116]:
- Red for lower values (less significant geological features).
- Green for intermediate values that represent geological features.
- Blue for higher values that represent more geological features.
After visualizing and isolating a 3D object through seismic volume rendering or RGB blending, the geobody can then be extracted (Figure 5). The volumetric of this geobody can then be calculated, or it can be directly sampled in a geological model as a discrete object to condition the petrophysical modelling. The resulting property can then be used in a similar way as a facies model to condition the petrophysical property models [114,121]. Therefore, the geobody provides anomalous subsurface geological features of interest to rapidly visualize the orientation, geometry, and extent in three-dimensional ways [119]. In addition, this geobody extraction also visualizes the geomorphological features with rock or physical properties from 3D seismic reflection data, and once these features are depth converted (from millisecond to meter), then such metric calculations could be possible with other supporting parameters.
Nowadays, computer technology, as well as the ability to process large-scale seismic reflection data, makes volume rendering and geobody extraction a common tool in the visualization of geology, geophysics, and reservoir features out of 3D seismic reflection data. In addition, volume rendering and geobody extraction provide more realistic subsurface features with some uncertainties based on data resolution and the workflow that was implemented in the study. Nevertheless, geological understanding of the studied area as well as integration with other subsurface datasets (e.g., wells, gravity, magnetic, etc.) are needed for obtaining more geologic interpretations (higher levels of confidence in interpretations) and low uncertainty on the subsurface model.

Figure 4 (a) Digital elevation model with contour lines (0.25 m interval) for R1, R2 and R3. (b) Interpretation of terrace risers and reconstruction of the ~7 m offset. (c) Reconstruction of the ~30 m offset with profiles AA’ and BB’ indicating the variation of elevations values along the rupture trace of the fault [113].

Figure 5. Geobody extraction of deep-water channel-lobe system from seismic geomorphology technique. Note that 3D red-green block is pointing toward the north direction.
- Machine Learning
Seismic reflection interpretation is usually a time-consuming process (especially with low-quality data) when the interpreter analyzes seismic data at a standard industrial workstation. This long process (potentially months) also influences the result, since the interpreter is a human that could have emotional biases when working on a project for long period of time, which might lead to less objectivity. Machine learning in seismic interpretation (seismic geomorphology, in particular) utilizes applied statistics that build computational models using various machine learning techniques such as random forests, decision trees, support-vector machines, convolutional neural networks, deep neural networks, and generative adversarial networks [124–128]. This requires input data that will be processed for training using applied statistics with computational algorithms to produce reliable outputs (Figure 6).
With today’s trend toward digitalization and automation, this process will significantly reduce seismic interpretation to a very short period, possibly hours or minutes depending on the size of the seismic reflection data. Furthermore, the utilization of machine learning in seismic interpretation processes covers most of the subsurface areas, including surfaces, geomorphology and facies interpretation, , faults and fracture interpretation, e.g., [139,142–147], and geological volume-global interpretation, e.g., [128,148–150].
Machine learning in horizon seismic interpretation is an important aspect on identification geomorphology, faults, reservoir, etc. Lou, Zhang, Lin, and Cao [137] introduced that seismic horizons follow the reflector dip, thus having similar instantaneous phase values (the same horizons). Therefore, automatic horizon-interpretation algorithms need to implement the integration between the reflector dip and instantaneous phase attributes [137]. Another type of machine learning on horizon seismic interpretation is utilizing dislocated horizons (faulted, truncated, etc.) where dynamic time warping and unwrapped instantaneous phase-constraint are used to correlate horizon grids in a 3D window [133].
Geomorphological interpretation using 3D seismic reflection data is usually time-consuming, and machine learning with automation processes definitely helps to reduce the working hours of an interpreter. Infante-Paez and Marfurt [134] and La Marca and Bedle [140] presented unsupervised machine learning (self-organizing maps) on identification of deep-water and volcanic seismic facies, geomorphology, and architectural elements. Kumar and Sain [132] presented supervised learning based on an artificial neural network to automate the identification and delineation of mass-transport deposits’ geomorphological surfaces and bodies out of 3D seismic reflection data (offshore).
Manual seismic facies interpretation makes the results very subjective, depending on the experience and knowledge of the interpreter. Zhang, Chen, Liu, Zhang, and Liu [131] presented automatic seismic facies interpretation utilizing deep learning, the convolutional neural network, and encoder–decoder architecture, whereas Singh, Tsvankin, and Naeini [141] utilized Bayesian inference on supervised and semi-supervised deep learning on a shallow marine prograding delta offshore of the Netherlands.
Faults and geological volume interpretations take most of the interpreter’s time in manual 3D seismic interpretation. Wu, Liang, Shi, and Fomel [145] introduced “FaultSeg3D”, an automatic and machine-learning tool that used an end-to-end convolutional neural network to produce an image-to-image fault segmentation. . Furthermore, 3D seismic interpretation is usually done using a 2D interpretation view with dependency on the human interpreter. de Groot [148] and de Groot, et al. [151] introduced “global seismic interpretation” as a seismic volume interpretation where the algorithm correlates amplitude and time lines in the pre-calculated seismic dip field.
Nevertheless, this automation and time reduction produces results that the interpreter needs to validate. We have to keep in mind that machine learning is only a tool that helps interpreters to work effectively and should not be relied on entirely.

Figure 6. Convolutional Neural Network workflow [152].
- Integrated Seismic Geomorphology with Surface Geomorphological Techniques
Seismic geomorphology, which consists of seismic attributes, seismic sedimentology, volume rendering, and geobody extraction, is a unique seismic interpretation method that produces reliable geomorphology (both surface and geobody) out of seismic reflection data. Nevertheless, the integration of surface and subsurface techniques such as digital elevation models (i.e., LIDAR, photogrammetry, and surface outcrops) and seismic geomorphology could lead to reduced data uncertainty and better geological mapping, 3D earth surface imaging (geomorphology), and reconstruction.
This integration could be beneficial for society in various aspects, including mapping and mitigating landslides and earthquake hazards, engineering geology for building, surface-groundwater identification and utilization, city planning (land-use mapping and landscape planning), halt and reverse land degradation, characterization of sustainable energy on the land surface, better environmental management, etc. Seismic reflection data and geology itself are often difficult to correlate [4,153–160]. This is because of the different factors used to describe the two in terms of units, scales, time, and resolutions. In addition, surface data also have different factors compared to subsurface data. Therefore, we propose an integrated workflow that consists of geological fieldwork, remote sensing techniques, quantitative geomorphology, an aerial photogrammetry-based point-cloud (digital outcrop modelling), surface outcrops, LIDAR (surface data), and seismic reflection data (i.e., seismic geomorphology for subsurface data) to bridge the gap between seismic reflection data (geology) and surface outcrops to produce a reliable 3D model of the earth and its geomorphology (Figure 7).
Subsurface data mainly consists of seismic and wellbore data (and other data, e.g., gravity, magnetic, ground-penetrating radar, etc). The surface data is a combination of geological field work data (lithology, faults, geomorphology, etc.) and surface geomorphological techniques, e.g., drone photogrammetry (digital outcrop model), LIDAR, etc. The basic interpretation from this surface geomorphology technique is surface geomorphological feature identification and characterization. This feature usually extends and relates to the subsurface, and the seismic geomorphology technique is needed to image the subsurface and correlate this surface feature with its subsurface counterpart. Since there is a difference domain between two datasets (depth, amplitude values, etc.), an impedance model (consisting of mainly density and velocity data) with facies and a rock model consisting of rock properties (e.g., density, porosity, permeability, etc.) will be a bridge between seismic geomorphology and surface geomorphology (seismic forward modelling). The final surface geomorphology product is a geomorphology volume that could render and extract specific geomorphology feature (Geobody). Furthermore, the seismic geomorphology and geobody need to be compared to produce a reliable 3D model of the earth and its geomorphology. In addition, results from all the techniques will depend on the quality of the data that has limitations as functions of vertical and horizontal data resolutions. Therefore, the results and technological preference are very dependent on data resolution. Nevertheless, all techniques should be implemented in order to reduce the uncertainty coming from the data.
In addition, this kind of integration is also beneficial for reducing the uncertainty that is produced by surface and subsurface data, whereas more accuracy is always needed utilizing updated technology for surface and subsurface data. Finally, our integrated workflow that helps for better geomorphological mapping as well as 3D earth surface imaging and reconstruction could be applicable with available and similar datasets worldwide.
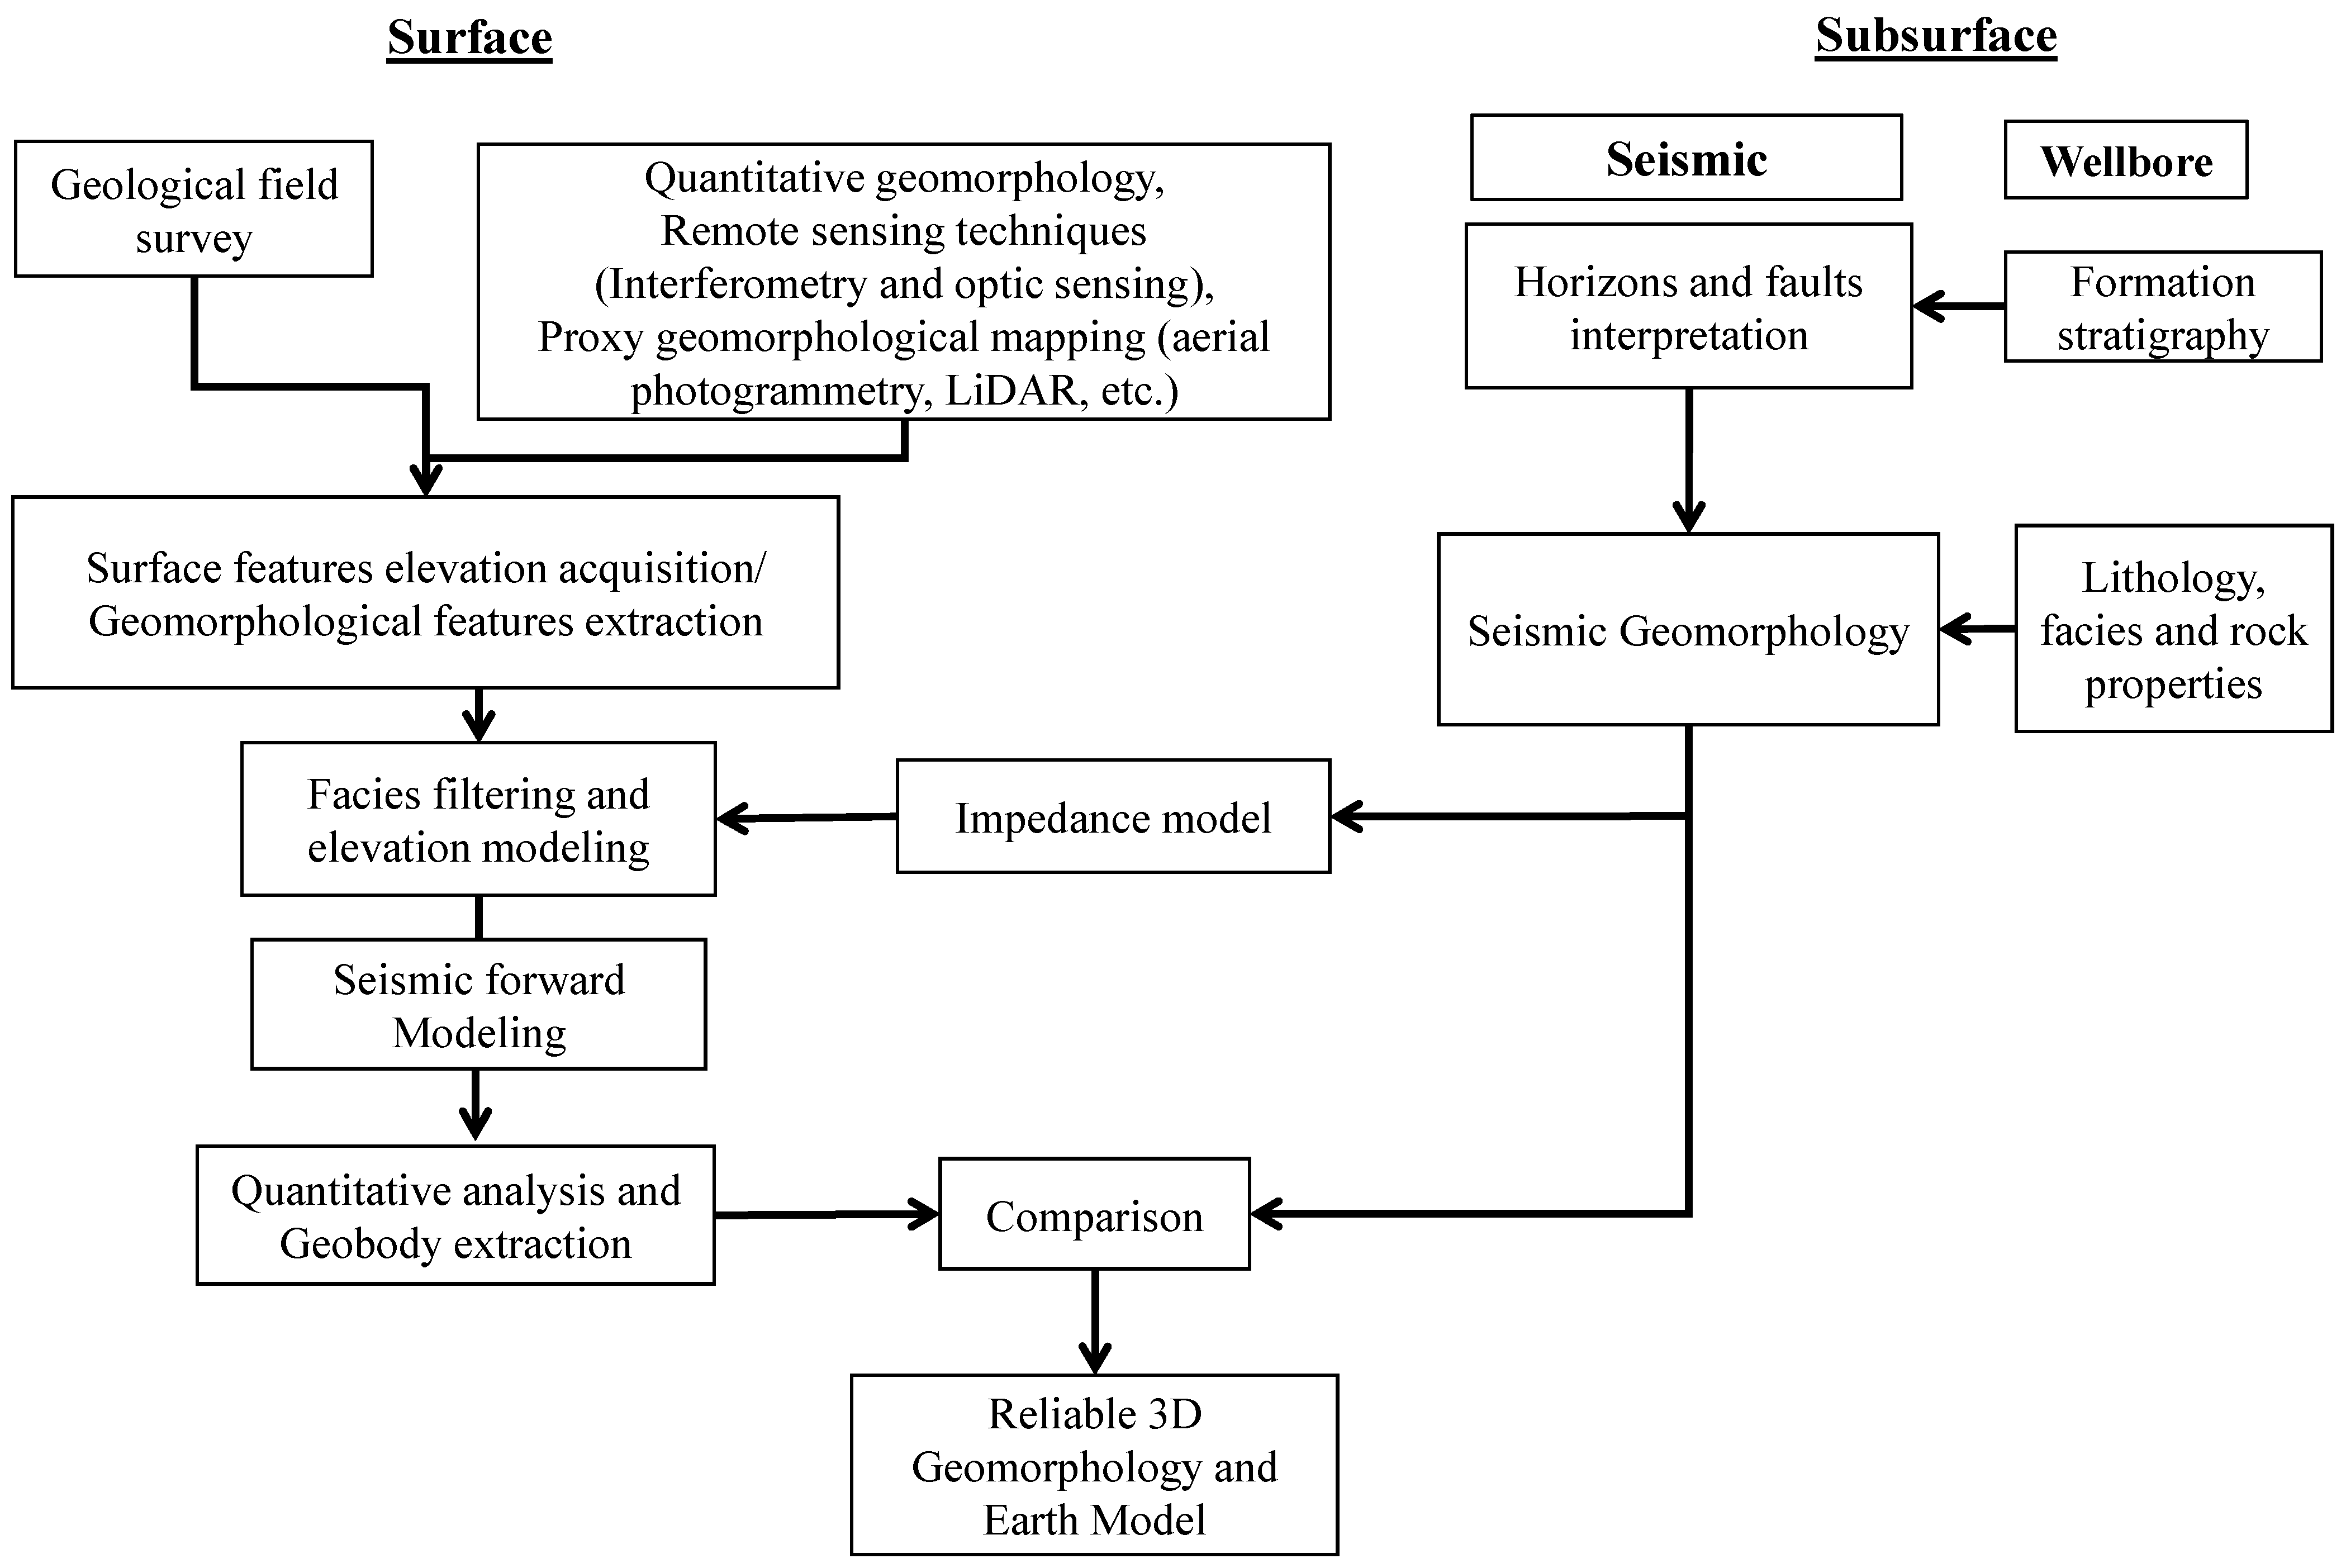
Figure 7. Proposed integrated seismic (with addition of wellbore data, if available) and surface geomorphology workflow for a reliable 3D model of the earth and its geomorphology.
- Discussions and Results Overview
Several seismic and surface geomorphology techniques exist for delineating, identifying, and extracting the geomorphology features from both seismic reflection and surface geomorphology data (Table 2).
The seismic attribute technique (including geometrical attribute: seismic facies) is Therefore, this kind of seismic geomorphology technique is often used in industry and academia since its introduction back in the 1980s. The results offered by this technique really depend on the quality of seismic reflection data together with human knowledge and experience (Table 2). The seismic sedimentology technique is a relatively new technique that deals with thin-bedded geology and geomorphology (Table 2), thus, it needs the human knowledge and experience to provide a good result. Thin-bedded features could be in a range of 2 to 10 m thick with horizontal resolution of the conventional seismic reflection data. This kind of technique is usually ignored when the seismic attributes technique could solve the problem of imaging geomorphological features from seismic reflection data. Furthermore, volume rendering and geobody extraction depend on the availability of 3D seismic reflection data (Table 2). Application of this technique will also be dependent on the objective of the project; it is mainly used for volume calculation of the geological and geomorphological features. The results offered would depend on the quality of the seismic reflection data (Table 2). The machine learning technique could also be applied on the seismic geomorphology technique to speed up the interpretation processes. Nowadays, this kind of technique is often used, but the results offered always need to be validated by human experience and knowledge (Table 2). The surface geomorphology techniques combining a large number of emerging space and proxy-remote sensing technologies are presented as the best techniques used for local, regional, and continental geomorphological studies (Table 3). Such techniques improve the ability to acquire the surface feature of elevation and to extract geomorphological features. In addition, the proliferation of a large number of GEE and GIS software allow for facies filtering and elevation modeling in quantitative analysis and geobody extraction studies, and eventually allowing the development of a reliable 3D geomorphological earth surface model.
Finally, the integration of the seismic and surface geomorphology workflow is proposed to give better results for reconstructing land and marine features (Figure 7 and Table 1). The data quality together with human knowledge and experience will
Table 2. Seismic geomorphology technical analysis.
|
Techniques |
Geomorphological Analysis and Frequency |
Scale and Resolution |
Results |
Ratios (In Time) and References |
|
Seismic attribute |
Most cases, often used |
Vertical (20–30 m) & horizontal (10–20 m) |
Good (Depends on data quality) |
1980s—now, see chapter 3 |
|
Seismic sedimentology |
In special cases (e.g., thin bedded) |
Vertical (2–10 m) & horizontal (10–20 m) |
Good for thin bedded |
2010s—now, see chapter 4 |
|
Volume rendering and geobody extraction |
In special cases (e.g., (3D seismic reflection data) |
Vertical (20–30 m) & horizontal (10–20 m) |
Good (Depends on data quality) |
2000s—now, see chapter 5 |
|
Machine learning |
Becoming often (Last decade) |
Vertical (20–30 m) & horizontal (10–20 m) |
Good (Needs human validation) |
2010s—now, see chapter 6 |
|
Integrated seismic and surface geomorphology |
Not often, lack of reference |
Vertical (2–10 m) & horizontal (10–20 m) |
Better (Reducing result uncertainty) |
Proposed (This study) |
Table 3. Surface geomorphology technical analysis.
|
Techniques |
Geomorphological Analysis |
Scale of Studied Area |
Results |
References |
|
Remote sensing techniques |
Surface Depressions Surface processes Surface deformation |
Local, Reginal, Continental |
Information on the location, distance, and volume |
[59] Muzirafuti et al. 2020 [52] Borzì et al. 2021 [64] Bianco et al. 2021 [65] Randazzo et al. 2020 [67] Cigna et al. 2021 [68] Mantovani et al. 2016 [69] Jiang et al. 2021 [71] Crosetto et al. 2020 [72] van Natijne et al. 2022 [76] |
|
Proxy geomorphological mapping (aerial photogrammetry, LiDAR.) |
Surface and marine processes Surface and marine features |
Regional local |
Information on the location, distance, and volume, 3D models |
Randazzo et al.2020 [67] Anders et al. 2021 [62] Bonasera et al. 2022 [63] Muzirafuti et al. 2021 [73] Deiana et al. 2021 [112] Gao et al. 2017 [113]
|
|
Geological field survey |
Surface and marine processes |
Local |
Information on the location, distance, and volume |
Bonasera et al. 2022 [63] Taufani et al. 2021 [155]
|
|
Quantitative geomorphology |
Marine sedimentary features |
Local |
Information on the location, distance, and volume |
Distefano et al. 2021 [51] Muzirafuti et al. 2021 [73] |
- Conclusions
We presented a review of seismic and surface geomorphology techniques for imaging and reconstructing land and marine geomorphology features, and we have revealed that:
- Seismic geomorphology is a subsurface (including near surface) study that extracts geomorphology features out of 3D seismic reflection data.
- Active proxy of surface geomorphology techniques and remote sensing techniques have huge potential in vertical and horizontal deformation monitoring.
- The reconstruction of high-resolution images of land and marine surface features by surface and subsurface geomorphology techniques is reliable through several techniques, including seismic sedimentology, volume rendering, geobody extraction, quantitative geomorphology approaches, and mapping.
- The integration of surface and subsurface techniques provides more realistic and suitable 3D models of the earth and its geomorphology. In addition, it enhances the interpretation of sedimentary processes, geomorphology, the earth’s surface, the paleoenvironment, economical prospective, natural hazards, etc. Therefore, we propose a workflow that integrates surface and subsurface techniques to provide realistic and acceptable earth models.
Source: Harishidayat, D., Al-Shuhail, A., Randazzo, G., Lanza, S., & Muzirafuti, A. (2022). Reconstruction of Land and Marine Features by Seismic and Surface Geomorphology Techniques. Applied Sciences, 12(19), 9611. doi.org/10.3390/app12199611
This entry is adapted from the peer-reviewed paper 10.3390/app12199611