Energy usage in cities is intertwined with its spatial configuration—the denser and more compact the city, the more concentrated and efficient the energy usage is to be expected. To achieve sustainable communities, cities must reconsider its spatial configurations in the context of rapid urbanisation and growth in light of limited resources and conflicting spatial claims. This entry seeks to understand how spatial configurations affect transport energy usage in cities and propose an integrated assessment approach factoring spatial configurational analysis in relation to transport energy usage at the micro- and macroscale. Comparing Bergen, Norway, and Zürich, Switzerland, findings showed that spatial configurations were positively correlated to transport energy usage. Street structures suitable for walking and less suitable for car traffic tended to exhibit lower amounts of energy usage. Following this, nine typologies of transport and land use patterns are described to support planning for more sustainable means of transport.
- transport energy usage
- sustainable mobility
- space syntax
- natural movement
- natural urban transformation
1. Introduction
Challenges to sustainable development in the form of rapid urbanisation and the emergence of very dense megacities and metropolises have increased pressure on land use and transportation networks and corresponding energy resource limitations [1]. As cities grow, the need to maintain a feasible level of service in the transportation network while ensuring liveability increases with mounting difficulties. Urban planners and city managers have to balance the need for efficient traffic flow and increased network capacity as urban areas increase in size while ensuring that they still function at a human scale to offer accessibility to all.
In addition to the challenges of complexity and competition for space, the global threat of climate change has led to an escalating urgency to reduce our ecological footprint and make responsible choices regarding our decisions and the goods and services we use. The transport sector is responsible for 20% of EU-28 greenhouse gas emissions (excluding international aviation and maritime emissions) [2] and is estimated to account for anywhere from between 20–50% to one-third of its total energy usage depending on the source. It is important to reconsider how we assess and structure our cities to make them less car-oriented and translate this into actionable knowledge for sustainable development.
The recent Sustainable Development Goals (SDGs) are indicative of the challenge above [3]. Although set-up as stand-alone goals, each SDG has an explicit and implicit relationship with each other. Take for example SDG 11—Make cities and human settlements inclusive, safe, resilient, and sustainable—where the focus is on building cities and communities that are equitable but also sustainable, and SDG 7—Ensure access to affordable, reliable, sustainable, and modern energy for all—where the focus is on energy resource resilience and robustness. This is where a fine-tuning of the current assessment methodologies is needed if cities are expected to embrace comprehensive strategies to reduce fluctuations in energy resources or decreased levels of services.
Concerning the relationship between urban form and energy use, there has been a multitude of research confirming the classic Newman and Kenworthy [4] study on how high-density environments have lower energy usage [5][6][7]. However, there is a need to understand how different spatial configurations affect transport energy usage and how that can be assessed beyond limited focus on either building units or at a regional scale [5]. This knowledge is needed for planning transport infrastructures that can facilitate and encourage sustainable mobility and reduce energy consumption. This assessment requires a combination of expertise and methods typically separated by domains of traffic engineering which calculate traffic flow and energy use for transport, architects, and urban designers, who analyse urban space and form and spatial planners who can translate indicators into feasible policy.
2. Taking the Cases of Bergen, Norway, and Zurich, Switzerland as Examples
To understand how spatial configurations can affect transport energy usage in cities, this article correlated six spatial and energy-usage variables (see Table 1) across the city of Bergen and Zürich. The values of integration (to-movement) and route choice (through-movement) at both the local and city-wide scales were determined using space syntax analyses of axial maps of both cities based on OpenStreetMap. This was then correlated statistically and spatially to transport energy-usage derived from data from the local municipality in Bergen and an agent-based model for Zürich based on traffic speed and volume.
Table 1. List of variables used in the model.
| Variable | Scale | Description | Metric |
|---|---|---|---|
| Segment Integration (R = 500 m) | Micro | To-movement potential with 500 m metric radius | Numeric |
| Angular Choice (R = 500 m) | Micro | Through-movement potential with 500 m metric radius | Numeric |
| Segment Integration (R = 5000 m) | Macro | To-movement potential with 5000 m metric radius | Numeric |
| Angular Choice (R = 5000 m) | Macro | Through-movement potential with 5000 m metric radius | Numeric |
| Aggregated Angular Choice | Micro/ Macro |
Combination of high and low radius ([C500] × [C5000]) | Numeric |
| Energy consumed without stops | Macro | Total car energy usage per street segment per day (kWh/day) | Numeric |
2.1. Spatial Configurations Affecting Transport Energy Usage
Our findings indicate that the spatial structure of urban space affects transport energy usage. In general, there were weak but positive correlations to transport usage between segment integration and angular choice values at both local (low metrical radius, R = 500 m) and city-wide (high metrical radius, R = 5000 m) scales for both cities (see Table 1). The correlation was stronger for both integration and choice at the city-wide scale, indicating that these routes which favoured vehicles tended to exhibit high transport energy usage. The exception here is that of segment integration at the local scale. Bergen showed this with a weak, negative relationship to transport energy usage. This indicates that the more “walkable” areas of Bergen showed less transport energy usage. Across both cities, correlation at the local scale was lower than correlation at the city-wide scale. This indicates that even though “walkable” or pedestrian-oriented areas (local scale) still exhibited a positive relationship to transport energy use, the coefficients were less than those of areas (city-wide scale) facilitating vehicles which are more car-oriented.
2.1.1. High Transport Energy Usage for Car-Oriented Spatial Configurations
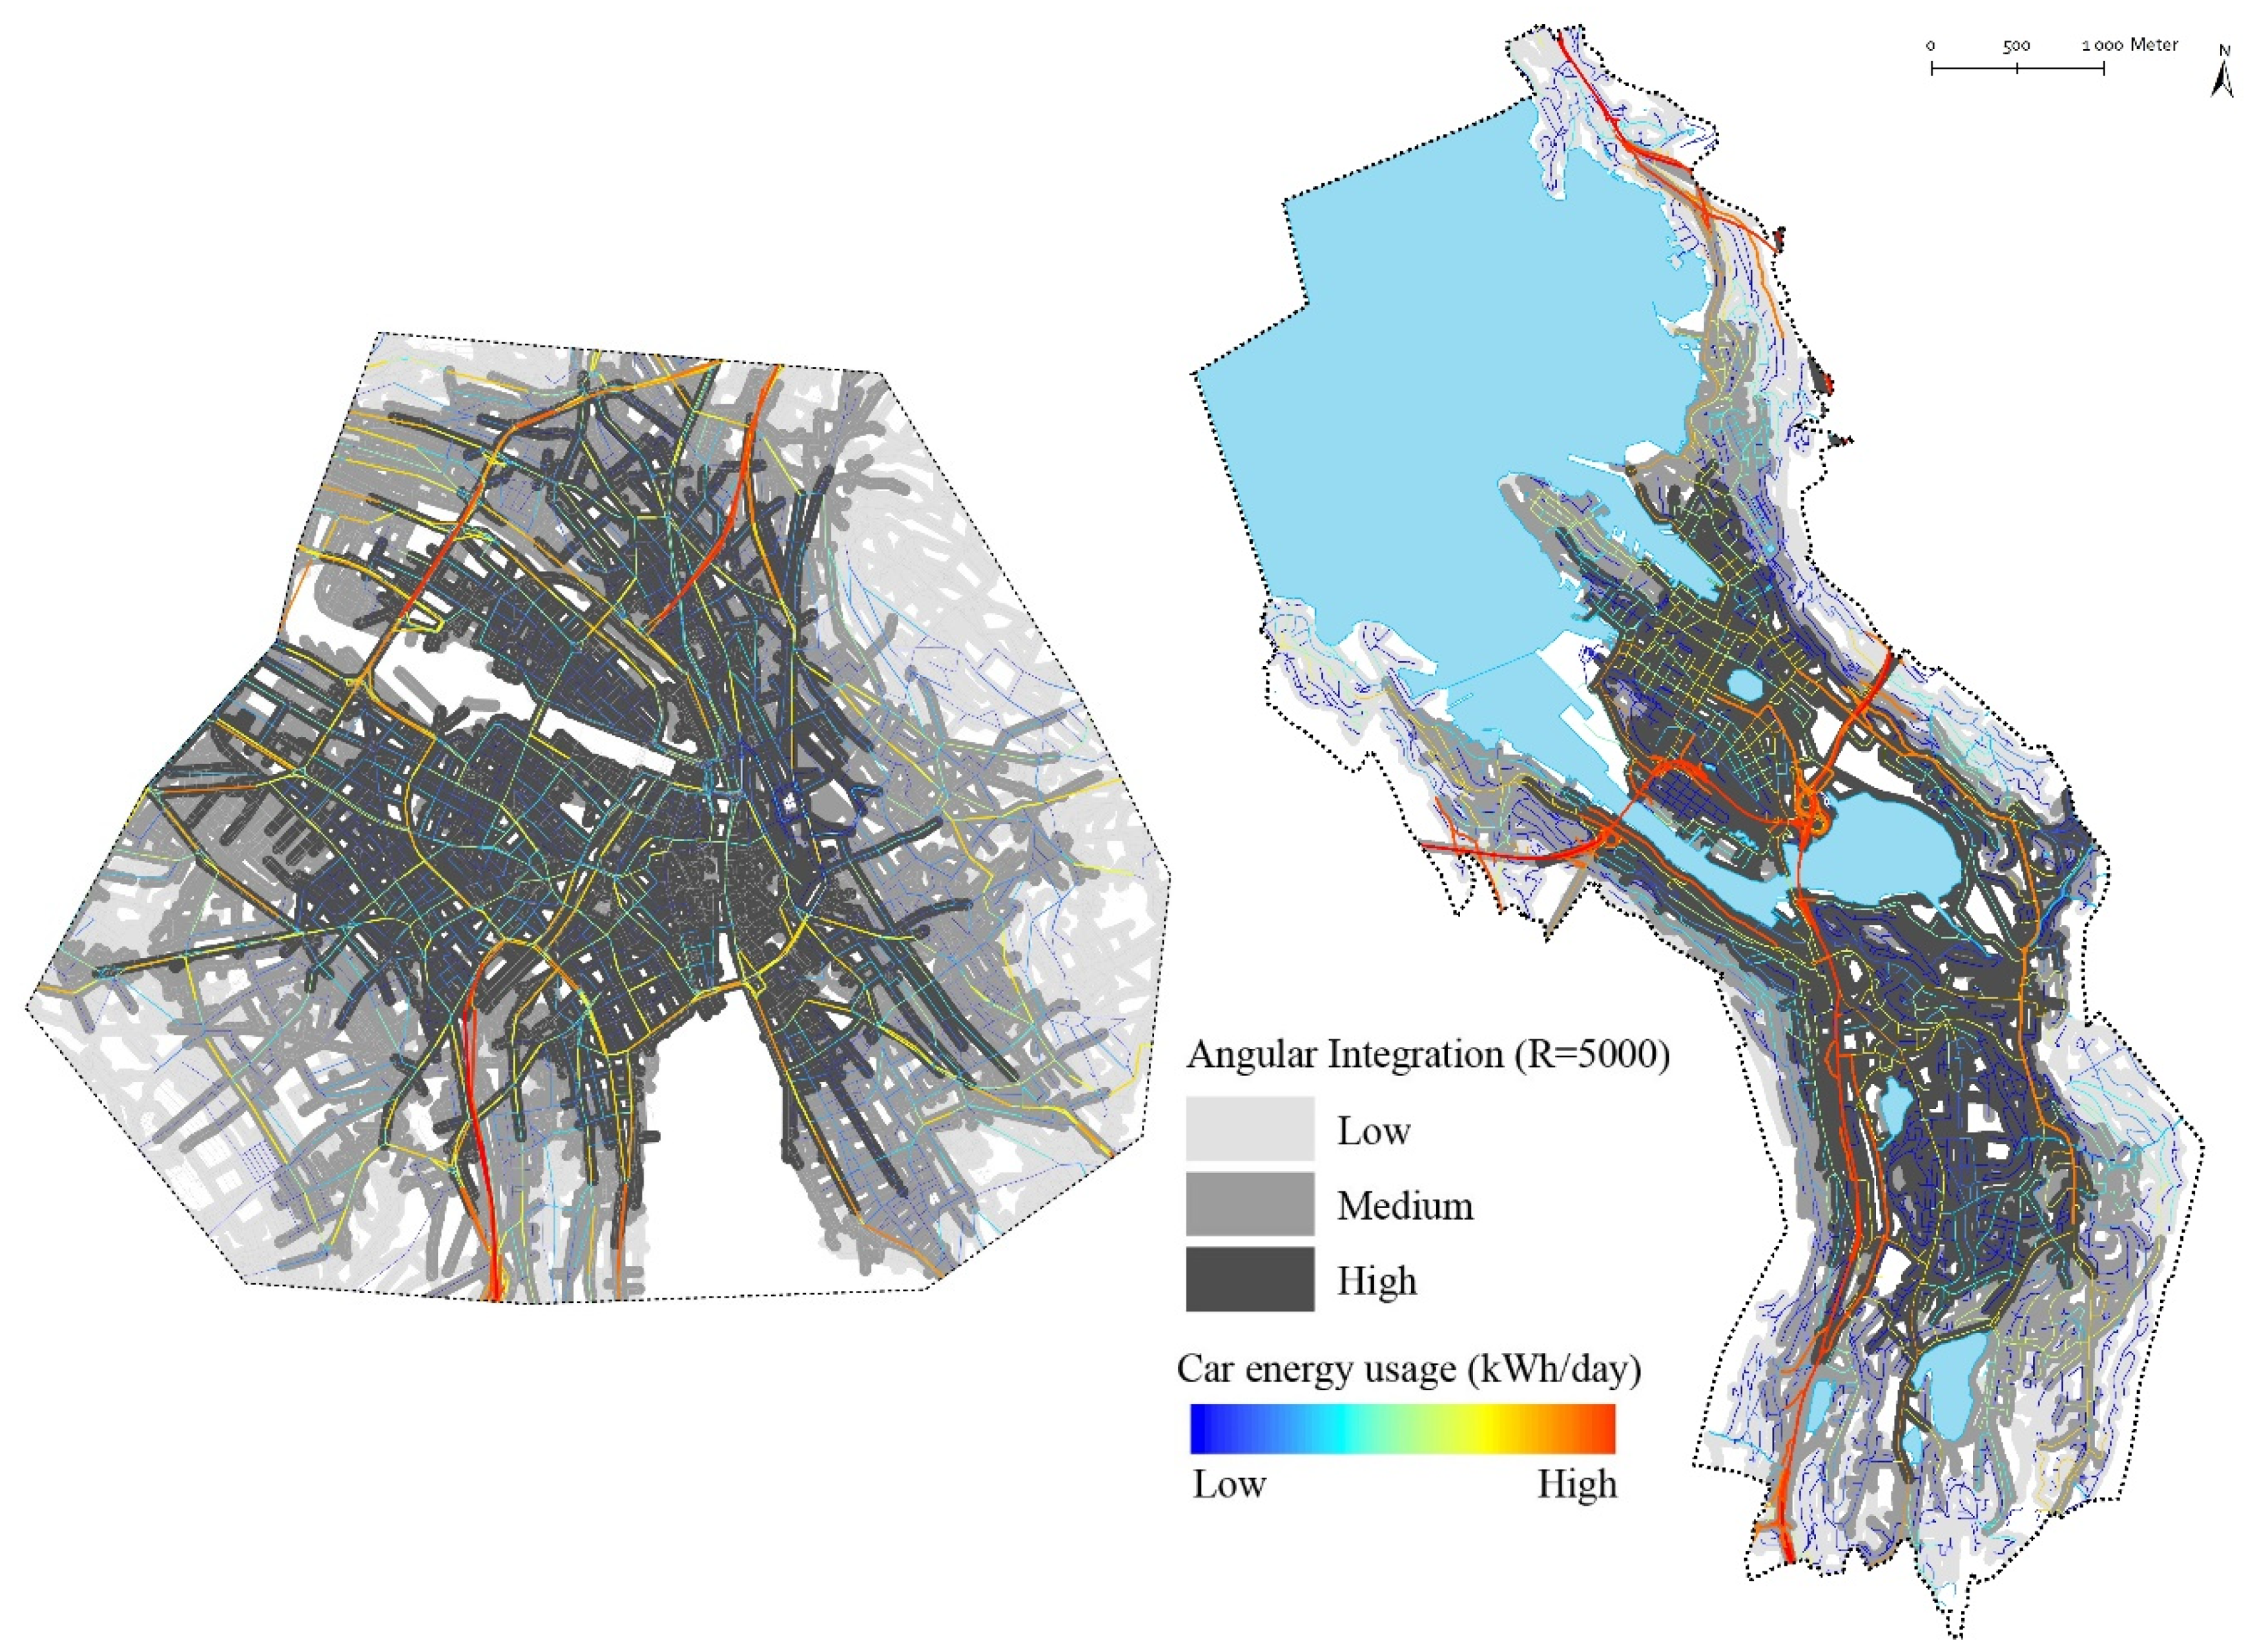
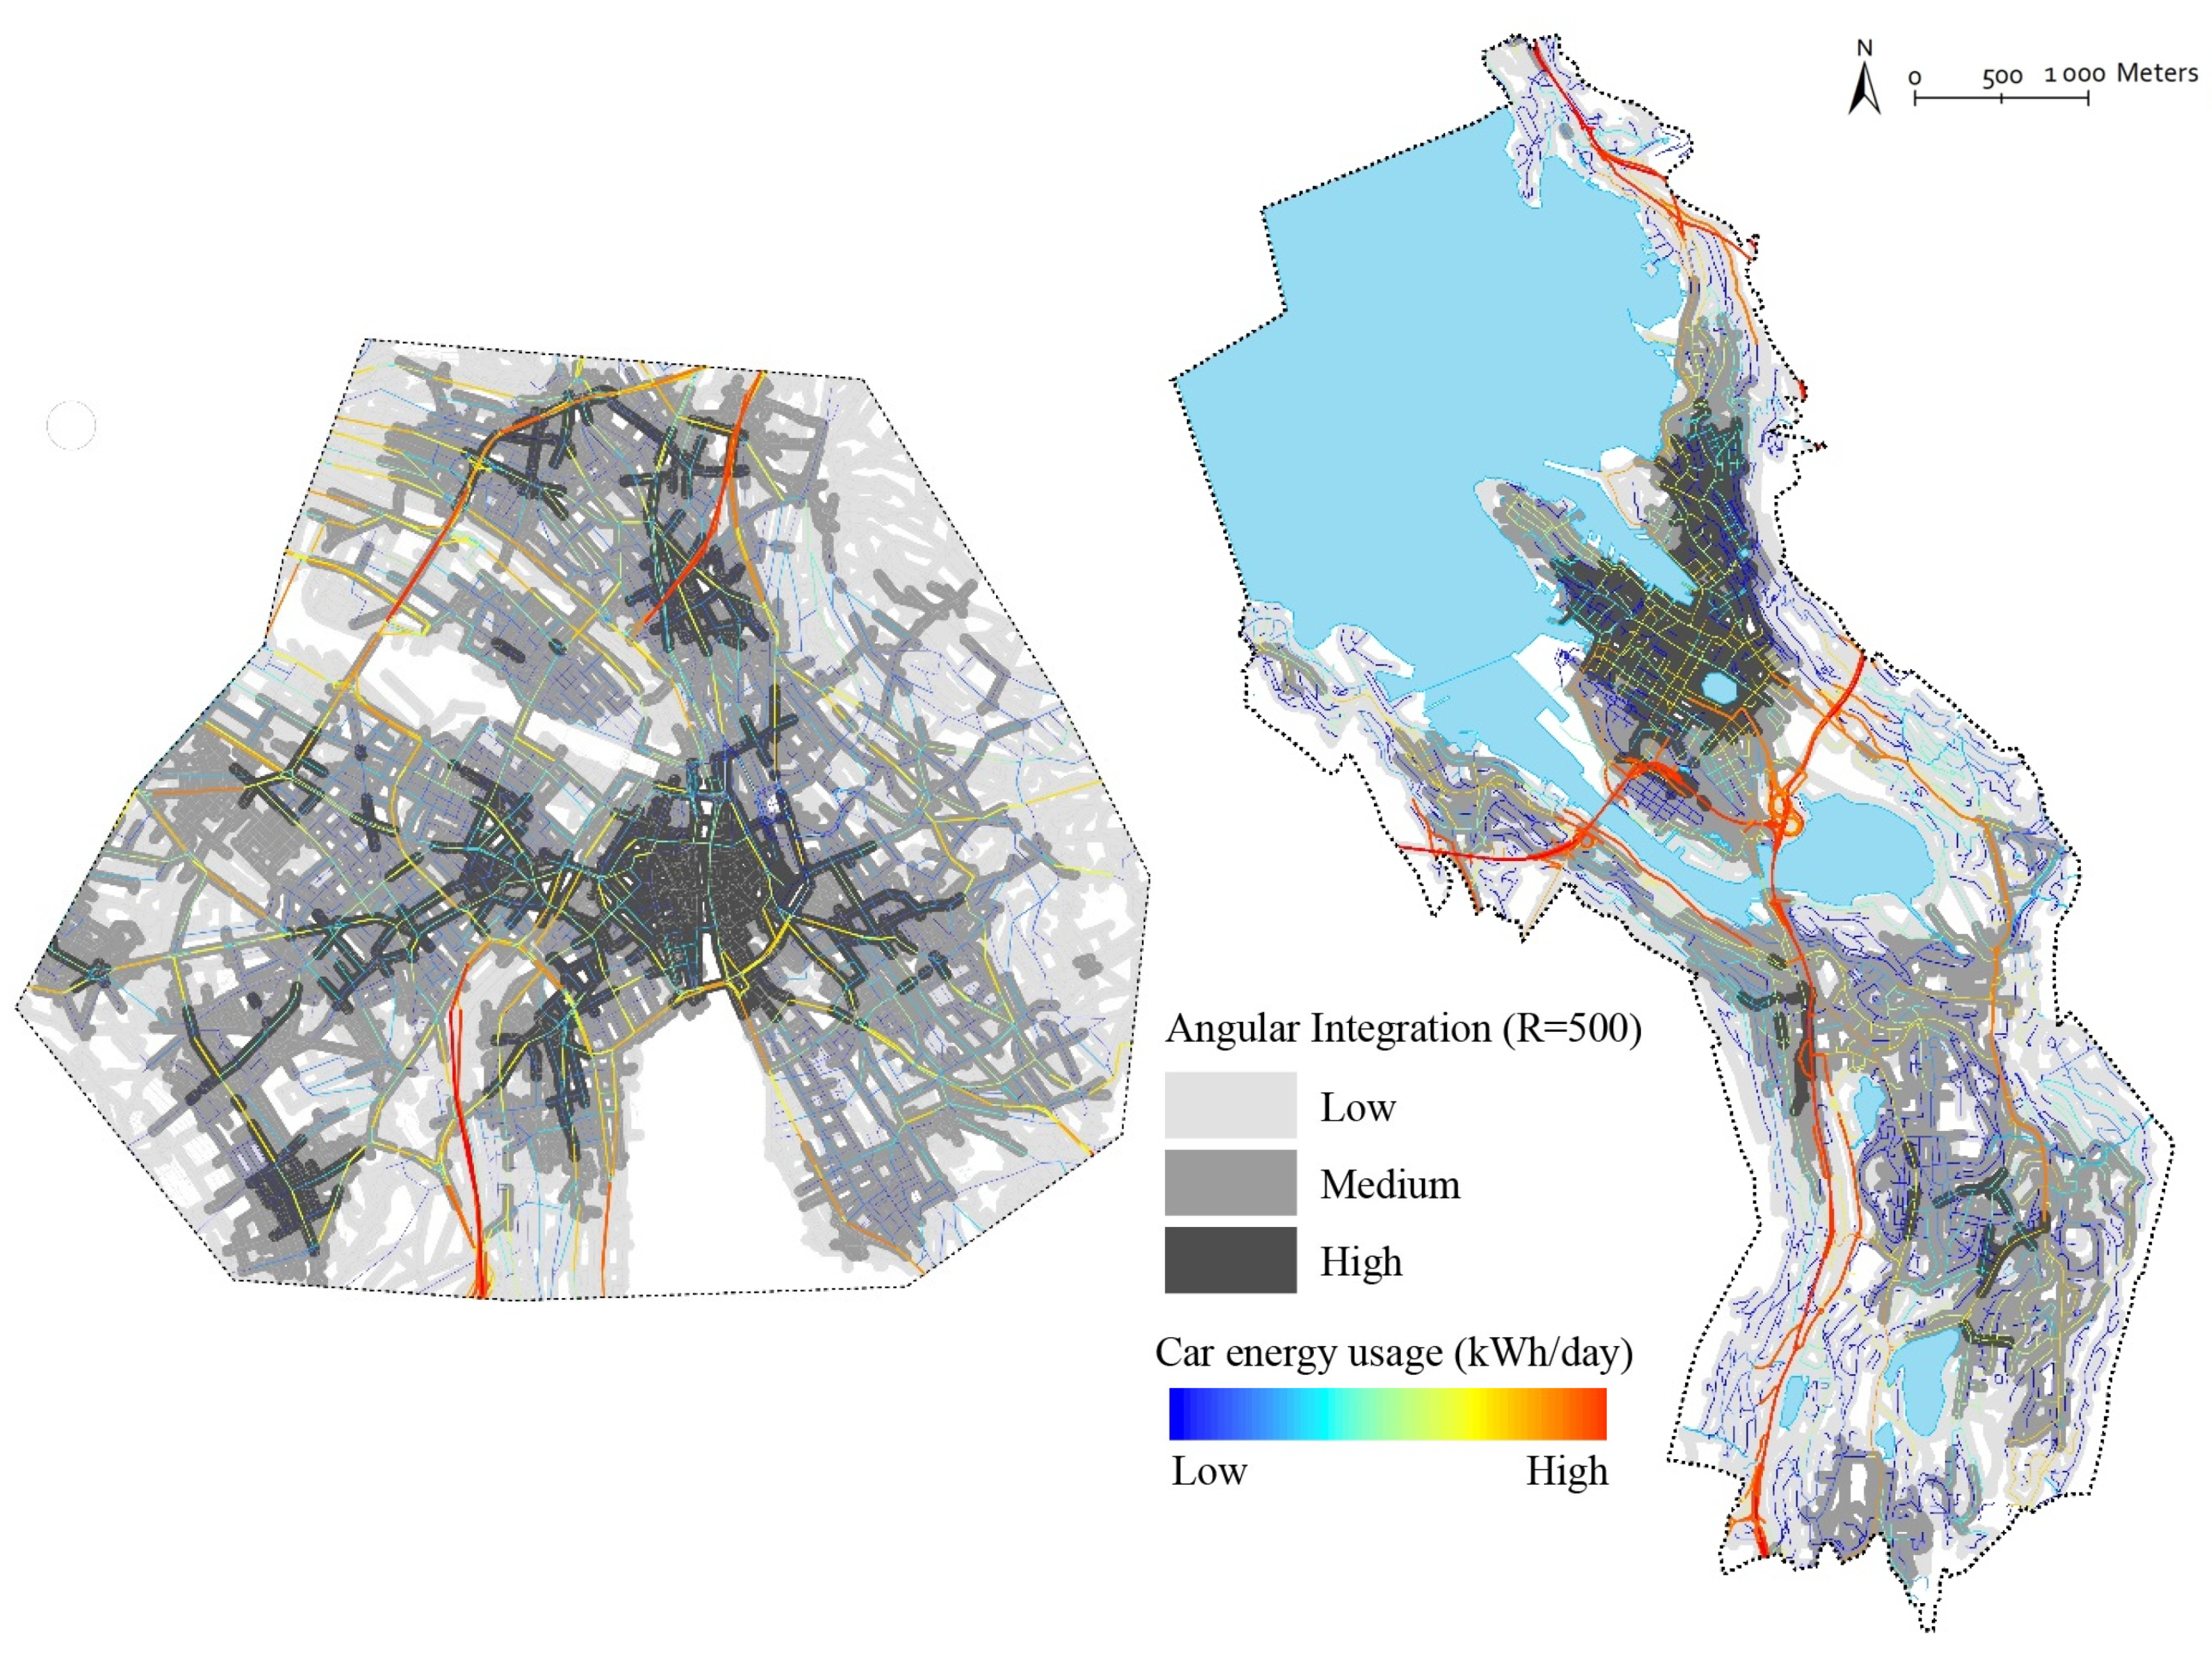
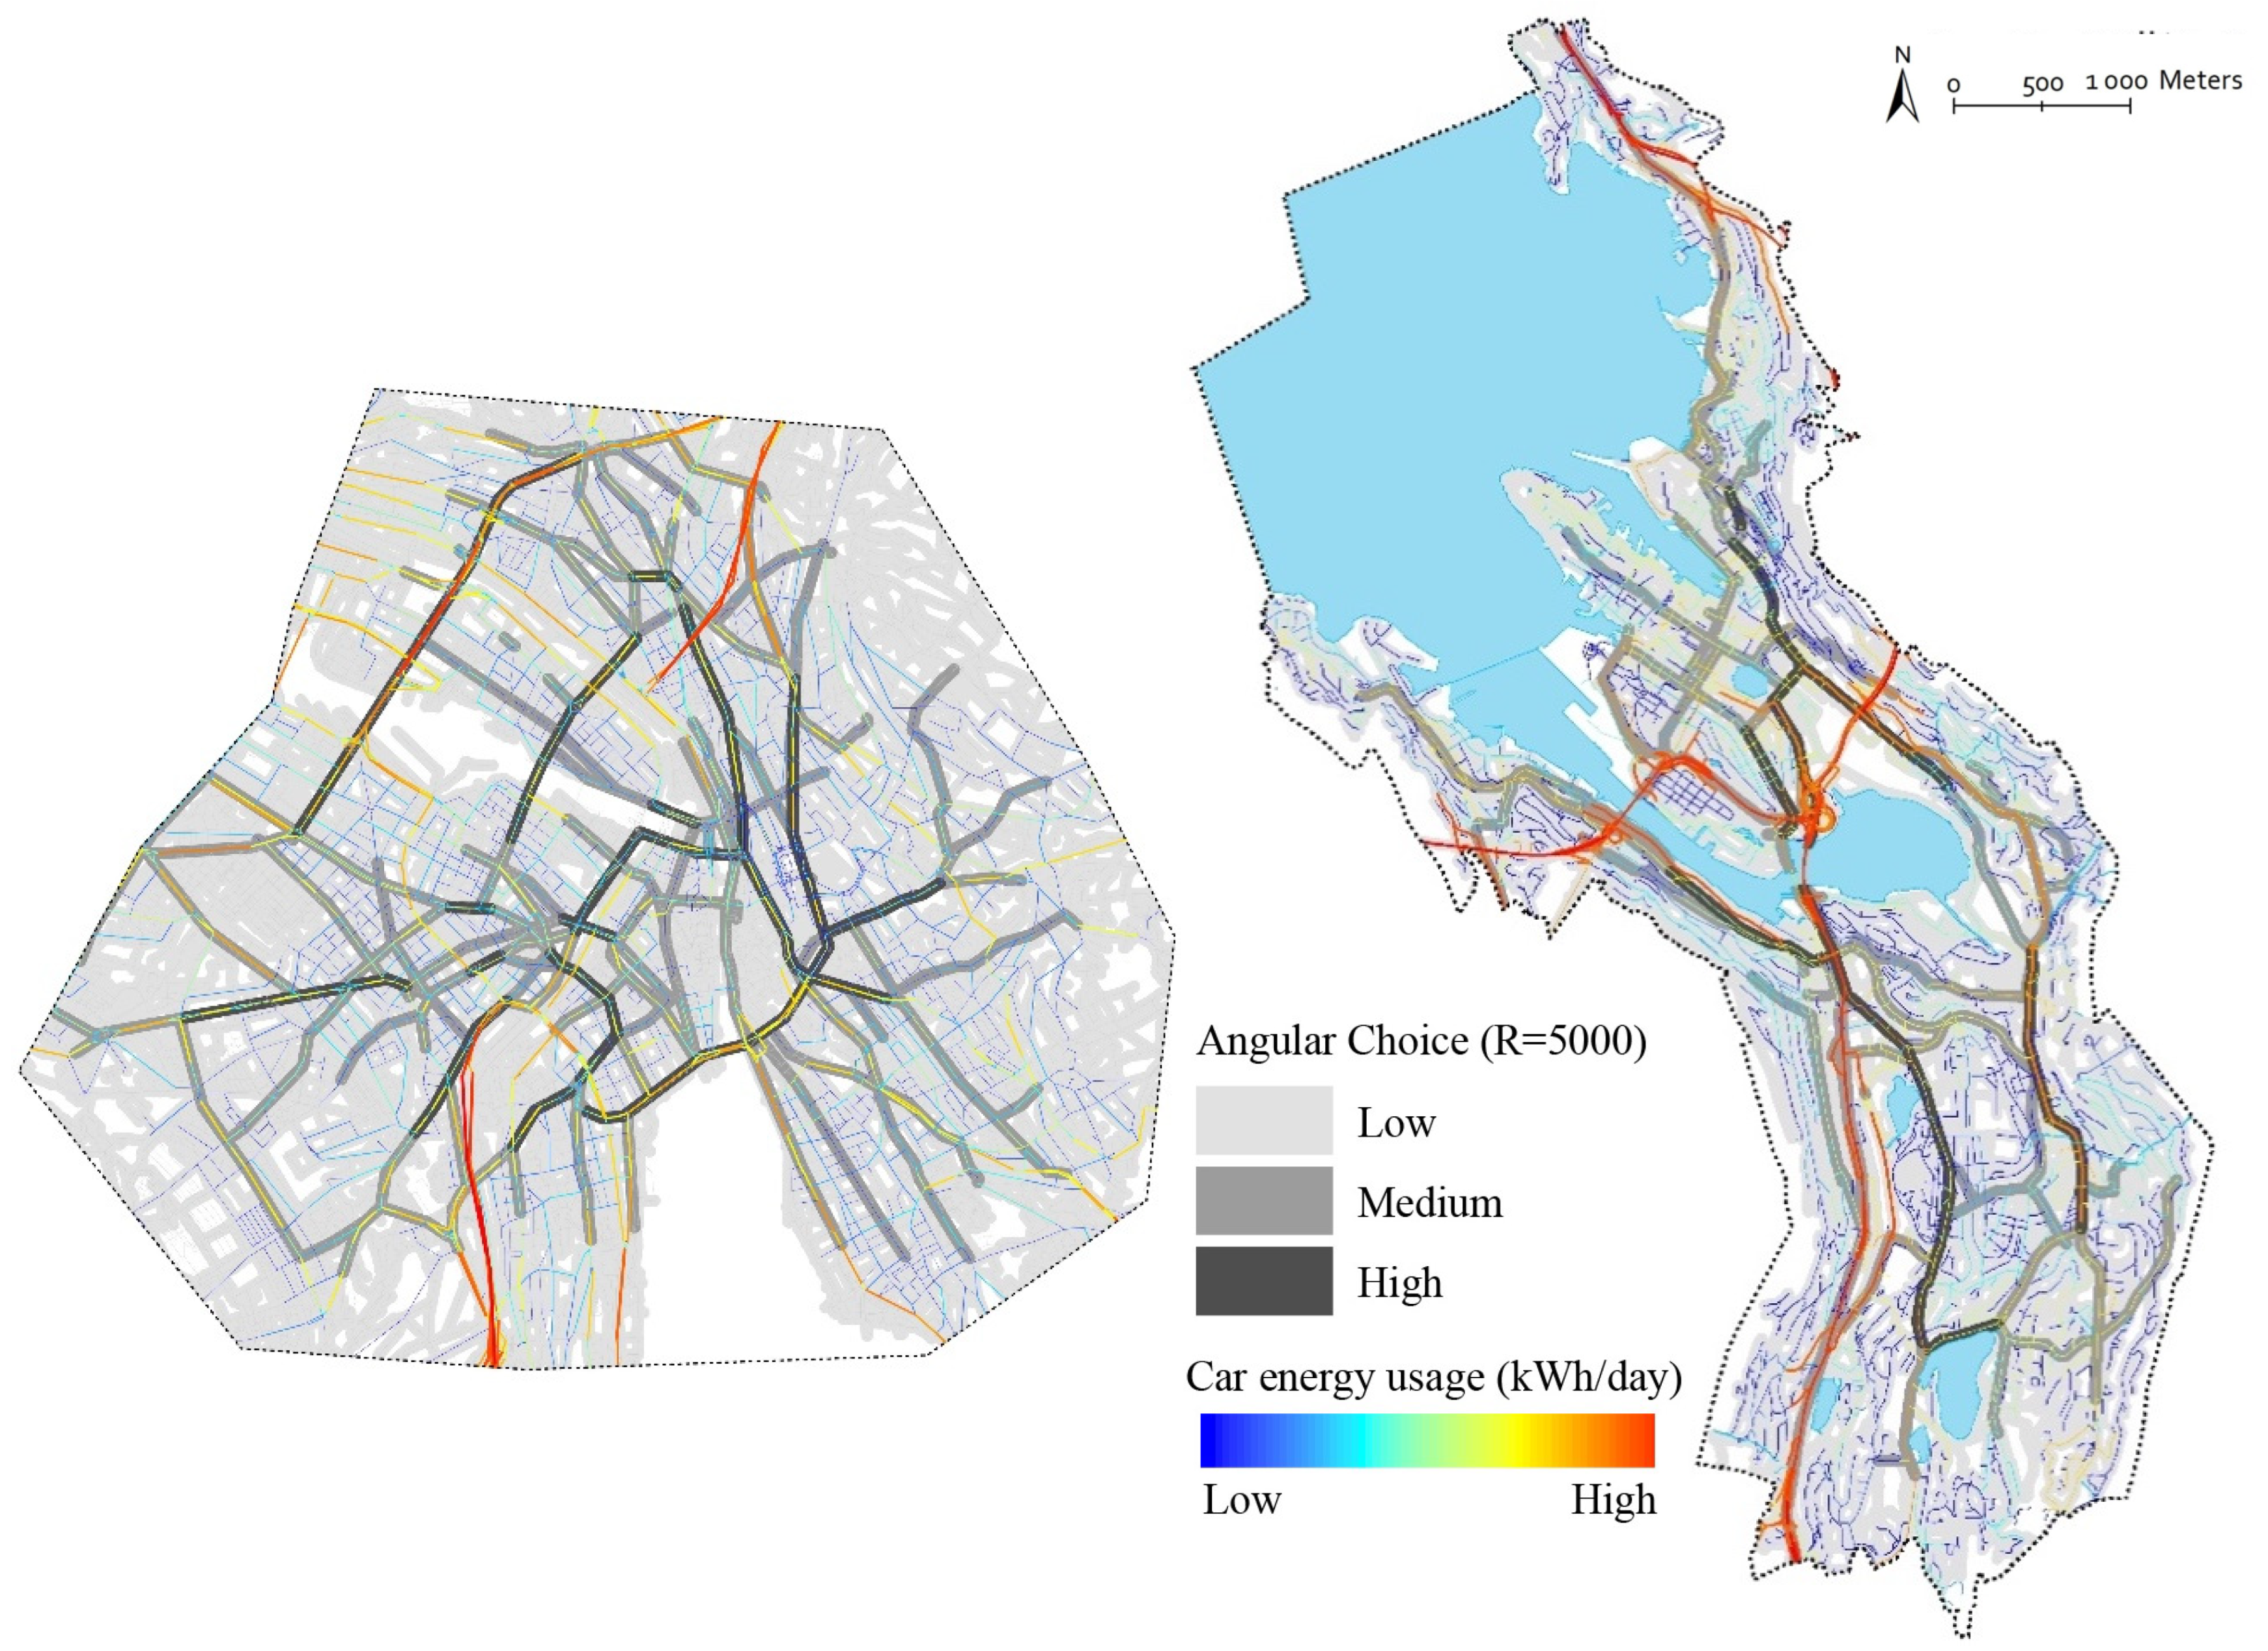
The private car in particular is a major contributor to transport energy usage. As shown in the energy usage equation, longer and high-speed car trips consumed exponentially more energy. This is visible in Figure 1, where the high-energy usage areas were at the periphery of the medium-to-low values of segment integration at a city-wide scale. This is even more visible on a local scale (see Figure 2). These areas with less potential as destinations (to-movement), typically suburbs, urban peripheries or industrial zones, tended to see higher transport energy usage due to the higher car use or speeds permitted as opposed to denser city centres which might be pedestrianised or had lower speed limits. Examples include Mindemyren in Bergen and Industriequartier in Zürich. In Figure 3, the street segments with high angular choice values exhibit high transport energy usage. These arterial routes have the highest potential as chosen routes and attract high amounts of traffic and corresponding energy usage. Here, path dependencies might be at play as historically important routes tend to be routes that develop for vehicular traffic in modern times.


2.1.2. Low Transport Energy Usage for Pedestrian-Oriented Spatial Configurations
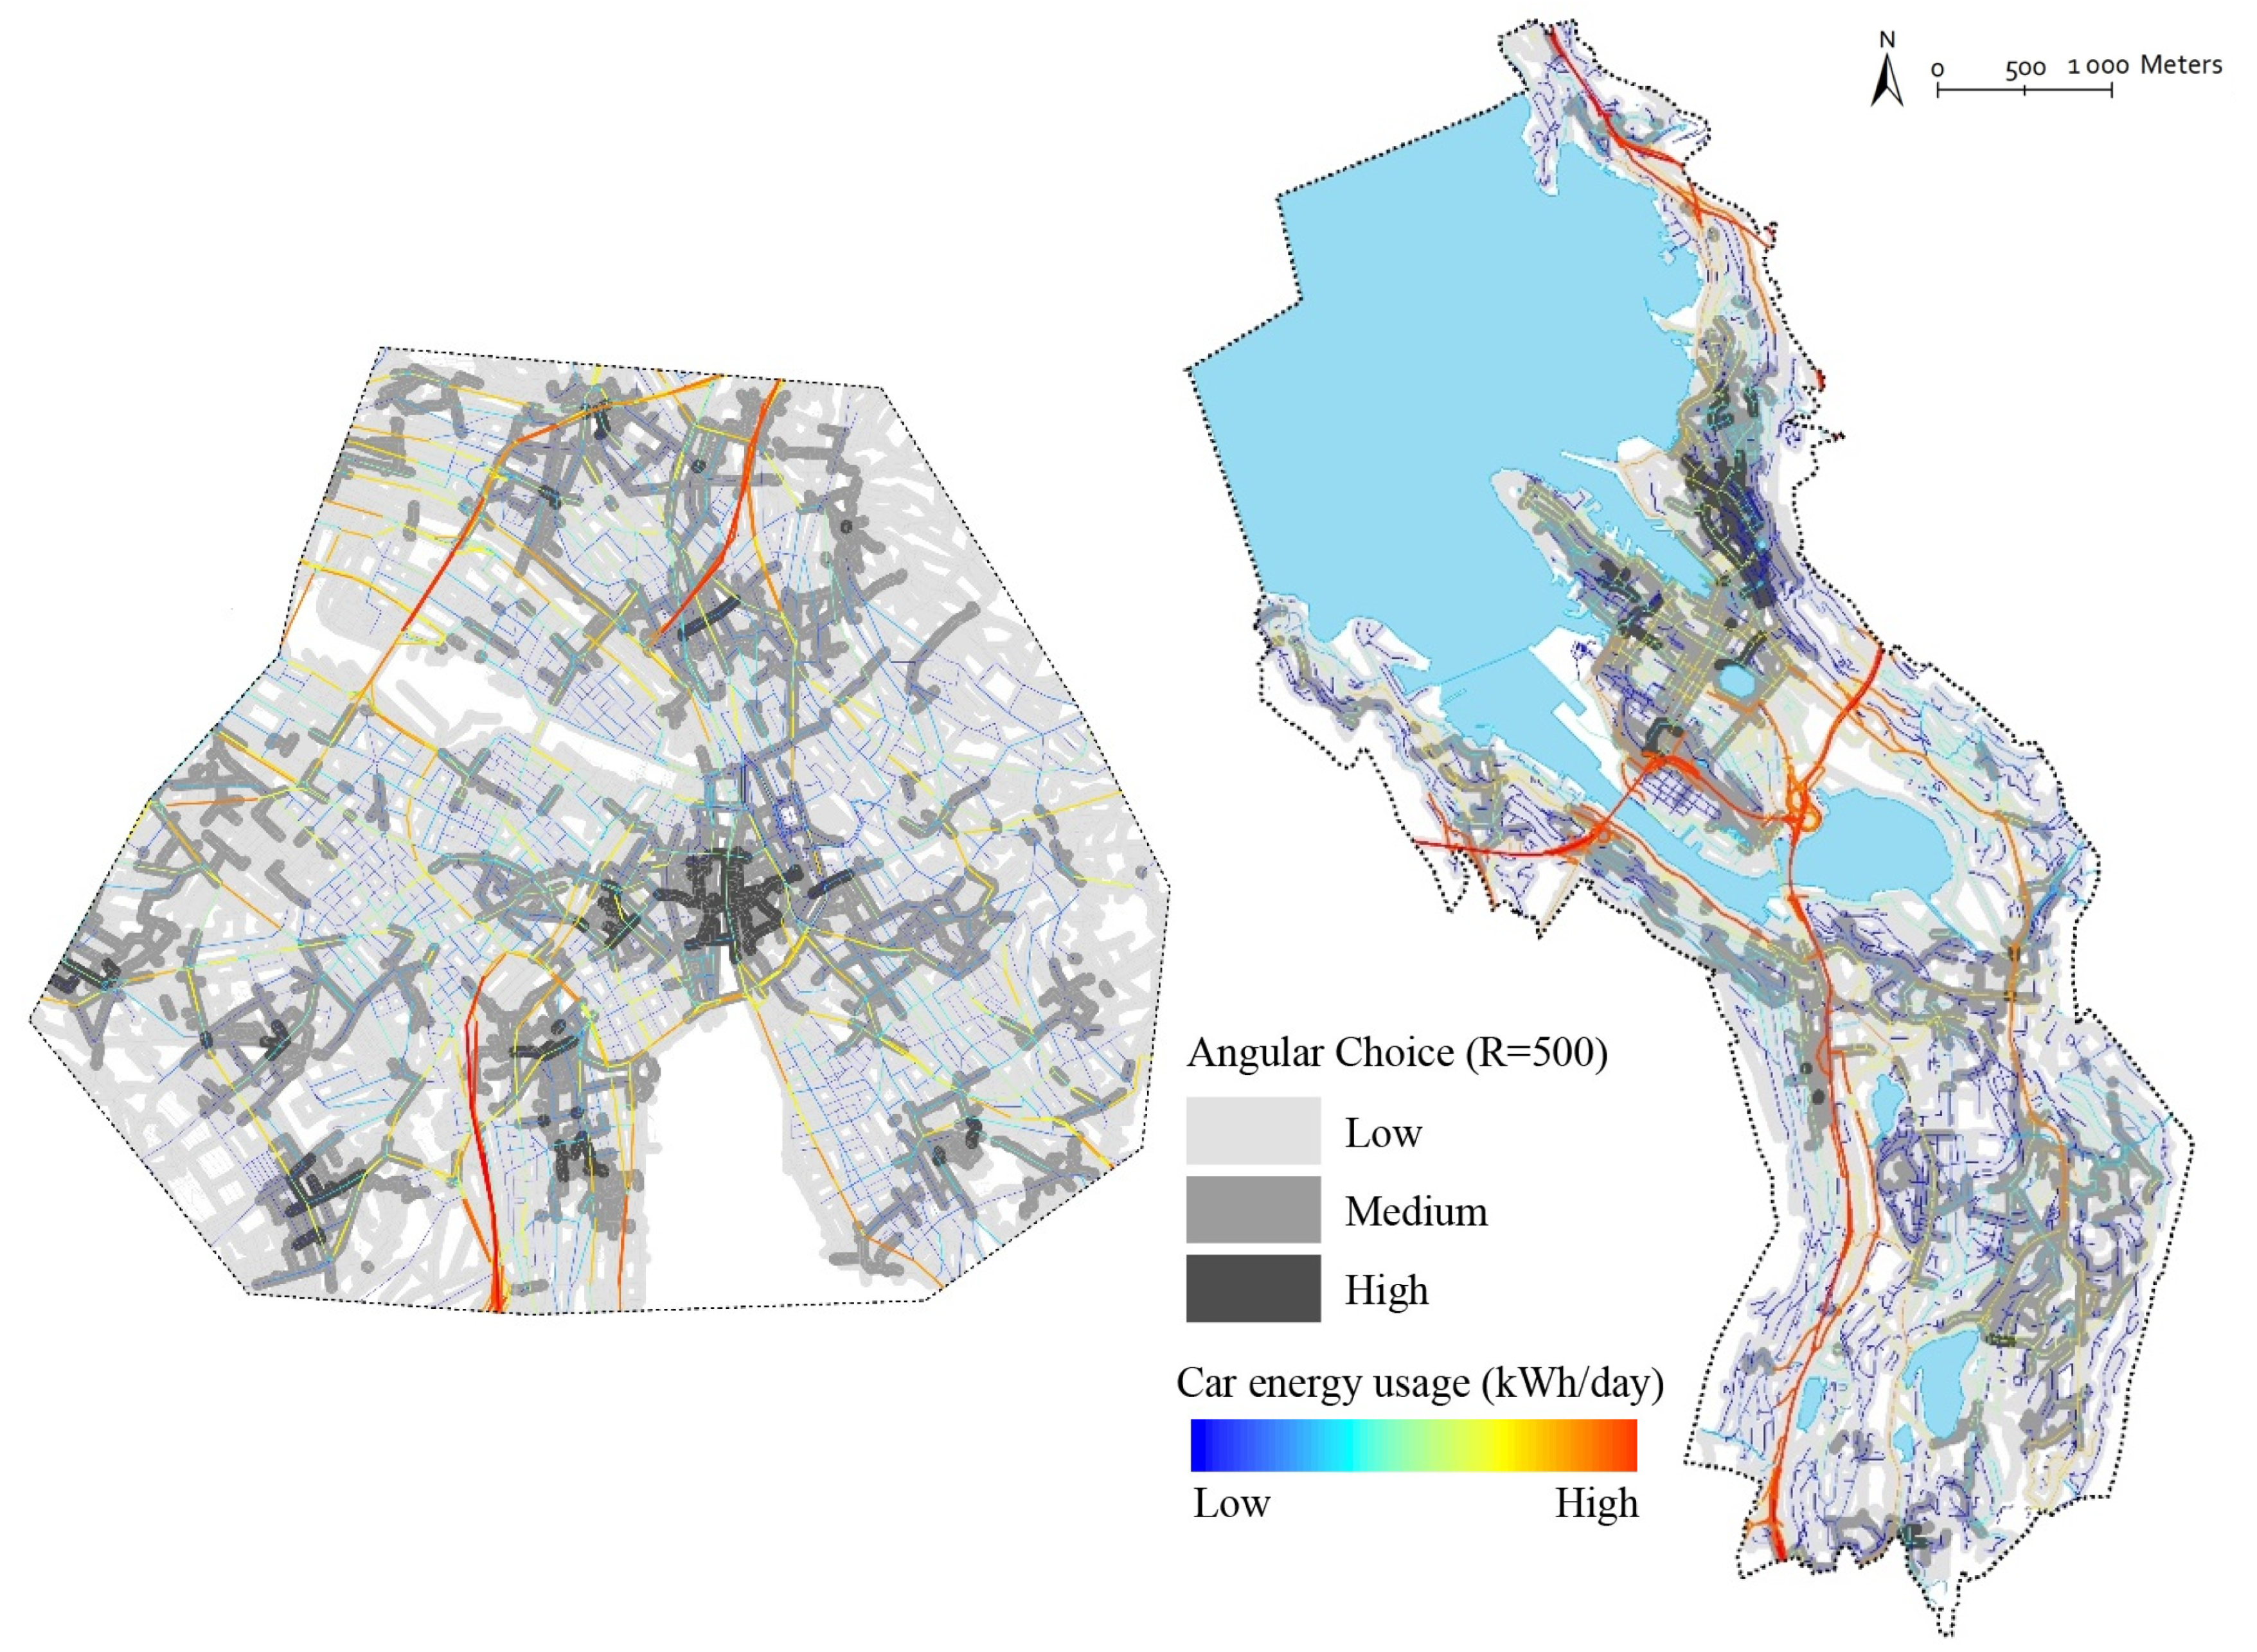
On a local scale (see Figure 4, the inverse is true. These segments with high angular [1][2][3][4][5][6][7] choice at local scale tend to indicate a high degree of “walkability” in streets and attract less vehicular traffic and transport energy usage. Segments with high angular choice values at both scales but not high transport energy usage indicating an efficient public transport system for tram, buses or light rail commonly found in Bergen and in Zürich. Areas such as the peripheries of Byparken in Bergen and Altstadt in Zürich are where local scale high to-movement networks (segment integration) are enmeshed with the global scale high through-movement (angular choice) networks (see Figure 2 and Figure 3). These areas reflect lower transport energy usage as private car usage is available but discouraged. Here, walking and cycling seem to become a natural choice for shorter, local destination trips. When these segments have the presence of a well-integrated and diverse public transport systems, these local destination trips have the potential to extend towards car-free regional trips, too, reducing energy usage further.

2.2. Integrated Assessment for Transport and Land Use Planning
This entry proposed an integrated assessment approach consisting of three steps: (i) generation of aggregated angular choice buffers resulting in route typologies, (ii) spatial comparison of spatial configurations and energy usage via overlay and (iii) statistical correlation of spatial configurations and transport energy usage. Our findings indicated a clear correlation between spatial configurations and transport energy usage.
3. Conclusions
The above approach and findings contribute to novel insights to current academic discussions on transport and land use patterns in relation to energy consumption. The findings verify a positive correlation of car-oriented spatial configurations having higher energy usage. This is a critical element of addressing sustainability concerns, particularly in view of the energy transitions anticipated in the coming decades. In addition, the verification of what necessary conditions are required to support walkable, liveable and vital urban areas for those with and without access to private vehicles contributes to larger societal goals of creating and maintaining sustainable communities and cities. space syntax, which stems from precise concepts of urban space, applicable independent of cultural, economic, social or aesthetic contexts, allows for a value-free evaluation of the city. Moreover, it is possible to calculate spatial relationships independent from socioeconomic data with the space Syntax method. The MATSim model aggregates traffic data on the mobility network based on the place-bounded data regarding the location of urban functions. Therefore, overlapping and correlating these two models contributes to knowledge on the relation between urban spatial configuration and energy use for transport.
Planners and policy makers can use the findings to understand how spatial configurations affect transport energy usage. In addition, the approach using predominantly open sourced map data can be applied in various cities and regions across the world. Knowing the necessary conditions for walkable and liveable areas enables practitioners to plan and design for more integrated streets, differentiate which streets are desirable and which are less, and contribute additional savings in energy usage when the desired change is implemented. What the findings from Bergen and Zürich show, is that urban areas with short urban blocks or a fine-meshed street network with a well-connected main route running through these areas enhance low energy use for transport. The disclosure of high or low energy usage streets and areas based on a value-free evaluation of the city can also promote institutional innovation towards more sustainable mobility [8].
This entry is adapted from the peer-reviewed paper 10.3390/su12198146
References
- UN HABITAT. World Cities Report 2016; UN Habitat: Nairobi, Kenya, 2017; pp. 1–264.
- European Environment Agency (EEA). Greenhouse Gas Emissions from Transport. Available online: https://www.eea.europa.eu/data-and-maps/indicators/transport-emissions-of-greenhouse-gases/transport-emissions-of-greenhouse-gases-11 (accessed on 11 April 2019).
- United Nations (UN). Resolution Adopted by the General Assembly on 6 July 2017. A/RES/71/313; Seventy-first Session, NY, USA. 2017. Available online: https://undocs.org/A/RES/71/313 (accessed on 11 April 2019).
- Newman, P.W.; Kenworthy, J.R. Cities and Automobile Dependence: An International Sourcebook; Gower: Aldershot Hants, UK, 1989.
- Nichols, B.G.; Kockelman, K.M. Urban form and life-cycle energy consumption: Case studies at the city scale. J. Transp. Land Use 2015, 8, 115–128.
- Papa, R.; Gargiulo, C.; Angiello, G. The Factors Influencing Transport Energy Consumption in Urban Areas: A Review. TeMA J. Land Use Mobil. Environ. 2014, 737–747.
- Steemers, K. Energy and the city: Density, buildings and transport. Energy Build. 2003, 35, 3–14.
- Homrighausen, J.R.; Tan, W.G.Z. Institutional Innovations for Sustainable Mobility: Comparing Groningen (NL) and Phoenix (US). Transp. Res. Procedia 2016, 19, 151–163.
