A fully integrated photoacoustic nitrogen dioxide (NO2) sensor is developed and demonstrated. In this sensor, an embedded photoacoustic cell was manufactured by using an up-to-date 3D printing technique. A blue laser diode was used as a light source for excitation of photoacoustic wave in the photoacoustic cell. The photoacoustic wave is detected by a sensitive microelectromechanical system (MEMS) microphone. Homemade circuits are integrated into the sensor for laser diode driving and signal processing. The sensor was calibrated by using a chemiluminescence NO–NO2–NOX gas analyzer. And the performance of this sensor was evaluated. The linear relationship between photoacoustic signals and NO2 concentrations was verified in a range of below 202 ppb. The limit of detection was determined to 0.86 ppb with an integration time of 1 s. The corresponding normalized noise equivalent absorption was 2.0 × 10⁻⁸ cm−1∙W∙Hz−1/2. The stability and the optimal integration time were evaluated with an Allan deviation analysis, from which a detection limit of 0.25 ppb at the optimal integration time of 240 s was obtained. The sensor was used to measure outdoor air and the results agree with that obtained from the NO–NO2–NOX gas analyzer. The low-cost and portable photoacoustic NO2 sensor has a potential application for atmospheric NO2 monitoring.
- Photoacoustic sensor
Background
Methods to measure NO2 concentration have been widely studied. The techniques based on chemiluminescence are routinely used to determine NO and NO2 concentration in gas mixtures [1]. Chemical sensors with electrical conductance responses [2] or color responses [3] are possible to measure the concentration of NO2 from tens of ppb to hundreds of ppm. Spectroscopic methods, such as cavity ring-down spectroscopy [4][5], broadband cavity-enhanced absorption spectroscopy [6], laser-induced fluorescence method [7], and multi-wavelength quantum cascade laser spectroscopy [8], usually have detection limits of ppb or sub ppb levels, with sophisticated optical setup.
In recent years, trace gas detection using photoacoustic spectroscopy (PAS) receives wide attention and research. PAS is an application of photoacoustic (PA) effect, i.e., the phenomenon that the modulated or pulsed light illuminates materials to generate sound. This sound generation is caused by heat release from the excited molecules that absorb incident photons. The sound wave can be amplified acoustically by using a resonator and then transformed into electronic PA signals by a commercial microphone or other sound-sensitive detectors. Through subsequent signal processing procedures, an appropriate frequency component, usually at the same frequency as the resonance frequency of the resonator, can be obtained. The amplitude of this frequency component is proportional to the concentration of absorber under the circumstance of weak absorption.
Many researches on PAS were made to promote the performance of NO2 sensors. In 1996, R.L. Pastel and R.C. Sause reported a detection limit of 400 ppb by using a dye laser operating near 454 nm [9]. In 2001, V. Slezak reported a pulsed photoacoustic spectroscopy setup for measuring NO2 concentration in Nitrogen (N2) [10]. Two years later, V. Slezak et al. presented their NO2 trace detection using continuous and pulsed lasers at 532 nm, with a detection limit of 20 ppb and 15 ppb [11]. In the same year, G. Santiago et al. used a sound card in a personal computer to sample the PA signals and processed them on the PC, reaching a detection limit of 50 ppb. In 2006, M. Pushkarsky et al. reported a sub-ppb level detection of NO2 by using a room-temperature quantum cascade laser (QCL) [12]. H. Yi et al. introduced off-beam quartz-enhanced technique into PAS in 2011, obtaining the minimum detectable concentration of about 18 ppb [13]. In 2015, J. Peltola et al. reported their research on cantilever-enhanced PAS, with a detection limit of 50 ppt [14]. In 2017, X. Yin et al. [15] and T. Rück et al. [16] reported their work for ppt-level NO2 detection by using a differential PA cell and a PA cell with Brewster windows, respectively, both of which have a small size, but their commercial instruments to process the PA signals are expensive and bulky. In 2019, J. Kapp et al. reported their work on a ultraviolet light-emitting diode based photoacoustic sensor [17], which used their custom signal processing circuits, and the PA cell was carefully designed to reduce the background noises. The sensor has a noise equivalent concentration of 32 ppb, while the integration time is 1.14 s.
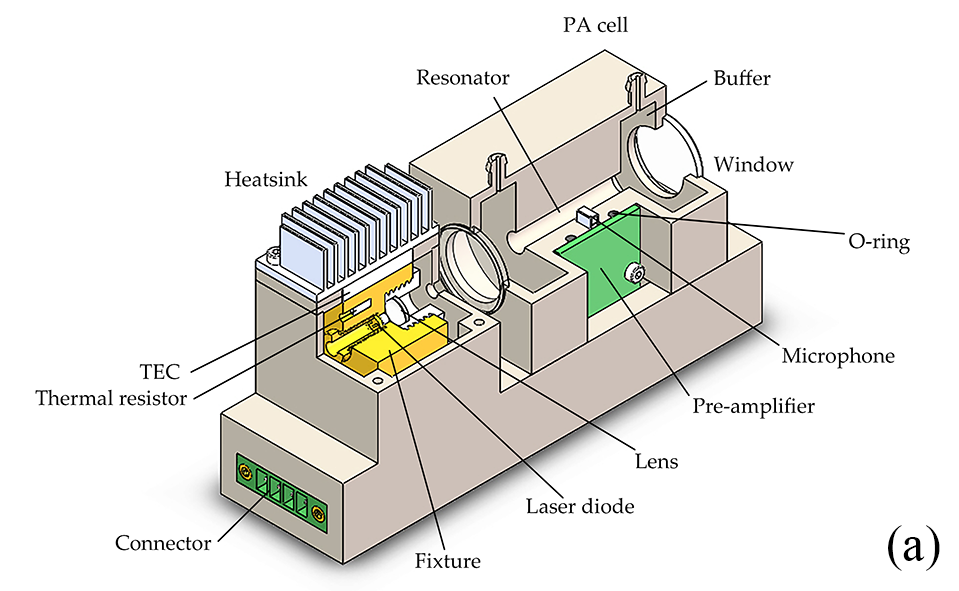
In this paper, we propose our work on building a fully integrated NO2 PA sensor. The structure of this PA sensor was all 3D printed, including a cylinder resonator, gas buffer chambers, laser case temperature controlling box, and other structural parts. A 3D printing technique has been well-developed over recent years. It is also known as a kind of additive manufacturing (AM) technique, because of its special process to synthesize objects. This unique synthesizing mechanism makes 3D printing technique suitable for manufacturing some dimensionally small but structurally complex objects. Since there are several kinds of structures assembled in the PA cell, it is much easier to build prototypes of the PA cell with 3D printers. As to the selection of light sources, the broad absorption spectrum of NO2 from 250 to 650 nm enables the application of a commercial blue laser diode in NO2 concentration measurement. This commercial high-power laser diode, driving circuits, home-made signal processing circuits and a communication port, were integrated into the sensor to minimize its size. The performance of this sensor was evaluated with experiments.
Sensor Design
The absorption cross-section of NO2 from 238 to 1000 nm has been measured with a Fourier transform spectrometer by A.C. Vandaele et al. [18]. The maximum absorption cross-section of 7.4 × 10⁻¹⁹ cm2∙molecule−1 is located at 414 nm. However, photochemical dissociation of NO2 occurs at the light wavelength of below 415 nm, which may induce a nonlinear PA effect when quantitatively detecting. Considering the cost and availability in the market, a blue laser diode (LD) whose emitting wavelength is 450 nm at 25°C (PL TB450B, Osram, Munich, Germany) was selected. Since the wavelength drift of the LD is about 0.067 nm∙°C−1, a temperature controlling system, including a thermal electric cooler (TEC) (TEC1-031140, Pengnan Tech., Xiamen, China), a platinum resistor (M222, Heraeus, Hanau, Germany) and a home-made controlling circuit, was used to stabilize the case temperature of the LD at 25°C. The maximum optical output power is 1.6 W, while the operating current is 1.5 A. A home-made current source with modulation input supplies square-wave current to the LD. The duty cycle of the square-wave current is 50%. A lens with anti-reflection coatings focuses the beam at the center of the resonator.
Although the resonator amplifies sounds acoustically and the microphone has a fairly high sensitivity, the PA signal obtained is too weak. So some circuits are designed carefully to promote the signal to noise ratio (SNR). The power supply to the microphone is regulated and filtered with an inductor-capacitor filter. And the pre-amplification circuit has a gain of 250 by using a 4-stage amplifier. The microphone is directly soldered on the backside of the printed circuit board to avoid extern coupled noise.
Another part of the signal processing circuit is a microcontroller-based digital lock-in amplifier (DLIA). Once a signal enters the DLIA, a 4-stage band-pass filter will remove the out-of-band noises. Then the filtered PA signal is amplified to the level compatible with the reference of an analog-to-digital converter (ADC) by a 4-stage amplifier whose gain is set to 1000. Controlled by the MCU, the ADC samples and converts the signals at a sampling frequency of 20 times the modulation frequency.
At this sampling frequency, digitalized PA signals are processed by a software-based phase-sensitive detector (PSD) in the MCU. A direct digital synthesizer (DDS), which is also implemented by software, provides a pair of orthogonal reference sine waves to the PSD. Because the ratio of sampling frequency to modulation frequency is fixed, this implementation is as simple as building a look-up table storing a single cycle of phase biased sine waves. The demodulation parameters, such as the roll-off slope and the integration time, can be adjusted in the software. Considering the balance of processing power, signal-to-noise ratio and bandwidth of the sensor, these parameters are set to 12 dB/Oct and 1 s. A two-stage infinite impulse response (IIR) filter with a corresponding cut-off frequency of 125 mHz is implemented in the PSD. Theoretically, the output of DLIA is proportional to the absorption, and hence also proportional to the concentration of NO2, when the power of incident light is determined. The MCU can upload the signals onto a PC through a serial port.
The dimension of the assembled NO2 sensor (shown in Figure 1) is 120 mm × 65 mm × 35 mm. To optimize the parameters and evaluate the performance, a laboratory setup is established for the sensor. An optical power meter is used to measure the power of exit beam, and it can be replaced by a beam dump (GCX-M02, Daheng Optics, Beijing, China) after the power is determined, to avoid potential harm caused by the high-power laser. By using a gas mixing system (N-4000, Environics Inc., Tolland, USA), NO2–N2 mixtures with different concentrations from pure N2 to the maximum 202 ppb are generated by diluting NO2 in N2. The gas flow fed into the sensor is controlled by a gas flow controller (D07-19B, Beijing Sevenstar Electronics Co., Beijing, China). After going through the sensor, the flow is fed into a chemiluminescence NOX analyzer (Model 42i NO–NO2–NOX Gas Analyzer, Thermo Fisher Scientific Inc., Waltham, USA) to precisely determine the NO2 concentration.
Experimental Results and Discussion
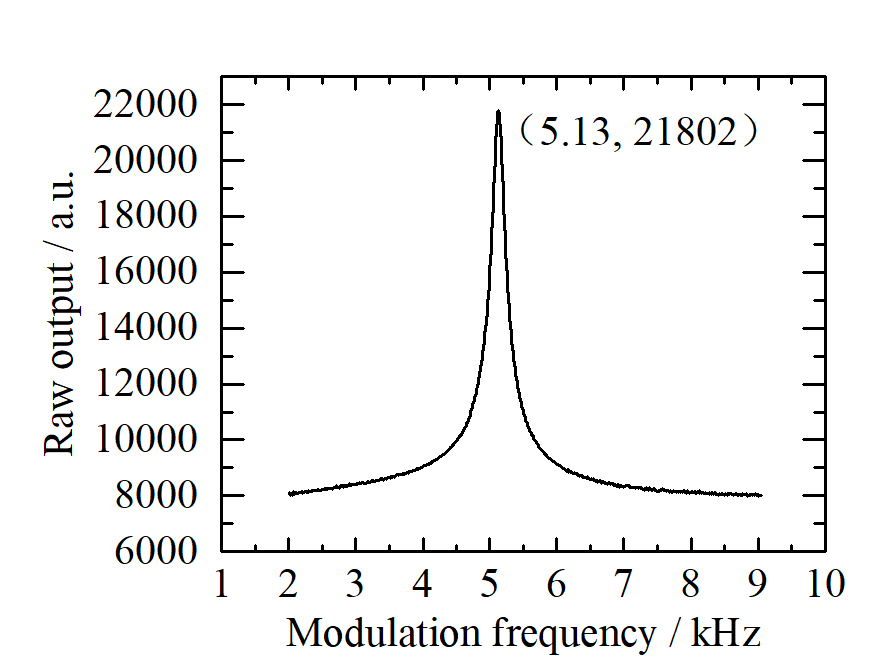
NO2–N2 mixture with a concentration of 202 ppb flows though the PA cell with a mass flow of 200 mL∙min−1 to keep the PA signal from any noteworthy flow noise. Modulation frequency was scanned from 2 to 9 kHz. The norm of orthogonal output was calculated in PC, so that the variation of the signal phase can be ignored. As shown in Figure 4, the resonance frequency of the resonator is 5.13 kHz, which was measured under the ambient pressure, ∼ 25℃. This value is slightly smaller than the theoretical value. The deviation may be caused by the acoustic effect of buffers. The Q factor of the resonator is determined to 13.4 from the curve in Figure 2. The frequency is determined as the modulation frequency.
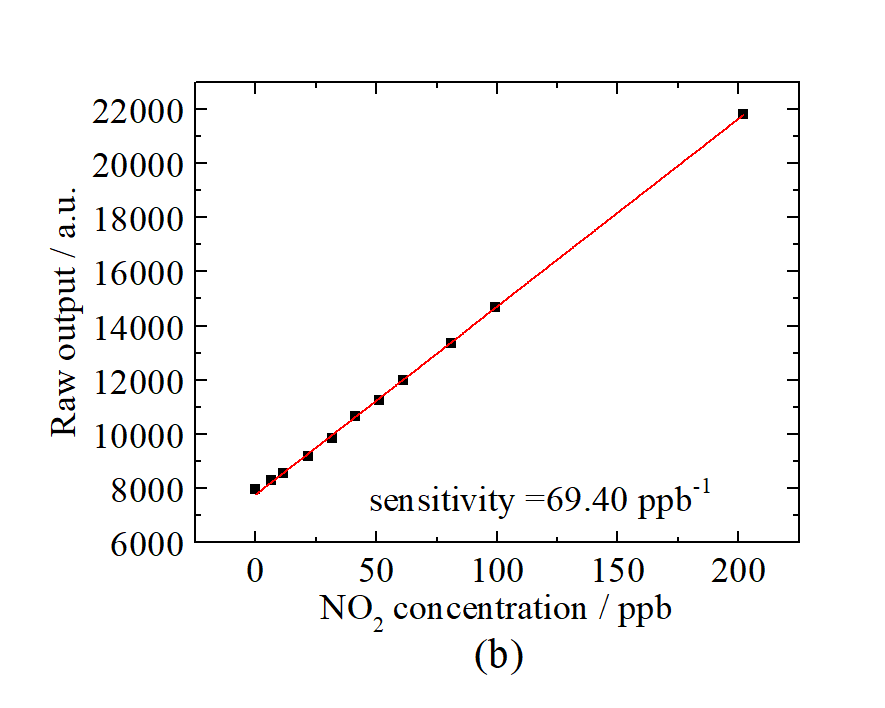
The relationship between the raw output of the DLIA and the concentration of NO2 was measured in the range from pure N2 to 202 ppb. This range covers the safety limits and normal concentration in the polluted area mentioned before. The raw output is the digitalized voltages by the ADC.
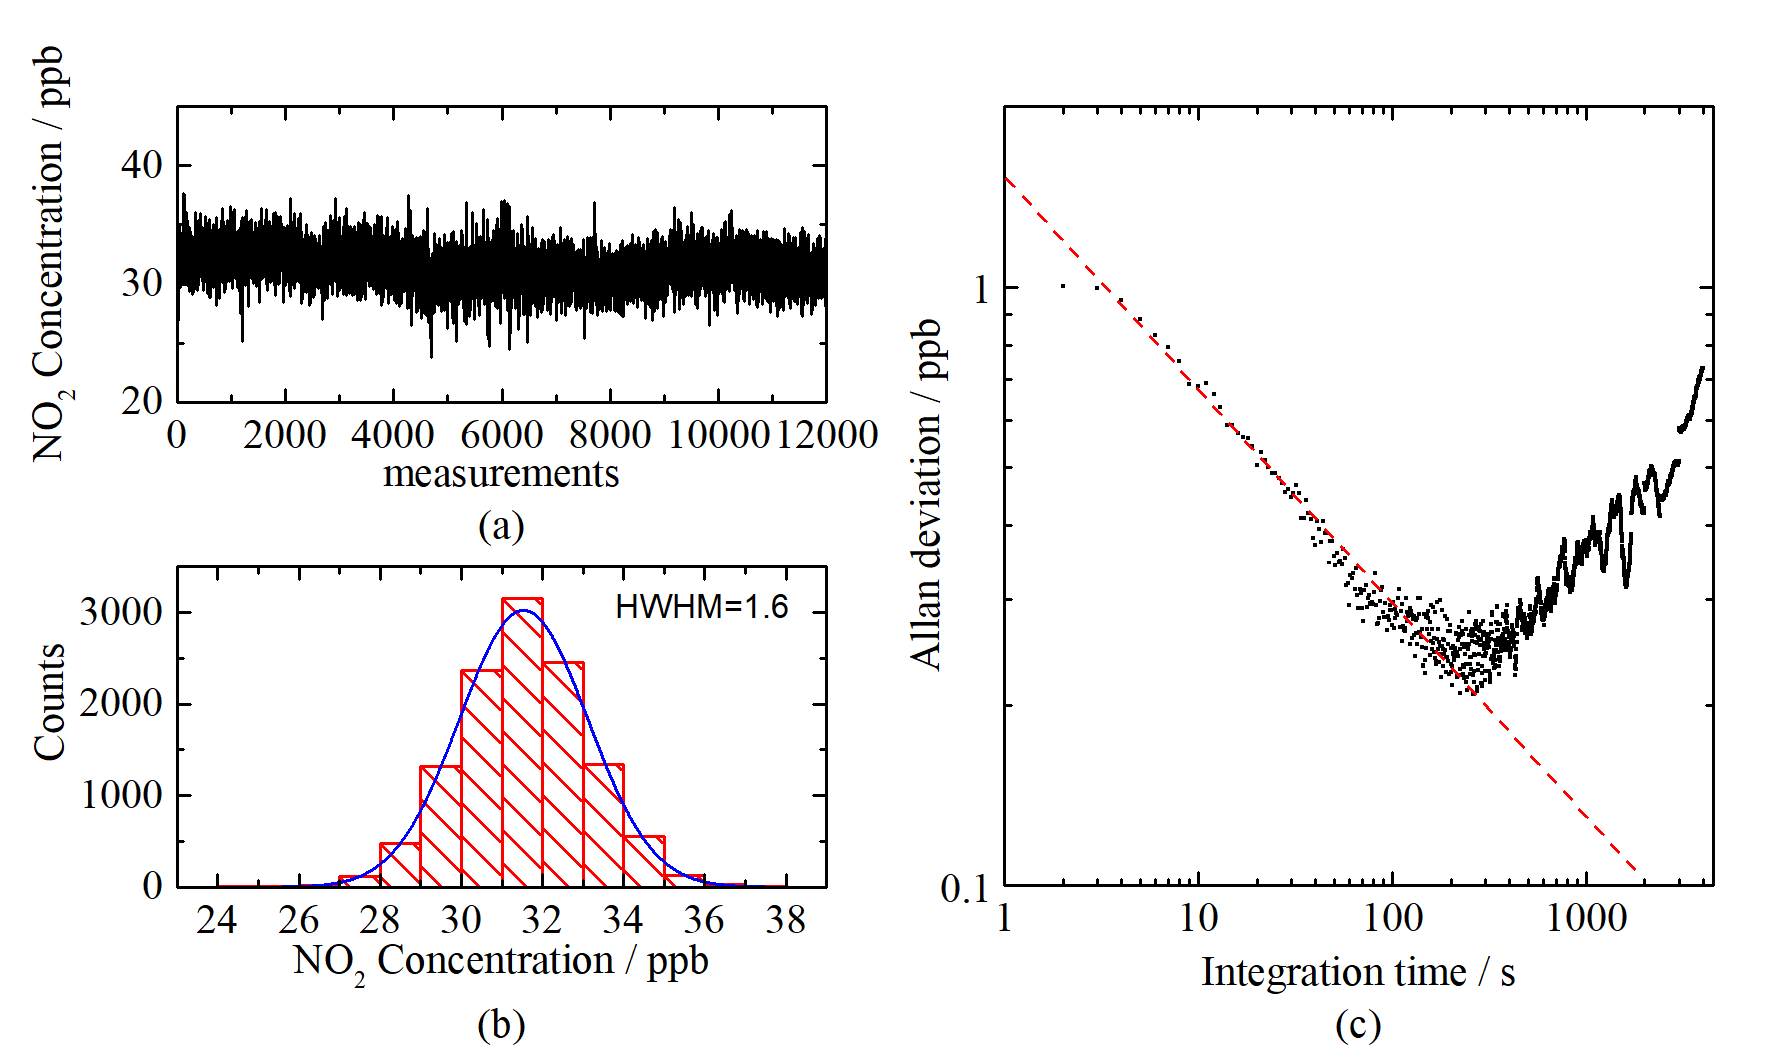
A long-running test was carried out for further evaluation. 31.7 ppb NO2 was measured 12,000 times continuously with an interval of 1 s. The measurement results are shown in Figure 6a. The Gaussian distribution of the measurement results, as shown in Figure 6b, has a half width at half maximum (HWHM) of 1.6 ppb. The stability and potential lowest detectable limit were evaluated with an Allan deviation analysis of the long-running test results, as illustrated in Figure 6c. The lowest detectable limit is found to be 0.25 ppb, with an integration time of 240 s.
This entry is adapted from the peer-reviewed paper 10.3390/s20051270
References
- Mahesh Gudem; Anirban Hazra; Mechanism of the Chemiluminescent Reaction between Nitric Oxide and Ozone. The Journal of Physical Chemistry A 2018, 123, 715-722, 10.1021/acs.jpca.8b08812.
- Sunghoon Park; Soyeon An; Hyunsung Ko; Changhyun Jin; Chongmu Lee; Enhanced NO2 sensing properties of Zn2SnO4-core/ZnO-shell nanorod sensors. Ceramics International 2013, 39, 3539-3545, 10.1016/j.ceramint.2012.10.178.
- Cristian Fàbrega; Luis Fernández; Oriol Monereo; Alba Pons-Balagué; Elena Xuriguera; Olga Casals; Andreas Waag; Joan Daniel Prades; Highly Specific and Wide Range NO2 Sensor with Color Readout. ACS Sensors 2017, 2, 1612-1618, 10.1021/acssensors.7b00463.
- Hendrik Fuchs; William P. Dubé; Brian Lerner; Nicholas Wagner; Eric J. Williams; Steven S. Brown; A Sensitive and Versatile Detector for Atmospheric NO2and NOX Based on Blue Diode Laser Cavity Ring-Down Spectroscopy. Environmental Science & Technology 2009, 43, 7831-7836, 10.1021/es902067h.
- Gottipaty N. Rao; Andreas Karpf; High sensitivity detection of NO2 employing cavity ringdown spectroscopy and an external cavity continuously tunable quantum cascade laser.. Applied Optics 2010, 49, 4906-4914, 10.1364/ao.49.004906.
- Jun Duan; Min Qin; Bin Ouyang; Wu Fang; X. Li; Keding Lu; Ke Tang; Shuaixi Liang; Fanhao Meng; Zhaokun Hu; et al. Development of an incoherent broadband cavity-enhanced absorption spectrometer for in situ measurements of HONO and NO2. Atmospheric Measurement Techniques 2018, 11, 4531-4543, 10.5194/amt-11-4531-2018.
- Douglas A. Day; P. J. Wooldridge; M. B. Dillon; Joel A. Thornton; Ronald C. Cohen; A thermal dissociation laser-induced fluorescence instrument for in situ detection of NO2, peroxy nitrates, alkyl nitrates, and HNO3. Journal of Geophysical Research 2002, 107, ACH 4-1, 10.1029/2001jd000779.
- Jana Jagerska; Pierre Jouy; Béla Tuzson; Herbert Looser; Markus Mangold; Patrik Soltic; Andreas Hugi; Rolf Brönnimann; Jérôme Faist; Lukas Emmenegger; et al. Simultaneous measurement of NO and NO(2) by dual-wavelength quantum cascade laser spectroscopy.. Optics Express 2015, 23, 1512-1522, 10.1364/oe.23.001512.
- R. L. Pastel; R. C. Sausa; Detection of NO and NO_2 by (2 + 2) resonance-enhanced multiphoton ionization and photoacoustic spectroscopy near 454 nm. Applied Optics 1996, 35, 4046, 10.1364/ao.35.004046.
- V. Slezak; High-precision pulsed photoacoustic spectroscopy in NO 2 -N 2. Applied Physics B 2001, 73, 751-755, 10.1007/s003400100686.
- Veronica Slezak; Guillermo Santiago; Alejandro L. Peuriot; Photoacoustic detection of NO2 traces with CW and pulsed green lasers. Optics and Lasers in Engineering 2003, 40, 33-41, 10.1016/s0143-8166(02)00062-3.
- Michael Pushkarsky; Alexei Tsekoun; Ilya G. Dunayevskiy; Rowel Go; Chandra Patel; Sub-parts-per-billion level detection of NO2 using room-temperature quantum cascade lasers. Proceedings of the National Academy of Sciences 2006, 103, 10846-10849, 10.1073/pnas.0604238103.
- Hongming Yi; Kun Liu; Weidong Chen; Tu Tan; Lei Wang; XiaoMing Gao; Application of a broadband blue laser diode to trace NO2 detection using off-beam quartz-enhanced photoacoustic spectroscopy.. Optics Letters 2011, 36, 481-483, 10.1364/ol.36.000481.
- Jari Peltola; Tuomas Hieta; Markku Vainio; Parts-per-trillion-level detection of nitrogen dioxide by cantilever-enhanced photo-acoustic spectroscopy.. Optics Letters 2015, 40, 2933-2936, 10.1364/ol.40.002933.
- Xukun Yin; Lei Dong; Hongpeng Wu; Huadan Zheng; 光马 维; Lei Zhang; Wangbao Yin; Suotang Jia; Frank K. Tittel; Sub-ppb nitrogen dioxide detection with a large linear dynamic range by use of a differential photoacoustic cell and a 3.5 W blue multimode diode laser. Sensors and Actuators B: Chemical 2017, 247, 329-335, 10.1016/j.snb.2017.03.058.
- Thomas Rück; Rudolf Bierl; Frank-Michael Matysik; Low-cost photoacoustic NO 2 trace gas monitoring at the pptV-level. Sensors and Actuators A: Physical 2017, 263, 501-509, 10.1016/j.sna.2017.06.036.
- Johannes Kapp; Christian Weber; Katrin Schmitt; Hans-Fridtjof Pernau; Jürgen Wöllenstein; Resonant Photoacoustic Spectroscopy of NO2 with a UV-LED Based Sensor †. Sensors 2019, 19, 724, 10.3390/s19030724.
- Ann Carine Vandaele; C. Hermans; P.C. Simon; M. Carleer; R. Colin; S. Fally; M.F. Mérienne; A. Jenouvrier; B. Coquart; Measurements of the NO2 absorption cross-section from 42 000 cm−1 to 10 000 cm−1 (238–1000 nm) at 220 K and 294 K. Journal of Quantitative Spectroscopy and Radiative Transfer 1998, 59, 171-184, 10.1016/s0022-4073(97)00168-4.


