Design of a spirometer with an automatic disinfection system and remote access to patient data through a WEB page, which uses ozone as a disinfection element in the equipment, to avoid contagion due to the use of the mouthpiece with different patients during spirometry tests.
- Spirometer
- Disinfection systems
- Lung diseases
Article
Spirometer with automatic disinfection
Nancy Guerrón 1*, Rodolfo Maestre 2, Andrés Bonilla 1 and Karen Toaquiza 1
1 Universidad de las Fuerzas Armadas ESPE; neguerronl@espe.edu.ec; aebonilla2@espe.edu.ec; kttoaquiza@espe.edu.ec
2 Universidad Politécnica de Sinaloa; jmaestre@upsin.edu.mx
* Correspondence: neguerron@espe.edu.ec
Abstract: Given the increase in lung diseases in recent years, a turbine spirometer with semi-automatic disinfection and remote monitoring was designed and built at the University of the Armed Forces ESPE. Validation tests were performed with ten users of internal medicine and outpatient clinic of the Andean hospital in the city of Riobamba and the cooperation of a pulmonologist of the hospital. The spirometry data were compared with those produced by a commercial spirometer of similar characteristics; no significant differences were found between the two devices (t =3.27). Laboratory tests showed that the ozone disinfection system applied eliminates bacteria that can incubate due to the reuse of the equipment's nozzle, which will allow a reduction in the cost of spirometry tests performed by the hospital on its patients.
Keywords: Spirometer; Disinfection systems; Lung diseases.
1. Introduction
Given the worldwide increase in the number of respiratory conditions due to the presence of COVID19 since December 2019, a number of accessible and easy-to-use measurement equipment and systems have been developed, focused on providing medical services remotely in various areas of study such as respiratory medicine.
Spirometry is a noninvasive medical test, mainly used for the diagnosis and follow-up of respiratory pathologies. This standardized test evaluates the mechanical properties of the respiratory system and identifies airflow obstructions [1]. The interpretation of spirometry is based on comparing the values produced by the patient with those that would theoretically correspond to a healthy individual with the same anthropometric characteristics [2].
The spirometry equipments called pneumotachograph, incorporate mathematical algorithms and use different types of sensors, such as pressure, piezoelectric, ultrasonic, wedge, turbine, or others, which provide data on the pressure difference according to the expiration of each individual. Once the physical signal has been interpreted, it will be converted into an electrical signal, to be analyzed digitally. In this study, the turbine pneumotachograph was chosen, which is described below.
A portable spirometer was developed to diagnose chronic obstructive pulmonary disease [3] and another to diagnose various lung diseases [4]. Diaz [5] developed a Portable Electronic Spirometer with Visualization on Mobile Device. Several low-cost turbine spirometers have been developed as metrological support [6] or for lung disease detection [7] .Some spirometers use various control methods for data processing, such as Mazón's [8], where fuzzy control in the LabVIEW platform is used for data processing. Spirometers are also found that use the internet of things (IoMT) for the interconnection of various electronic devices and the online display of spirometric results [9]. In a recent study [10], a machine learning system was developed to obtain the lung age of a person by spirometry. In this study conducted with sixty-two patients [11], two spirometers were compared, one portable and the other desktop, obtaining similar readings; therefore, both types could be useful in the measurement of spirometric parameters in patients with obstructive respiratory diseases.
Spirometry tests present a high exposure to a risk of contagion for both patients and medical personnel, therefore, recommendations have been developed regarding the use of the spirometer to avoid Covid-19 contagion [12]. There are also recommendations on the requirements for conventional spirometers and portable equipment, as well as on hygiene and quality control measures for spirometers [2].
In a conventional spirometry test, the mouthpiece used by the patient must be sterilized or discarded after the test, implying an additional expense for public health institutions, so this study will develop an automatic disinfection method that optimizes the use of the device and eliminates the possibility of contagion to other patients.
This study will design and test a digital turbine spirometer with a remote monitoring system using IoMT to evaluate pulmonary function in patients in the internal medicine and outpatient areas of the Andean Hospital in the city of Riobamba, Ecuador. This equipment will be equipped with an automatic disinfection system to prevent contagion.
1.1. Expirometric variables
The main variables in forced spirometry are: Forced vital capacity (FVC), forced expiratory volume in the first second (FEV1), FEV₁/FVC ratio and peak expiratory flow (PEF) [2].
- FVC represents the maximum volume of air exhaled in a maximal forced expiratory maneuver, initiated after a maximal inspiratory maneuver;
- FEV1 is the amount of air that is moved in the first second of a forced exhalation;
- FEV₁/FVC is a rate, which relates the first two variables, so it is usually represented as a percentage (its nominal value in adults is >70%);
- PEF is the maximum amount of air that can be exhaled per second in a forced expiration. It represents the maximum peak flow obtained in a flow-volume curve (See Figure 1) and occurs before 15% of the FVC has been expelled.
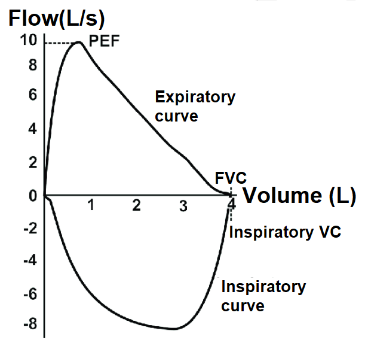
Figure 1. Flow-volume curve. Available via license: Creative Commons Attribution-Noncommercial 4.0 International
1.2. Turbine Pneumotachograph
The turbine pneumotachograph shown in Figure 2 is designed to transform the exhaled air flow signal into an electrical signal capable of being manipulated by any electronic system; it consists of a shaft on which a propeller rotates thanks to the air flow. It is easy to implement, resistant to disturbances, accessible in price and dimensioning, for the work environment projected in this study. By means of a sensor, the rotation speed is measured and, based on these revolutions, the air flow is calculated, which when integrated, the expiratory volume is obtained [13].
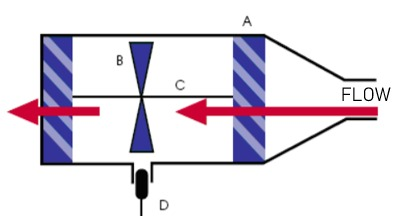
Figure 2. Turbine pneumotacograph. A represents the blades to direct the air flow, B: propeller and C: propeller shaft, D; optical sensor for speed measurement. Adapted from [13], page 39.
To calculate the flow velocity of exhaled air, the equation 1 is used:
|
(1) |
|---|
Where:
vh= propeller speed
vf= air flow rate
ct= turbine constant
To calculate the air flow, Bernoulli's principle is used:
|
Where: Q= Volumetric Flow Ac= Circular nozzle area Subsequently, the lung volume is calculated, using the same Bernoulli principle: |
(2) |
|---|---|
|
Where: Δt= Time variation ΔV= Volume variation |
(3) |
Since the volumetric flow is updated at each sampling time interval, a straight line is defined (equation 4) passing through the points A= (x1, y1) corresponding to the initial volumetric flow at t1 and B = (x2, y2) corresponding to the final volumetric flow at t2.
The integral with respect to time of this curve yields lung volume (equation 4)
|
(4) |
|---|
1.3. Medical equipment disinfection systems
These systems are very important for the prevention of infections associated with inappropriate disinfection of reusable objects. Among the disinfection alternatives are chemical agents, ultraviolet light, ultrasound, use of disposable material and water vapor [14][15][16][17] [18]. The results of Orellana, et al. [19] show that ozone used for a period of time of 25 minutes is an excellent disinfectant, while after 30 minutes it acts as a sterilizer; in the analysis performed on 17 hand-pieces and 51 drills for dental use, it was observed that the number of colonies of 10 different types of bacteria decreases as the exposure time increases.
In 2020, Taran, et al. [20] in their research "Portable ozone sterilization device with mechanical and ultrasonic cleaning units for dentistry" developed a portable device for cleaning and sterilization of dental instruments with ozone at a concentration of 8.5 mg/l. As results, they obtained that after 10 minutes of exposure, Pseudomonas aeruginosa cells are completely eliminated, and after 20 minutes, the inactivation of Escherichia coli and Staphylococcus aureus bacteria occurs after 30 minutes of treatment.
For this research, ozone disinfection was chosen, which is a gas with high oxidizing power and an effective and safe solution for disinfecting hospitals and food industries [21]. Since it is a gas that spreads through each area of the equipment that needs to be sterilized, it does not have the capacity to damage the surfaces to which it is exposed, given that the ozone concentrations and the exposure time necessary to exterminate contaminating agents are very low and it does not leave residues that are harmful to humans [22].
2. Materials and Methods
There are three sections: Section 2.1 contains a description of the study participants; Section 2.2 contains the design of the spirometry system. Finally, section 2.3 defines the study variables.
2.1. Participants
Ten adult patients from the Riobamba Hospital (see Table 1), including internal medicine and external consultation, participated in the validation of the prototype developed. The participants did not present pulmonary diseases at the time of the test.
Table 1. Anthropometric characteristics of the patients in this study.
|
Patient |
Age |
Size |
Weight |
Gender |
Specialty |
|---|---|---|---|---|---|
|
1 |
62 |
165 |
62 |
Male |
External consultation |
|
2 |
26 |
165 |
64 |
Male |
External consultation |
|
3 |
30 |
155 |
55 |
Female |
External consultation |
|
4 |
47 |
150 |
61 |
Female |
External consultation |
|
5 |
40 |
155 |
74 |
Female |
External consultation |
|
6 |
59 |
154 |
67 |
Female |
Internal medicine |
|
7 |
42 |
155 |
58 |
Female |
Internal medicine |
|
8 |
33 |
160 |
62 |
Male |
Internal medicine |
|
9 |
64 |
168 |
65 |
Male |
Internal medicine |
|
10 |
31 |
52 |
156 |
Male |
Internal medicine |
2.2. Spirometry System
2.2.1. CAD of the pneumotachograph
SolidWorks software was used for the computer aided design (CAD), which models in 3D each of the components that make up the spirometer. The mechanical structure of the pneumotachograph or case is intended to serve as the main support between the user performing the spirometry test and the sensor that will interpret the information. It was taken into consideration measures that allow a correct grip of the user, as well as a slight inclination in the profile of the case, which allows more slack in the wrist while the patient is using the device (See Figure 3)
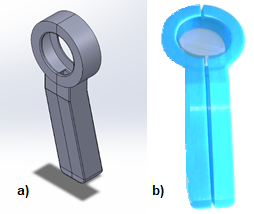
Figure 3. a) CAD design; b) 3D printing on PLA
The speed of the turbine is measured by optical sensors. The optical sensor consists of infrared emitter-receiver LEDs with 3mm encapsulation, which can be used to interpret the received signal and obtain the necessary data for the spirometry test.
The sensors are placed in the pneumotachograph by means of a coupling (See Figure 4) that allows the appropriate distribution of two pairs of sensors to monitor the behavior of the turbine propeller and determine the direction of rotation of the turbine, without the need to have direct contact or interfere with it during the spirometry test.
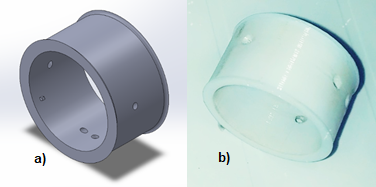
Figure 4. a) CAD design; b) PLA 3D printing of the coupling
2.2.2. Disinfection system design
The disinfection process lasts 30 minutes and is carried out as follows:
- From 0 to 10 minutes, a reactor is activated to generate the gas necessary for disinfection. A fan system is activated to ensure that the ozone reaches the inside of the equipment.
- From 11 to 20 minutes, the reactor is deactivated, the fans continue to run to ensure that the ozone disinfects all the equipment.
- From 21 to 30 minutes, a servo is activated to open the fans. The fans continue to run in order to help the ozone residue to escape so that the disinfection chamber can be ventilated.
At the end of the process, the fans stop running, the servo is deactivated to close the vents and the disinfection chamber can be used again.
The disinfection system consists of an ozone generator reactor, model OZ10G, which requires 110V power supply to decompose the oxygen in the environment (See Figure 6). The power circuit allows manipulation of this high consumption load and is separated from the control circuit by optocouplers.
The ozone distribution system must be carried out in a totally closed environment, which requires an ozone distribution circuit as shown in Figure 5.
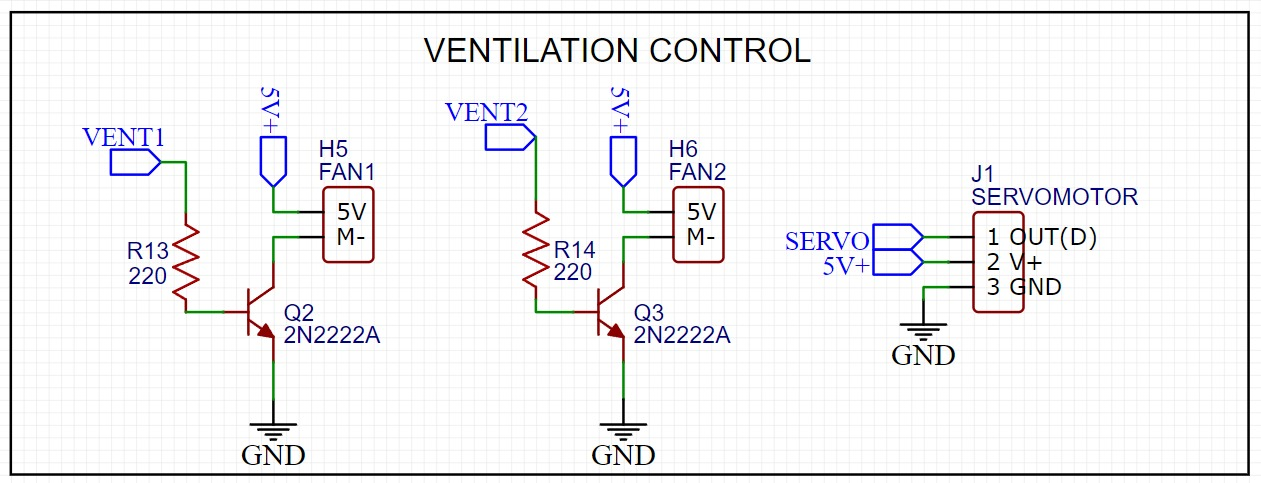
Figure 5. Ventilation control circuit of the pneumotachographs.
To automate this procedure, a system of fans (See Figure 6) is implemented that open automatically by means of a rack and pinion system that act by means of a servomotor and two fans, which will be operating by means of an On-Off control as well as the ozone generator reactor.
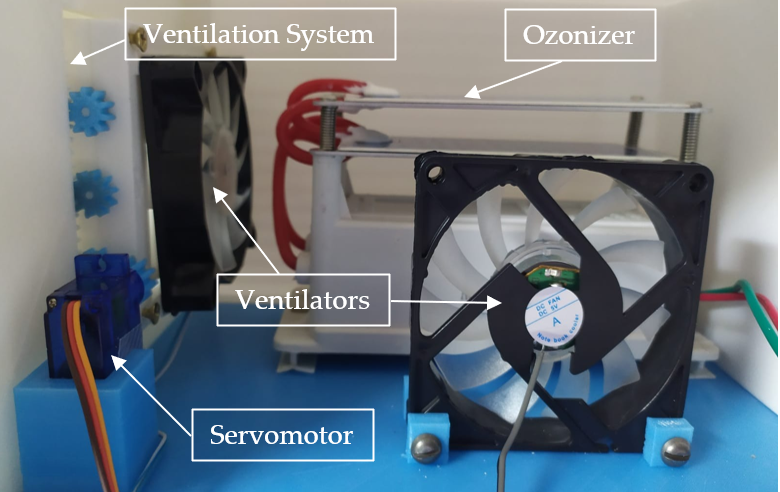
Figure 6. Pneumotachograph disinfection chamber.
2.2.3. Conditioning and data acquisition system
The conditioning system allows the reading and interpretation of the signals provided by the sensors, minimizing noise and allowing a clean signal to pass through to the data acquisition card. The sensor signal is sent to a non-inverting amplifier, which is also used as an isolation circuit between the data acquisition card and the sensor (See Figure 7).
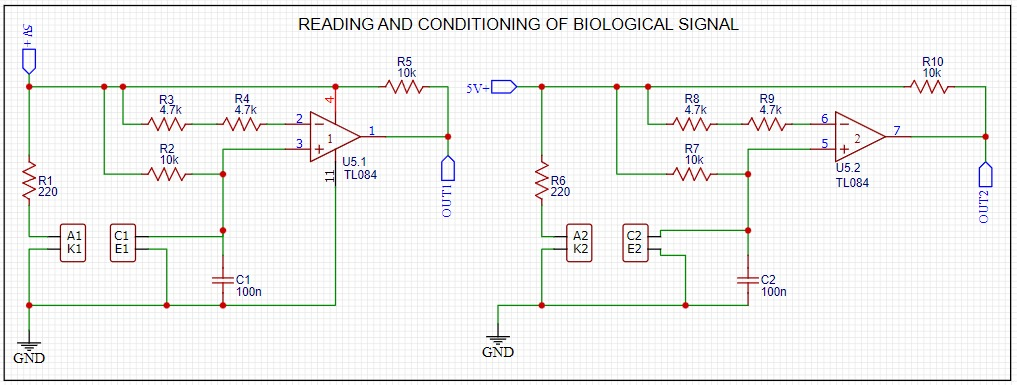
Figure 7. Biological signal reading and conditioning.
For data acquisition, the ESP8266 NodeMCU card was used, due to its small size, low cost and because it facilitates connection to a Wifi network. The HMI screen chosen was the Nextion NX8048T050, because of its compatibility with the data card, it is also tactile and has its own software and libraries that facilitate programming. Nextion Editor was used to develop the graphical interface (HMI).
2.2.4. Printed circuit and final design
Two 70x110mm PCB printed circuit boards were designed, measures that fit the CAD that has been proposed in this research. The first board contains the control elements, the electronic cards and the connection to the power supply. The second board houses the electronic components.
The design of the base allows the prototype to work in two separate spaces, one corresponding to the circuitry and the other to the disinfection system. The front part of the prototype is used for displaying the HMI screen and the rear part is used for the placement of the vents (See Figure 8).
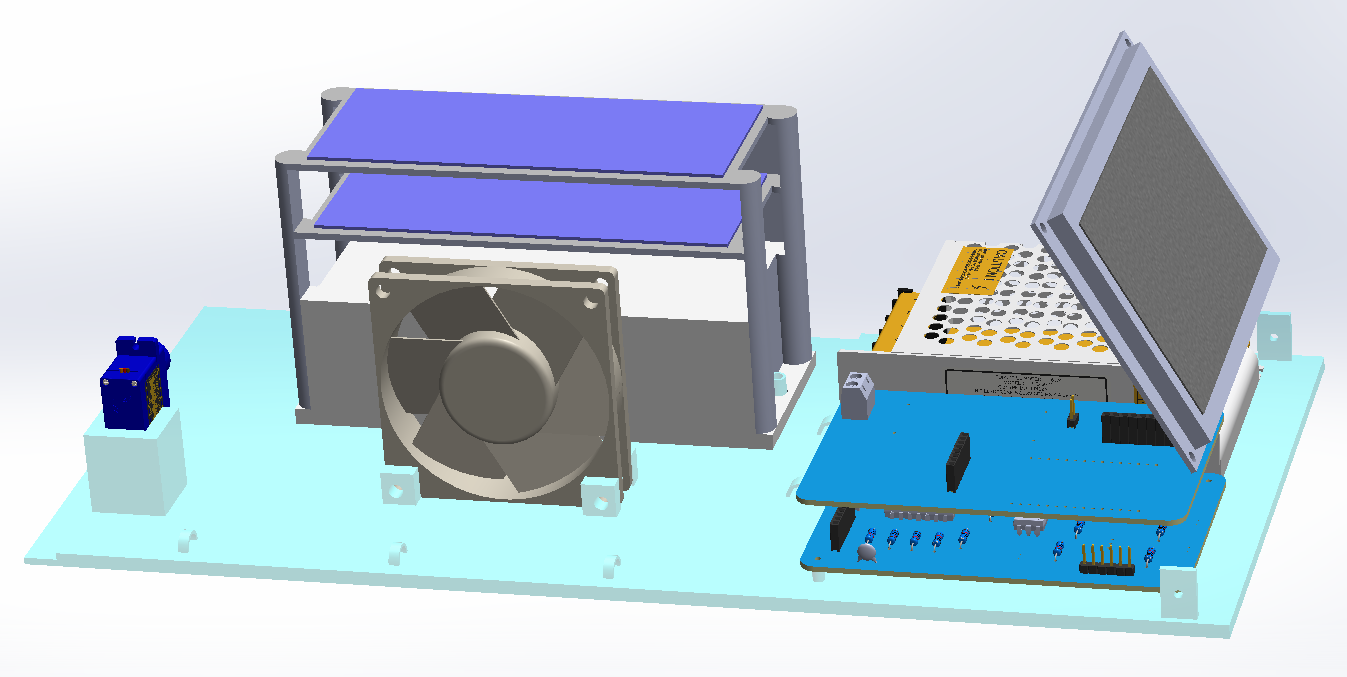
Figure 8. CAD prototype of the spirometer base.
Finally, a top cover was designed to isolate the entire disinfection system to avoid possible problems between the interaction of ozone and the circuitry, and at the same time to be easy to assemble with the rest of the parts. The parts are 3D printed with poly lactic acid (PLA), which is a long lasting, low cost material and its external porosity can be covered with acrylic paint. The final assembled prototype can be seen in Figure 9.
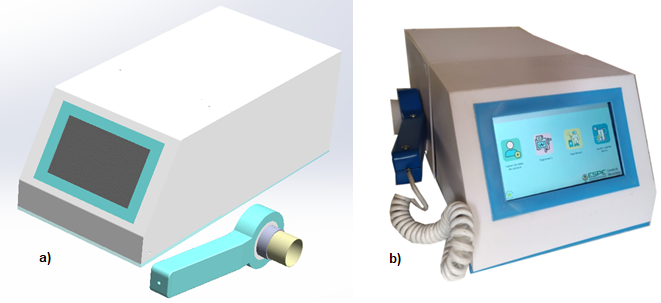
Figure 9. Spirometer a) CAD final spirometer; b) Final 3D printed prototype.
2.2.5. Design of the user interface
Figure 10 shows the structure of the local HMI which controls all the functions of the spirometer.
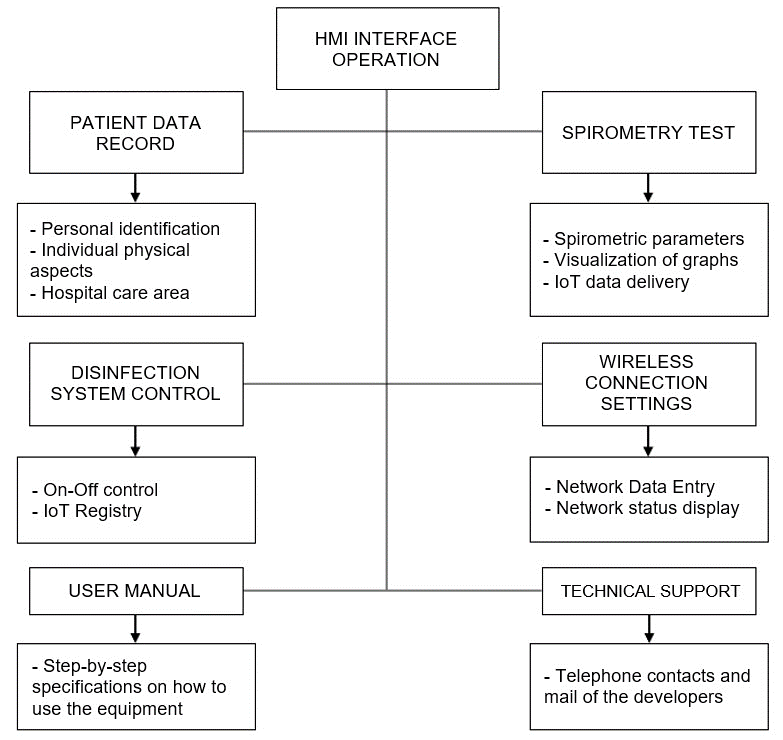
Figure 10. Local HMI structure
The main HMI interface includes four sections: patient data logging, spirometry test, disinfection control and device settings and configuration.
Secondary interfaces are used for data verification and test start, another screen is used to configure the WiFi network, for data communication via IoMT, so that a data log can be kept on a web page for each patient and thus be accessible from any device with internet connectivity. Another screen is used to review the test data, which can be viewed in graphical, textual or printed form. Finally, another screen was developed to control the disinfection system (See Figure 11).
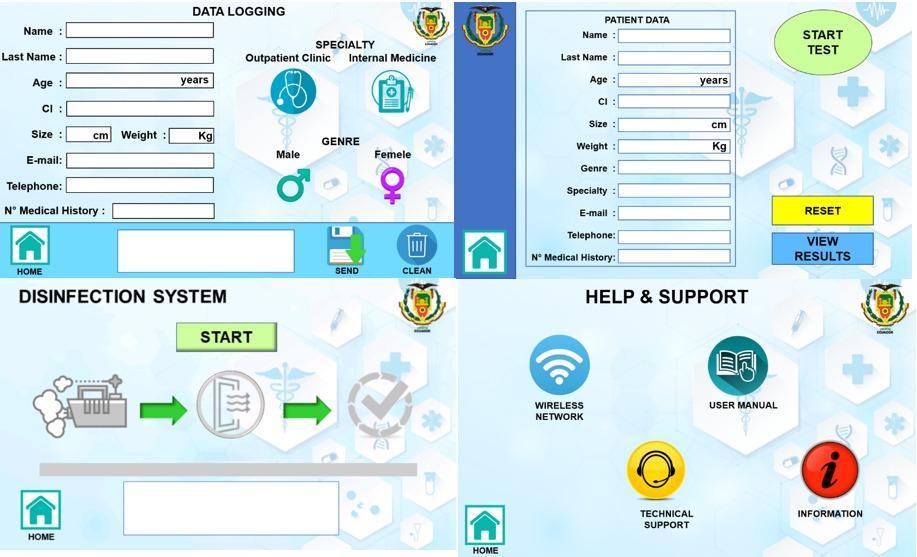
Figure 11. Main HMI interface
2.2.6. Remote Interface Design
To visualize patient information and spirometric results, a web page was designed in HTML and CSS in Visual Studio Code (See Figure 12) and to establish communication between the ESP8266 NodeMCU, PHP language, phpMyAdmin and Heidi SQL were used.
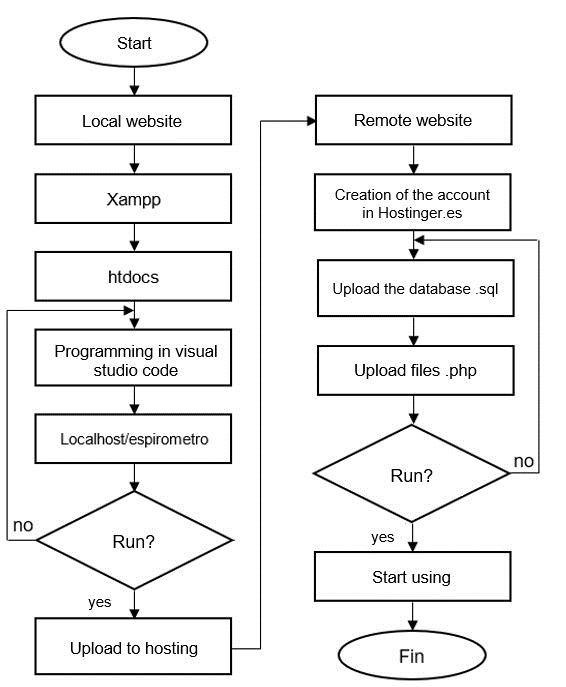
Figure 12. WEB page design flowchart
The results of the main page are shown in Figure 13.
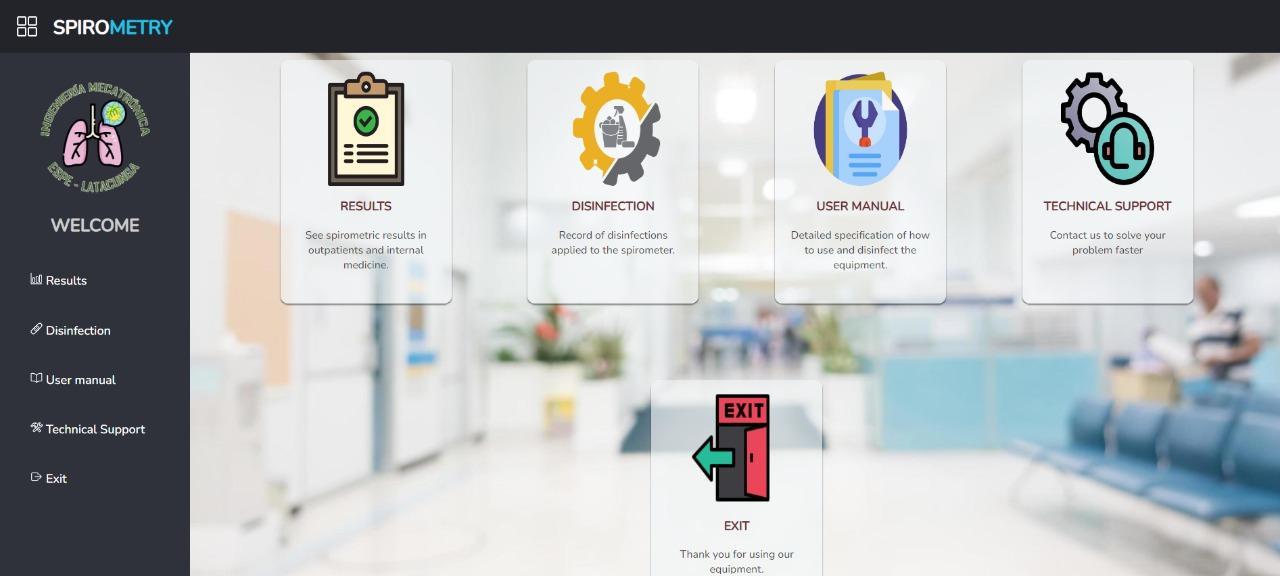
Figure 13. Main window of the WEB page
2.3. Study variables
Table 2 summarizes the variables of this study.
2.3.1. Spirometric Variables
According to García-Río, Calle, Burgos, & Casan (2013) the theoretical spirometric values are determined by a series of equations that depend on the anthropometric characteristics of the patients (sex, age, height, weight).
With the developed spirometer, the FVC, FEV1, PEF and FEV1/FVC values defined in section 1.1 can be estimated. A weighted average low-pass digital filter is applied to the input data to remove noise and interference. The filtered output is stored in two different vectors, one for calculating volumetric flow and one for lung volume.
- FCV, obtained as the last value stored in the lung volume vector.
- FVE1, a sampling period accounting for a sum of 1000 milliseconds is used with the volumetric flow vector.
- PEF is the largest value detected in the volumetric flow vector.
- FVC/FEV1 is the ratio of the FVC value to FVE1.
2.3.2. Disinfection system variables
Before and after the disinfection process, samples will be taken to determine the presence of pathogenic elements before and after each spirometry test. Sterile gloves, surgical mask and swabs, which are changed for each patient, are used to take the samples. These samples are analyzed by a laboratory specialized in microbiology, which performs a culture test to determine the presence or absence of microorganisms.
Table 2. Study Variables
|
Spirometric Variables |
Disinfection System Variables |
|
|---|---|---|
|
FCV, FVE1, PEF, FVC/FEV1 |
microbiological analysis |
3. Results
The tests performed with the prototype spirometer to ten outpatients and internal medicine patients at the Hospital Andino in the city of Riobamba were compared with a commercial spirometer MIR Spirobank Smart Spirometer available at the Hospital.
3.1. Spirometry tests
The results of the spirometric tests are shown in Table 3.
Table 3. Results Spirometry tests
|
Patient |
FVC (Lt) |
FEV1 (Lt/s) |
PEF(Lt) |
FEV1/FVC (%) |
||||
|---|---|---|---|---|---|---|---|---|
|
P |
C |
P |
C |
P |
C |
P |
C |
|
|
1 |
4.08 |
4.22 |
3.28 |
3.2 |
7.32 |
7.01 |
73.9 |
76.7 |
|
2 |
4.59 |
4.6 |
4.07 |
3.89 |
9.01 |
8.58 |
81.11 |
84.71 |
|
3 |
3.54 |
3.41 |
3.02 |
2.9 |
6.18 |
6.1 |
86.38 |
85.31 |
|
4 |
3.05 |
2.93 |
2.48 |
2.39 |
5.46 |
5.43 |
82.86 |
81.61 |
|
5 |
2.97 |
2.86 |
2.68 |
2.56 |
5.24 |
5.05 |
85.73 |
89.51 |
|
6 |
2.91 |
2.82 |
2.30 |
2.24 |
5.28 |
5.31 |
78.86 |
79.87 |
|
7 |
3.41 |
3.26 |
2.78 |
2.67 |
5.82 |
5.8 |
83.60 |
82.22 |
|
8 |
4.15 |
4.17 |
3.63 |
3.48 |
8.22 |
7.86 |
78.63 |
80.23 |
|
9 |
4.04 |
3.89 |
3.1 |
3.01 |
7.16 |
7.53 |
73.82 |
77.49 |
|
10 |
3.62 |
3.45 |
3.06 |
2.92 |
6.19 |
6.11 |
85.95 |
84.98 |
Note: P represents data taken by the prototype and C data obtained by the commercial spirometer.
The dependence of the four variables was evaluated with a two-tailed t-student test for 9 degrees of freedom, which was statistically non-significant (t=3.27), compared to t=2.26 established for a confidence margin of 95%. Consequently, the readings of the two spirometers are valid to evaluate the spirometric parameters. In addition, the difference in the reading of spirometric variables with the prototype designed is less than 4% compared to the commercial spirometer.
3.2. Disinfection system results
Two samples were taken using sterile swabs. The first one is called "contaminated spirometer" and the second one is called "sterilized spirometer". The first sample is taken after the spirometry test, while the second sample is taken after applying the disinfection process to the equipment. The two samples are sent to a microbiological laboratory for analysis.
In the ten patients the laboratory tests performed after the disinfection process show that there is no bacterial growth. Therefore, the disinfection system works in 100% of the cases analyzed.
The following is an example of the analysis performed on a patient.
3.2.1. Contaminated spirometer
Growing:
ISOLATED GERM: Streptococcus viridans are present.
ANTIBIOGRAM:
Amikacin: Susceptible
Amoxa + AC Clavul: Sensitive
Ampicillin + Sul: Susceptible
Cephalexin: Sensitive
Ceefoxitin: Susceptible
Ciprofloxacin: Resistant
Clindamycin: Resistant
Erythromycin: Susceptible
Oxacillin: Resistant
Trimethoprim Sulfa: Susceptible.
3.2.2. Sterilized spirometer
Growing:
ISOLATED GERM: No bacterial growth at 24 and 48 hours of incubation
4. Discussion
Breathing exposes the body to a number of pollutants, which could be the cause of a number of lung diseases, leading to requests for spirometry tests. The spirometry technique completed in the last 50 years of the 20th century involves standardized and rigorous processes approved by the European Respiratory Society (ERS) and the American Thoracic Society (ATS) to reach valid and diagnostic conclusions [23].
The equipment developed in this research work not only considered international standards but also auto-disinfection as an economical alternative to avoid contagion in the users of the equipment, at the end of the spirometric test.
Undoubtedly, this invention will concur in a future patent, since it reduces the cost of the test in public hospitals and makes it easier to obtain reliable data for the diagnosis performed by doctors in the hospital and whose results can be visualized from all healthcare settings, for their collaboration.
To standardize the treatment of spirometry-related data and enable information exchange, Salas [24] used the CDA R2 (Clinical Document Architecture, Release 2) standard of HL7 (Health Level Seven) version 3. In this work all the data provided by the spirometer can be visualized in a remote interface programmed in HTML, CSS and PHP whose communication with the data acquisition card is based on the HTTP protocol establishing an IoMT network connection; the system allows the use of security credentials to access patient information.
Author Contributions: Conceptualization, supervision, revision, analysis and writing original draft preparation, Nancy Guerron; methodology, investigation, resources, software, and validation, Andrés Bonilla, Karen Toaquiza; review, Rodolfo Maestre. All authors have read and agreed to the published version of the manuscript.
Funding: This research received no external funding.
Informed Consent Statement: Informed consent was obtained from all subjects involved in the study.
Acknowledgments: This research was supported by Hospital Andino on the Riobamba city where the tests with users were conducted. We thank to the University of army by to administrative support in this study. Special thanks to participants for spending their time and effort in this study.
Conflicts of Interest: The authors declare no conflict of interest.
References
1. Sociedad Mexicana de Estudios sobre Tuberculosis y Enfermedades del Aparato Respiratorio. RE, Torre-Bouscoulet L, Villca-Alá N, et al (2016) Neumologia y cirugía de tórax. Unidad de Patología, Sanatorio de Huipulco
2. García-Río F, Calle M, Burgos F, et al (2013) Spirometry. Arch Bronconeumol 49:388–401. https://doi.org/10.1016/J.ARBR.2013.07.007
3. Harun Al Rasyid MU, Kemalasari, Sulistiyo M, Sukaridhoto S (2018) Design and Development of Portable Spirometer. In: 2018 IEEE International Conference on Consumer Electronics-Taiwan (ICCE-TW). IEEE, pp 1–2
4. Ibrahim SN, Jusoh AZ, Malik NA, Mazalan S (2017) Development of portable digital spirometer using NI sbRIO. In: 2017 IEEE 4th International Conference on Smart Instrumentation, Measurement and Application (ICSIMA). IEEE, Putrajaya, pp 1–4
5. Gómez Chacon AF, Díaz Suarez RA, Pabon Castillo VA, Vera Medina SF (2019) Espirómetro electrónico portátil con visualización en dispositivo móvil. Sci Tech 24:154. https://doi.org/10.22517/23447214.18451
6. Sokol YI, Tomashevsky RS, Kolisnyk KV (2016) Turbine spirometers metrological support. In: 2016 International Conference on Electronics and Information Technology (EIT). IEEE, Odessa, pp 1–4
7. Sridevi P, Kundu P, Islam T, et al (2018) A Low-cost Venturi Tube Spirometer for the Diagnosis of COPD. In: TENCON 2018 - 2018 IEEE Region 10 Conference. IEEE, Jeju, pp 0723–0726
8. ’Mazón A’ RS’ SE ’Ramírez, M, ’Cabrera A (2016) MEDICIÓN DEL VOLUMEN PULMONAR UTILIZANDO CONTROL DIFUSO EN LA PLATAFORMA LABVIEW. 2016 VII Congr. Nac. Tecnol. Apl. a Ciencias Salud 1–8
9. ’Mendoza P ’Ávila K ’Vilora C ’Jabba D (2016) Internet of Things and Home-Centered Health. Salud Uninorte 32:337–351
10. Mukhopadhyay S, Chen Y, Morais S, et al (2022) A Machine-Learning Model for Lung Age Forecasting by Analyzing Exhalations. https://doi.org/10.3390/s22031106
11. Boros PW, Maciejewski A, Nowicki MM, Wesołowski S (2022) PRACA ORYGINALNA Comparability of portable and desktop spirometry: a randomized, parallel assignment, open-label clinical trial. https://doi.org/10.5603/ARM.a2022.0013
12. ’Ferreira A (2020) Espirometría en tiempos de COVID-19. Rev Alerg e Inmunol Clínica 2020 1–3
13. Mejía G (2010) Diseño y desarrollo de un espirómetro de flujo de bajo costo. Universidad Nacional Autónoma de México
14. (2007) Desinfección de agua contaminada empleando ultrasonido de 1MHz. en presencia de nanofibras de Carbono
15. Castillo ES del, Pérez AR, Alfonso GD (2002) Nuevo sistema de desinfección de alto nivel por vapor fluente a baja temperatura. Enfermedades Infecc y Microbiol 22:31–38
16. Estudio del diseño e implementación de un sistema de pruebas para desinfección de equipos de protección personal N95 mediante radiación ultravioleta. https://tesis.pucp.edu.pe/repositorio/handle/20.500.12404/18111. Accessed 28 Sep 2022
17. De I, Sistema De Evaluación UN, De C, et al (2021) Implementación de un sistema de evaluación y capacitación de limpieza y desinfección de equipos biomédicos en los servicios de UCI y II del hospital universitario San José de Popayan. https://doi.org/10.1/JQUERY.MIN.JS
18. De Medicina F, Odontoloxía E (2016) Desinfección con ozono de los conductos radiculares tratados endodóncicamente
19. Orellana M, Gonzalez J, Menchaca E, et al (2010) EL OZONO COMO UNA ALTERNATIVA PARA ESTERILIZAR PIEZAS DE MANO Y FRESAS EN ODONTOLOGÍA. Rev. Latinoam. Ortod. y Odontopediatría
20. Taran V, Garkusha I, Gnidenko Y, et al (2020) Portable ozone sterilization device with mechanical and ultrasonic cleaning units for dentistry. Rev Sci Instrum 91:084105. https://doi.org/10.1063/1.5145279
21. Martínez C (2020) La desinfección con ozono es un sistema eficaz, seguro y sostenible. In: Geriatricarea. https://www.geriatricarea.com/2020/10/09/la-desinfeccion-con-ozono-es-un-sistema-eficaz-seguro-sostenible-y-economico/. Accessed 28 Sep 2022
22. Westover C, Rahmatulloev S, Danko D, et al (2018) Ozone Treatment for Elimination of Bacteria in Medical Environments. bioRxiv. https://doi.org/10.1101/420737
23. Vásquez J, Pérez R (2018) Manual de Espirometría, Tercera. Asociación Latinoamericana del Tórax, México
24. Salas T, Rubies C, Gallego C, et al (2011) Requerimientos técnicos de los espirómetros en la estrategia para garantizar el acceso a una espirometría de calidad. Arch Bronconeumol 47:466–469. https://doi.org/10.1016/J.ARBRES.2011.06.005
