1. Effect of Grain Size on the Mechanical Properties of B4C and β-SiC
Apart from the effects of grain size itself, the mechanical properties of B
4C and SiC also show high dependency on their properties such as composition variation [
43], anisotropy [
44,
45,
46], density [
47,
48,
49], etc. The composition of carbon in B
4C varies from 9 to 20%, forming B
10C to B
4C, among which B
4C has superior mechanical properties [
43]. Moreover, B
4C in its single crystal form is known to be highly anisotropic [
44,
45]. Both hardness and elastic modulus of
(101¯1) crystal orientation showed higher values than that of (0001) crystal orientation. Similarly, β-SiC single crystals showed up to 44% of the anisotropic variation in Young’s modulus for (100), (110), and (111) crystal orientations [
46]. Furthermore, theoretical densities of B
4C and SiC affect their mechanical properties such as hardness [
48,
50], fracture toughness [
48,
50], elastic [
47] and shear modulus [
49], etc. Hence, although the densification of B
4C and β-SiC is difficult due to grain growth during the sintering process [
51,
52] and its innate low self-diffusivity [
53], obtaining dense (above 90% of theoretical density) B
4C and β-SiC is important to measure their mechanical properties accurately. Therefore, to analyze the mechanical properties in and near the Hall–Petch and inverse Hall–Petch relationship, existing experimental results on the hardness and fracture toughness of B
4C [
8,
50,
54,
55,
56,
57,
58,
59,
60,
61,
62,
63,
64,
65,
66] and β-SiC [
13,
48,
52,
67,
68,
69,
70,
71] with a theoretical density over 90% were collected to plot grain size dependence curve in
Figure 1a–d. To analyze their pure intrinsic mechanical properties, results of fabricated B
4C and β-SiC without use of any sintering additives were used to plot
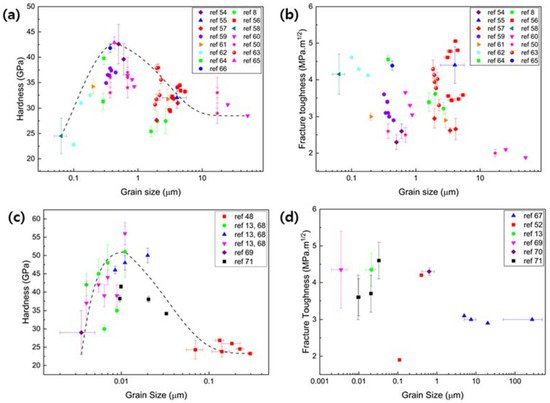
Figure 1.
Figure 1. Grain size dependence curve of, (
a) hardness of B
4C, (
b) fracture toughness of B
4C [
8,
50,
54,
55,
56,
57,
58,
59,
60,
61,
62,
63,
64,
65,
66], (
c) hardness of β-SiC, and (
d) fracture toughness of β-SiC [
13,
48,
52,
67,
68,
69,
70,
71].
The conventional Hall–Petch region is observed after the plateau region (a region where grain size does not affect the hardness), starting from 9 μm to 0.43 μm of average grain size, with an increase in hardness up to 43 GPa in
Figure 1a. Similarly, hardness increases from 31 GPa to 40 GPa were observed through the elimination of porosity in B
4C by minimum solid area models, which resulted in a close fit to the Hall–Petch relationship [
47]. Further decreases in the grain size result in a decrease in hardness, showing an inverse Hall–Petch relationship, whereas fracture toughness remained independent, varying between 2 and 5 MPa.m
1/2, as shown in
Figure 1a,b. Similarly, independence of fracture toughness at around 2 MPa.m
1/2 with grain sizes of 17 μm to 120 nm was observed due to lack of toughening, which is attributed to the transgranular fracture mode [
50]. On the other hand, when the density of B
4C was above 99%, the fracture toughness was inversely proportional to grain size, indicating a greater tendency of small grains to deflect the crack path through grain boundaries (GBs), thus increasing toughness [
60].
Similar to what was observed in B
4C, a decrease in grain size of β-SiC to 11 nm of grain size increased hardness (conventional Hall–Petch region) up to 56 GPa, while fracture toughness varied from 3 to 4.5 MPa.m
1/2, as shown in
Figure 1c–d. However, below a grain size of 11 nm in
Figure 1c, an inverse Hall–Petch region is observed, showing a decrease in hardness with a decrease in grain size. Similarly, the inverse Hall–Petch region was observed in molecular dynamics (MD) simulation, showing an increase in hardness with an increase in grain size by an increase in the fraction of Si-C bonds in nanocrystalline β-SiC [
68]. Additionally, increased dislocation activities were observed in a single- and microcrystalline SiC than in nanocrystalline SiC, where GBs act as absorbers and emitters of dislocations.
Higher critical grain size is observed for B
4C (430 nm) than β-SiC (11 nm) due to the poor densification led by porosity and grain growth during the sintering process. β-SiC, on the other hand, can be synthesized under high pressure and high temperature (HPHT) conditions, suppressing the grain growth and atomic diffusion resulting in a high hardness of ~41.5 GPa with a fracture toughness of 4.6 MPa.m
1/2 [
71]. Several studies to synthesize B
4C under HPHT conditions [
72,
73,
74] have been carried out, although no experimental analysis exists on mechanical properties or its deformation. Thus, these factors make the narrow range of its superhard state (0.37–0.5 μm in
Figure 1a) and the critical grain size of B
4C that was observed to be much higher than the grain sizes categorized for nanocrystalline materials. In the following section, mechanical properties in the crossover region from microcrystalline to nanocrystalline, and mechanical properties of nanocrystalline B
4C (n-B
4C) and nanocrystalline SiC (n-SiC) will be discussed.
2.1. Mechanical Properties in the Crossover Region and Inverse Hall–Petch Region of Nanocrystalline B4C
In the Hall–Petch region of B
4C in
Figure 1a, the underlying mechanism is predominantly transgranular fracture mode (nanocrystalline-grained microstructure) [
54,
60,
75]. However, as the grain size approaches the crossover region, intergranular fracture modes (GB-associated microstructures) were also observed [
50]. This depicts the possible transition from transgranular fracture mode in the conventional Hall–Petch region to intergranular fracture mode in the inverse Hall–Petch region. To determine mechanical properties in the inverse Hall–Petch region, a resultant shear stress–shear strain curve under finite shear deformation on three varying grain-sized systems of n-B
4C, GB1-4.84 nm (135,050 atoms), GB2-9.74 nm, and GB3-14.64 nm (3,702,861 atoms), using reactive molecular dynamics (RMD) simulation, were plotted [
76,
77]. The maximum shear stress obtained was 28.45 GPa for GB1 at 0.5 shear strain, 29.07 GPa for GB2 at 0.33 shear strain, and 29.25 GPa for GB3 at 0.37 shear strain.
Elastic deformation up to the shear strain of 0.2 initially occurred with a constant density. Then, an immediate decrease in shear stress until a 0.225 shear strain followed, before increasing to a strain of 0.275, indicating the annihilation of some pre-distorted icosahedral clusters. A maximum shear stress of 32.23 GPa was obtained at 0.275 shear strain from the region around the triple junction point (TJP), which was higher than that of the complete system. Amorphization caused by stress localization led to the decrease in the density from 0.275 to 0.375 shear strain by relieving shear stress until 11.96 GPa. Then, after the initiation of cavity formation within the amorphous region at 0.4 shear strain, the density decreased dramatically to 0.12 g/m3 until a shear strain of 0.475. Through studies on the local deformation at TJPs along with the stress–strain relationship, it was found that an increase in grain size to ~15 nm increased the shear strength with distinguished GB sliding.
These intergranular fracture modes typically observed in the inverse Hall–Petch region were verified in n-B
4C through experimental observations [
58,
76]. The obtained strength was over 4.5 GPa and reached as high as ~7 GPa using a uniaxial micro-compression test. The plot of fracture strength as a function of sample diameter had no significant effect on the pillar strength indicating an intrinsic property of n-B
4C, which is not an effect of sample size. The variations in n-B
4C strength were mainly attributed to the inhomogeneous distribution of nanopores and weak interface phases. Moreover, regardless of diameters, the stress above ~6.5 GPa resulted in a plastic strain of ~0.05–0.08%, which was not detected before failure in either single crystals or microcrystalline B
4C (m-B
4C). In the scanning electron microscope (SEM) image of uniaxial deformed n-B
4C micropillars, the failure proceeded to occur in intergranular mode.
2.2. Mechanical Properties in the Crossover Region and Inverse Hall–Petch Region of Nanocrystalline SiC
MD simulation is a powerful computational method to construct nanomaterials ranging a few digits, which are hard to obtain from experimental methods, and to track the occurrence of atomistic mechanisms. Among various empirical potentials developed for classical MD simulations of β-SiC [
78,
79,
80,
81,
82,
83], the potential created by Vashishta [
79] and the analytic bond-order potential (ABOP) [
78] are the most widely used. These two potentials have shown close agreements with the experimental mechanical properties of β-SiC [
84], among which Vashishta potential has shown a smaller deviation from the experimental results compared to ABOP, apart from the shear elastic constant of C
44 [
85]. Moreover, Vashishta potential was able to successfully distinguish between different polymorphs using both MD simulations and density functional theory (DFT) calculations. It is critical to measure these differences in order to accurately describe the microscopic deformation occurring in the system. Thus, MD simulations on n-SiC using Vashishta interatomic potential and LAMMPS package were conducted to measure the mechanical properties in the crossover region [
77,
79,
86]. After the verification of the potential by the reproduction of elastic constants, cohesive energy, melting temperature, and generalized stacking fault energies, various n-SiC systems of grain size ranging from 3.7 nm (325,686 atoms) to 18.6 nm (40,722,382 atoms) with 125 randomly oriented grains were created using the Poisson–Voronoi tessellation method [
79,
87].
To obtain the shear response of the created n-SiC system, 25 nm length models of cubic n-SiC (1,474,560 atoms) were created with crystal directions of [11
2¯], [111], [
1¯10]; [100], [010], [001]; and [110], [
1¯10], [001] along the x, y, and z directions of the simulation box, respectively, and MD simulations were performed with well-distributed shear strain loading at a constant rate of 10
9 s
−1 along xy, xz, and yz planes. Shear stress–strain response and shear strength–yield shear strain (peak stress on the shear stress–strain curve before the drop is defined as shear strength and the resultant shear strain is defined as yield shear strain) response of various grain sizes (3.7, 4.9, 6.2, 7.7, 9.3, 12.4, and 18.6 nm) showed highest shear strength of ~6.5 GPa for grain sizes of 6.2 nm and 7.7 nm. A decrease in grain size increased the shear yield strain ranging from ~0.07 to 0.12 due to the increasing volume of amorphous phases within GBs. From two distinctive phases of transgranular crystalline phase and intergranular amorphous phases, consistency with the superplastic tensile behavior of n-SiC [
88] was observed by having higher failure strains due to homogenous deformation triggered by controlled plasticity from soft amorphous phases within GBs.
Through the calculation of the shear localization parameter at the yield shear strain point, two distinct regions were observed, i.e., the high shear localization region (region I) above a grain size of 9.3 nm, where a relatively low strength is observed due to the susceptibility to intergranular nanocracking, fracture, and cavitation, and low shear localization region (region II) below a grain size of 9.3 nm, where shear localization was nearly constant. Assuming that shear deformation is more heterogeneous in the high shear localization region, owing to the increase in volume fraction of crystalline phase with increasing grain size, elastic deformation is initially caused by shear loading energy during shear deformation. The Hall–Petch region has a larger grain size, leading to a higher crystalline volume fraction, which can ultimately lead to elastically strained regions in GBs along with lower stress relaxation and restriction of shear plastic flow due to high constraint. Therefore, deformation after critical shear strain energy leads to intergranular fracture subsequent to cavitation, shear localization, bond breaking, nanocrack formation, and GB sliding due to the cohesion strength of GBs [
76]. On the other hand, a decrease in grain size leads to an increase in density of GBs, leading to lower delocalized shear stress applied in the structure that results in homogenous shear deformation, resulting in increased shear strength, along with minimized stress concentration at GBs, and delocalized shear flow. Thus, this also indicates that the shear response in the inverse Hall–Petch region is weaker and softer due to the increased volume fraction of the disordered phase in GBs. Moreover, the shear strains were localized mainly along GBs, indicating that failure and deformation in n-SiC in all the regions (Hall–Petch and inverse Hall–Petch region) were mainly GB-mediated.
Through von Mises local atomic shear strain analysis, deformation type (heterogeneous or homogenous) and shear localization were further validated for a grain size of 3.7 nm, representative of finer grain, and grain size of 12.4 nm, representative of coarse grains [
89]. For the grain size of 12.4 nm, high stress was concentrated at GBs and TJPs, leading to the relatively low strength by premature failure, and for the grain size of 3.7 nm, shear stress was homogeneously distributed throughout the sample and minimally intensified at GBs leading to the higher critical shear strain by delayed failure and homogenous deformation. Thus, in correspondence with the shear localization analysis at GBs and grains, the failure and deformation of n-SiC were led by GB-mediated mechanisms due to shear strain energy release. In fact, in another study [
90], MD simulation verified the experimental results and demonstrated that the formation of amorphous bands in β-SiC is due to the coalescence of the pile-up of small stacking faults and the growth of new stacking faults from old ones when the longitudinal shock was induced. Therefore, these results suggest that the formation of amorphous bands is prone to failure, as they can create new interfaces, providing sites for crack nucleation and growth.
Further analysis of the crossover region was conducted through the development of an appropriate composite model (CM) of n-SiC by varying grain shapes (cubic, spherical and tetrakaidekahedral) with varying GB thicknesses of 0.5–1 nm to describe shear strength using Hill’s like model [
91]. Grain shapes of cubic and spherical showed closest fitting to the crystalline volume fraction curve with GB thickness of 0.75 nm. Upon the variation of GB thickness in the model of combined cubic and spherically shaped grains, a critical grain size of ~6.3 nm at maximum shear strength of around 5.8 GPa was obtained using theoretical CM calculations. This correctly matched the critical grain size of 6.2–7.7 nm in MD results where the transition occurred. Moreover, in contrast to the observed independence of GB thickness from the grain size in MD, an increase in GB thickness with an increase in grain size, and the diminished importance of GB thickness on the shear strength in the Hall–Petch region (typically above grain size of 100 nm, GB thickness has no impact on shear strength), were identified through the CM calculations.
This entry is adapted from the peer-reviewed paper 10.3390/nano12183228