Eight types of heavy metals in the soil on the banks of Shuimo River in Urumqi were analysed via X-ray fluorescence spectrometry and national standard detection methods. The UNMIX and positive matrix factorisation (PMF) models were comprehensively used to analyse the sources and contribution rates of potential pollutants. The soil samples were collected from three layers: 0–20, 20–40, and 40–60 cm. Each sample point in each layer was located 5 m, 1 km, and 2 km from the riverbank. The results showed that only the average concentration of Mn in each layer of soil was lower than the background value, and the average concentrations of other heavy metals were higher than their background values. Among them, Ni concentration highly exceeded the background value in the 40–60 cm soil layer, reaching 1.92 times. The similarities and differences between the sources and contributions estimated by the UNMIX and PMF models were also clarified. The similarities of the two common sources (natural source and artificial source) for each soil layer were relatively large, and the analysis results of the two models were within model reliability range. By comparing the Pearson correlation coefficients and distribution maps of heavy metal concentrations in surface soil, Zn, Pb, Cr, and Cu were from human sources, and Mn, Ni, and V were from natural sources. In future studies, multiple models should be comprehensively used to determine the potential pollutant sources and estimate contribution rates.
- PMF
- UNMIX
- source analysis of heavy metals
- soil along the river
1. Introduction
Soil heavy metal pollution is presently an important issue in the field of environmental science, and heavy metal pollution in urban soil has received increasing research attention [1-3]. With industrial development, human activities have become intense, leading to high contents and diversity of heavy metals in urban soils. Being toxic and harmful pollutants that are difficult to degrade, heavy metals not only cause soil quality degradation and reduce crop yield and quality but also affect human health through food chain accumulation, dust inhalation, skin contact, and other ways and induce fatal diseases, such as cancer [4]. Moreover, treating soil pollution is more difficult and time-consuming than treating air and water pollution [5]. After entering the soil, heavy metals exhibit characteristics such as concealment, hysteresis, accumulation, and irreversibility [6], thereby directly or indirectly endangering human life and health through the food chain [7-9].
Soil is important for agricultural production and human survival [10]. Heavy metal pollution in China is not improving, and strict actions must be undertaken to control heavy metal pollution and reduce its accumulation risk [11, 12]. Pollution source allocation is a key step in addressing pollution threats. Existing heavy metal source analysis methods can be divided into two major categories: qualitative pollution source identification and quantitative pollution source analysis [13]. The former primarily determines the pollution source via geostatistical and multivariate statistical analyses. It can identify possible pollution sources of heavy metals and their major pollution points [14-17]. At present, the main models used to calculate the contribution of pollution sources to pollutants are multivariate linear regression after absolute principal component analysis (apcs-mlr), chemical mass balance (CMB) model, positive matrix factorisation (PMF), and UNMIX [18-21]. Among them, the PMF and UNMIX models approved by the U.S. Environmental Protection Agency can not only provide the number of pollution sources and the elements contributed by each pollution source but also provide the contribution rate of each pollution source to the elements [22-24]. Although they have been widely used in the source analysis of air, water, and sediment pollutants [25-28], they are rarely used in analysing soil heavy metal pollution sources [29]. Previous studies have conducted source analysis of heavy metal pollution in the soil along the Shuimo River. Using an analysis method that combines UNMIX and PMF is recommended for source analysis. Thus, by combining two models, we can overcome the shortcomings and potential errors of both models and obtain more reliable results.
2. Geography of the Shuimo River
Urumqi is the capital of the Xinjiang Uyghur Autonomous Region. It is located on the northern slope of the Tianshan Mountains and is surrounded by desert. It is located between 42°45′32.4″–44°08′00″ N and 86°37'33.3″–88°58'24.4″ E. Urumqi is located in the centre of the Eurasian Continent, Northwest China, and central Xinjiang. It is the political, economic, cultural, and transportation centre of Xinjiang. It is the world’s largest city that is the farthest from the sea. It is the bridgehead of the Second Eurasian Continental Bridge in western China and an important gateway for China to open to the west. Urumqi is approximately 153 km long from north to south and 190 km wide from east to west, with a total area of 12,000 km2.
The Shuimo River originates in Abuja hasmudara in southwest Fukang City, Changji Hui Autonomous Prefecture. The river is primarily located in the eastern suburb of Urumqi City, passing through Shuimogou, Tianshan, and Midong districts of Urumqi and ultimately flowing into the Bayi Reservoir. It is a rock fissure spring river primarily supplied by groundwater. The Shuimo River Basin is a densely populated area with high industrial development and extensively developed agricultural and animal husbandry areas in the suburb. It is an important scenic area in Urumqi. The drainage basin ranges from E87°59′–E88°09′ and N43°45′–N44°15′, with a drainage area of 281.4 km2, water source protection area of 45.7 km2, and total length of 50 km. Urumqi is 18 km in length. It is an important part of the surface water body of Urumqi. The south-eastern, central, and northern parts of the basin are characterised by medium and low mountains, low mountains and hills, and plain, respectively, with an altitude range of 600–1800 m. The land has a temperate, arid, and inland climate. From the plain to the medium and low mountain areas, the terrain gradually rises from north to south, and the precipitation gradually increases. The annual average precipitation ranges from 200–400 mm. The annual evaporation is 2276.9 mm, annual average temperature is 4.2 ℃, extreme minimum temperature is -42.2 ℃, extreme maximum temperature is 43.5 ℃, and the annual sunshine duration is 2808.6 h [30]. The surface water resource of the Shuimo River is 21.6089 million m3/year, and the groundwater resource is 34.4759 million m3/year. The annual runoff is relatively stable, without an evident dry season. The average annual runoff is 39.67 million m3/year (Weihuliang observation station) [31].
3. Sample collection and analysis
In total, 42 soil sample points were placed along the Shuimo River bank using the grid method (2 2 km). In addition, parallel sample points were set at 1 and 2 km along the vertical direction of the river bank of each soil sample point, and 80 parallel soil sample points were thus collected. For each sample point, three layers of soil samples at depths of 0–20, 20–40, and 40–60 cm were collected vertically from the ground surface at every 20 cm depth[32, 33]. Because of the soil texture and hard soil layers, only the surface layer or two layers of soil samples were collected at some sampling points, and approximately 1 kg of soil samples were collected for each layer of soil. In total, 122 soil samples were collected from the Shuimo River bank, with 334 soil samples. Fig. 1 shows the distribution of the sampling points.
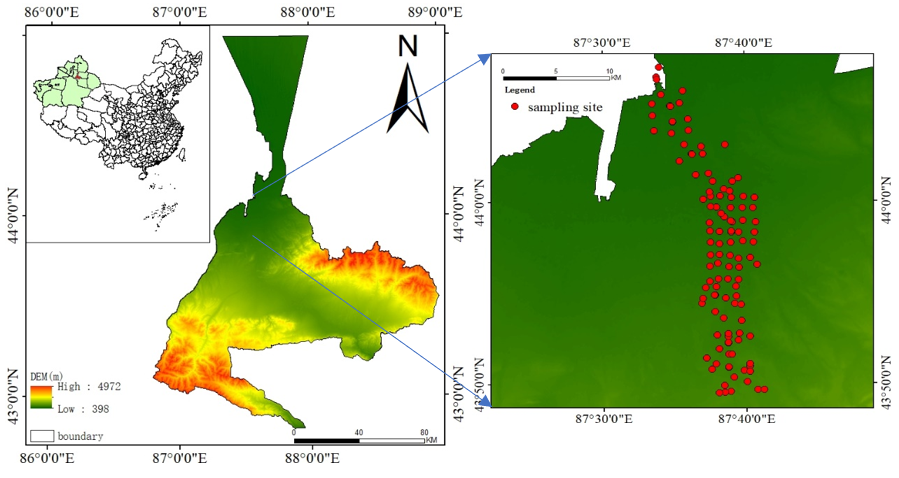
Figure 1 Distribution of sampling points
Gravel and plant residues were removed from the soil samples, dried in natural shade indoors, grounded, and passed through 10-mesh and 100-mesh nylon screens to determine soil pH and heavy metal content, respectively. A portable X-ray fluorescence spectrum analyser (Thermo Scientific Nixon XL3t GOLDD analyser, USA) was used to rapidly identify all samples to be tested. The test was set to the soil mode of 90 s, repeated thrice, and the average value was obtained. Simultaneously, 30% of the samples was tested via the national standard method to calibrate the data measured by the X-ray fluorescence spectrum analyser and ensure its accuracy. The national standard method test was divided into two stages: pretreatment and determination. First, an acid solution method was used for the pretreatment. We accurately weighted 0.5000 g of soil sample into a polytetrafluoroethylene crucible, wetted it with 2–3 drops of high-purity water, and filled it in the order of HF → HNO3 → HClO4 in strict accordance with the dosage. We removed the boiled sample for cooling when it emitted slight white smoke. Subsequently, we added HF → HClO4 to digest to paste, and the paste residue was dissolved in HNO3 at low temperature and washed into the colorimetric tube [34]. After pretreatment, the arsenic content (as) was determined via microwave digestion/atomic fluorescence spectrometry (Aurora lumina 3400 atomic fluorescence spectrometer, CA), and the contents of nine heavy metals (Co, Zn, Cu, Ni, and Cr) were determined via flame atomic absorption spectrometry (Perkin Elmer aa900 atomic absorption spectrometer, USA). Compared to the national standard method, this method has accuracy of over 95%. The above-mentioned results show that the test results of the X-ray fluorescence spectrum analyser are more accurate and convenient. Therefore, all data measured by this instrument were used for statistical analysis in this study to reduce the error.
4. Introduction to models
4.1. PMF model
Paatero and Tapper proposed the concept of the PMF model in 1994. It is a source analysis method based on factor analysis and has been updated to the PMF version 5.0. When a dataset with n samples and m chemical species is imported into the PMF model, it is considered that the dimension of Matrix X is n × m [35]. This model decomposes the original matrix Xij into two factor matrices, gik and fik, and residual matrix eij. The formula used is as follows:
where Xij is the concentration of the j-th heavy metal in sample i, gik is the contribution rate of the k-th pollution source in sample i, and fik is the characteristic value of the concentration of k-th heavy metal of pollution source i. The residual matrix eij was calculated from the minimum value of the objective function Q.

where uij is the uncertainty of the j-th heavy metal in the sample i. The MDL calculation method followed that described by Chen et al. [36].
4.2. UNMIX model
In 2003, Henry proposed a calculation method of UNMIX model and launched the UNMIX model software on the official website of the EPA of the United States. Since then, he has consistently refined the UNMIX model, which was updated to UNMIX version 6.0. The UNMIX model provides a visible graphical interface, and graphical diagnostic tools can be included in the results. Setting the number of pollution sources and determining the uncertainty of the data are not necessary while applying this model. The model obtains the results according to the selected components and expresses the uncertainty information in the analysis results, which partly reduces the impact of anthropogenic factors [37]. The UNMIX model has a strict data screening process based on eigenvalue analysis, thereby eliminating missing data or data lower than the minimum detection limit. As this model uses the geometric concept of self-modelling curve resolution, the model results must be non-negative. Using the singular value decomposition (SVD) method, the model estimates the number of sources by reducing the dimension of the data space m to p [29, 38]. The calculation formula is as follows:

where Cij is the content of the j-th element in the i-th regional sample (soil); Fjk is the element content of the j-th sample in source k (k = 1,... M), representing the composition of the source; Sjk represents the total amount of source K in the i-th sample, that is, the contribution rate of the source; and E is the uncertainty of the analysis process or the standard deviation of each source component. In this study, to eliminate the influence of the huge difference between different trace heavy metals in the soil on the analysis results, before inputting the data into the UNMIX model, the deviation normalisation method was used to process whole data. The calculation formula is as follows:

Deviation standardisation was applied to 2856 data points from 357 soil sample sites containing eight heavy metals (Pb, Zn, Cu, Ni, Mn, Cr, and V). The normalised data were dimensionless, and the value of the variable observations ranged between 0 and 1. Standardised data were replaced with UNMIX 6.0 for analysis.
5. Results and discussion
5.1. Analysis of heavy metal pollution along the Shuimo River
According to the soil layers, the collected soil samples were divided into three parts. Because some places have high walls, private houses, and steep slopes, samples of individual soil layers were not collected, and therefore, the number of samples of each soil layer was inconsistent. There were 121 samples in the 0–20 cm soil layer, 109 samples in the 20–40 cm soil layer, 104 samples in the 40–60 cm soil layer, and 23 sample in the sediment soil layer. Because the number of sediment soil layer samples was small and the statistical significance was not significant, statistical characteristics and correlation analysis were not conducted.
Based on the statistical results of heavy metal contents in the soil along the Shuimo River (Table 1), the average values of ω (As), ω (Pb), ω (Zn), ω (Cu), ω (Ni), ω (Mn), ω (Cr), and ω (V) were 12.65, 20.00, 80.84, 38.78, 49.70, 532.47, 53.18, and 111.29 mg/kg, respectively. Moreover, the average concentrations of all heavy metals except Mn were higher than the background values of the corresponding local soil heavy metals, and average concentration of Ni in each layer highly exceeded the background value, reaching 1.85, 1.87 and 1.92 times, respectively. Based on the degree of coefficient of variation [39], Zn, Pb, As, Cr, and Cu were highly variable (CV > 30%), indicating that the spatial distribution of these five heavy metals varies, and the source may be significantly affected by external interference. Ni, Mn, and V were moderately variable (10% < CV < 30%), indicating that these three heavy metals are relatively evenly distributed. The concentrations of all heavy metals in this study were lower than the screening value of the GB 36600-2018 soil environmental quality control standard for soil pollution risk of construction land (Trial) (Zn, Mn, and V have no screening value, and Cr screening value is hexavalent), indicating that the soil environmental quality along the Shuimo River is generally good. However, compared with the background value, the eight heavy metals were enriched and may pose a pollution risk, and thus, further pollution source analysis is warranted.
Table 1. Statistical analysis results of heavy metals in soils along the Shuimo River
|
Soil depth (cm) |
Heavy metals |
ω (mg/kg) |
Variant line number (%) |
||||||
|
Maximum value |
Minimum value |
Mean value |
Median value |
Standard deviation |
Background value |
Filtered value |
|||
|
0–20 |
As |
43.49 |
6.72 |
12.69 |
11.67 |
5.13 |
11.2 |
60 |
40.46 |
|
Pb |
66.49 |
10.32 |
20.60 |
18.59 |
8.21 |
19.4 |
800 |
39.87 |
|
|
Zn |
230.14 |
46.79 |
79.07 |
69.38 |
29.89 |
68.8 |
/ |
37.80 |
|
|
Cu |
144.41 |
18.09 |
39.01 |
37.69 |
12.85 |
26.7 |
18000 |
32.95 |
|
|
Ni |
86.74 |
29.57 |
49.29 |
47.55 |
13.07 |
26.6 |
900 |
26.53 |
|
|
Mn |
769.47 |
377.08 |
529.00 |
525.68 |
66.05 |
688 |
/ |
12.49 |
|
|
Cr |
187.68 |
20.75 |
52.40 |
50.68 |
18.83 |
49.3 |
/ |
35.93 |
|
|
V |
175.77 |
70.24 |
112.31 |
112.66 |
15.24 |
74.9 |
/ |
13.57 |
|
|
20–40 |
As |
41.61 |
6.06 |
12.65 |
11.80 |
4.92 |
11.2 |
60 |
38.92 |
|
Pb |
48.47 |
9.07 |
19.53 |
17.31 |
7.42 |
19.4 |
800 |
37.98 |
|
|
Zn |
264.57 |
43.65 |
78.94 |
66.62 |
38.23 |
68.8 |
/ |
48.43 |
|
|
Cu |
103.88 |
20.92 |
37.40 |
35.40 |
11.72 |
26.7 |
18000 |
31.33 |
|
|
Ni |
92.49 |
30.61 |
49.74 |
46.77 |
12.91 |
26.6 |
900 |
25.95 |
|
|
Mn |
1413.36 |
334.71 |
545.36 |
531.02 |
117.17 |
688 |
/ |
21.49 |
|
|
Cr |
252.82 |
20.43 |
56.02 |
52.86 |
27.02 |
49.3 |
/ |
48.23 |
|
|
V |
182.32 |
58.57 |
112.63 |
114.03 |
15.95 |
74.9 |
/ |
14.16 |
|
|
40–60 |
As |
45.64 |
5.58 |
12.89 |
11.71 |
5.61 |
11.2 |
60 |
43.57 |
|
Pb |
70.43 |
9.46 |
20.10 |
17.71 |
9.97 |
19.4 |
800 |
49.63 |
|
|
Zn |
323.71 |
22.64 |
76.98 |
66.53 |
36.04 |
68.8 |
/ |
46.82 |
|
|
Cu |
101.43 |
19.10 |
39.34 |
36.83 |
13.63 |
26.7 |
18000 |
34.65 |
|
|
Ni |
83.81 |
30.44 |
50.97 |
49.67 |
12.38 |
26.6 |
900 |
24.29 |
|
|
Mn |
1307.35 |
261.17 |
543.00 |
532.55 |
116.88 |
688 |
/ |
21.53 |
|
|
Cr |
128.46 |
17.50 |
50.90 |
49.86 |
16.14 |
49.3 |
/ |
31.70 |
|
|
V |
181.42 |
44.38 |
111.74 |
112.35 |
18.50 |
74.9 |
/ |
16.55 |
|
Note: The background values of soil heavy metals were selected from the soil heavy metal concentration of layer a in the Xinjiang Uygur autonomous region divided by administrative provinces and cities (because the soil of layer B in arid areas is not fully developed, only layers a and C were selected in the sampling process. Layer a is the surface layer of soil, and layer C is the parent material of soil formation; therefore, layer a was selected).
5.2. Correlation analysis of heavy metal contents
The correlation between heavy metal contents can provide information about heavy metal sources. Table 2 presents the Pearson correlation coefficient analysis results for the heavy metal content in soils along the Shuimo River. As presented in Table 2, Zn and Pb were significantly positively correlated in all soil layers (P < 0.01), and Cu was significantly positively correlated with these two metals in all soil layers (P < 0.05), indicating that these three elements may have similar sources. As and Cu and As and V also had a certain correlation in each soil layer (P < 0.05); however, no significant correlation was observed between Cu and V, and there was no correlation between Ni and other heavy metals. The Pearson's correlation coefficient can only be used as a reference for heavy metal source analyses, and thus, it cannot be used for reaching conclusions. Further verification and analysis are required to accurately determine the source of heavy metals.
Table 2. Pearson correlation coefficient of soil heavy metal contents at different sampling depths along the Shuimo River
|
Sampling depth (cm) |
Heavy metal |
As |
Pb |
Zn |
Cu |
Ni |
Mn |
Cr |
|
0–20 |
As |
1.00 |
|
|
|
|
|
|
|
Pb |
0.14 |
1.00 |
|
|
|
|
|
|
|
Zn |
0.14 |
0.69** |
1.00 |
|
|
|
|
|
|
Cu |
0.30* |
0.30* |
0.67** |
1.00 |
|
|
|
|
|
Ni |
0.04 |
-0.08 |
-0.05 |
0.05 |
1.00 |
|
|
|
|
Mn |
0.28 |
0.07 |
0.14 |
0.23 |
0.22 |
1.00 |
|
|
|
Cr |
0.11 |
0.39* |
0.48* |
0.22 |
-0.17 |
0.19 |
1.00 |
|
|
V |
0.45* |
0.17 |
0.03 |
0.17 |
0.12 |
0.35* |
0.23 |
|
|
20–40 |
As |
1.00 |
|
|
|
|
|
|
|
Pb |
0.12 |
1.00 |
|
|
|
|
|
|
|
Zn |
0.12 |
0.86** |
1.00 |
|
|
|
|
|
|
Cu |
0.32* |
0.70** |
0.74** |
1.00 |
|
|
|
|
|
Ni |
0.13 |
0.10 |
0.15 |
0.28 |
1.00 |
|
|
|
|
Mn |
0.34* |
0.18 |
0.23 |
0.33* |
0.03 |
1.00 |
|
|
|
Cr |
0.11 |
0.45* |
0.47* |
0.42* |
0.20 |
0.09 |
1.00 |
|
|
V |
0.34* |
0.21 |
0.14 |
0.27 |
0.14 |
0.29 |
0.31* |
|
|
40–60 |
As |
1.00 |
|
|
|
|
|
|
|
Pb |
0.22 |
1.00 |
|
|
|
|
|
|
|
Zn |
0.12 |
0.75** |
1.00 |
|
|
|
|
|
|
Cu |
0.44* |
0.59* |
0.64** |
1.00 |
|
|
|
|
|
Ni |
0.25 |
0.21 |
-0.01 |
0.11 |
1.00 |
|
|
|
|
Mn |
0.05 |
0.07 |
0.18 |
0.14 |
0.11 |
1.00 |
|
|
|
Cr |
0.41* |
0.16 |
0.27 |
0.31* |
-0.01 |
0.05 |
1.00 |
|
|
V |
0.26 |
-0.01 |
-0.06 |
0.27 |
0.25 |
0.07 |
0.24 |
Note: * * indicates significant correlation at 0.01 level (bilateral)* Indicating a significant correlation at the 0.05 level (bilateral)
5.3. Source analysis of UNMIX and PMF models
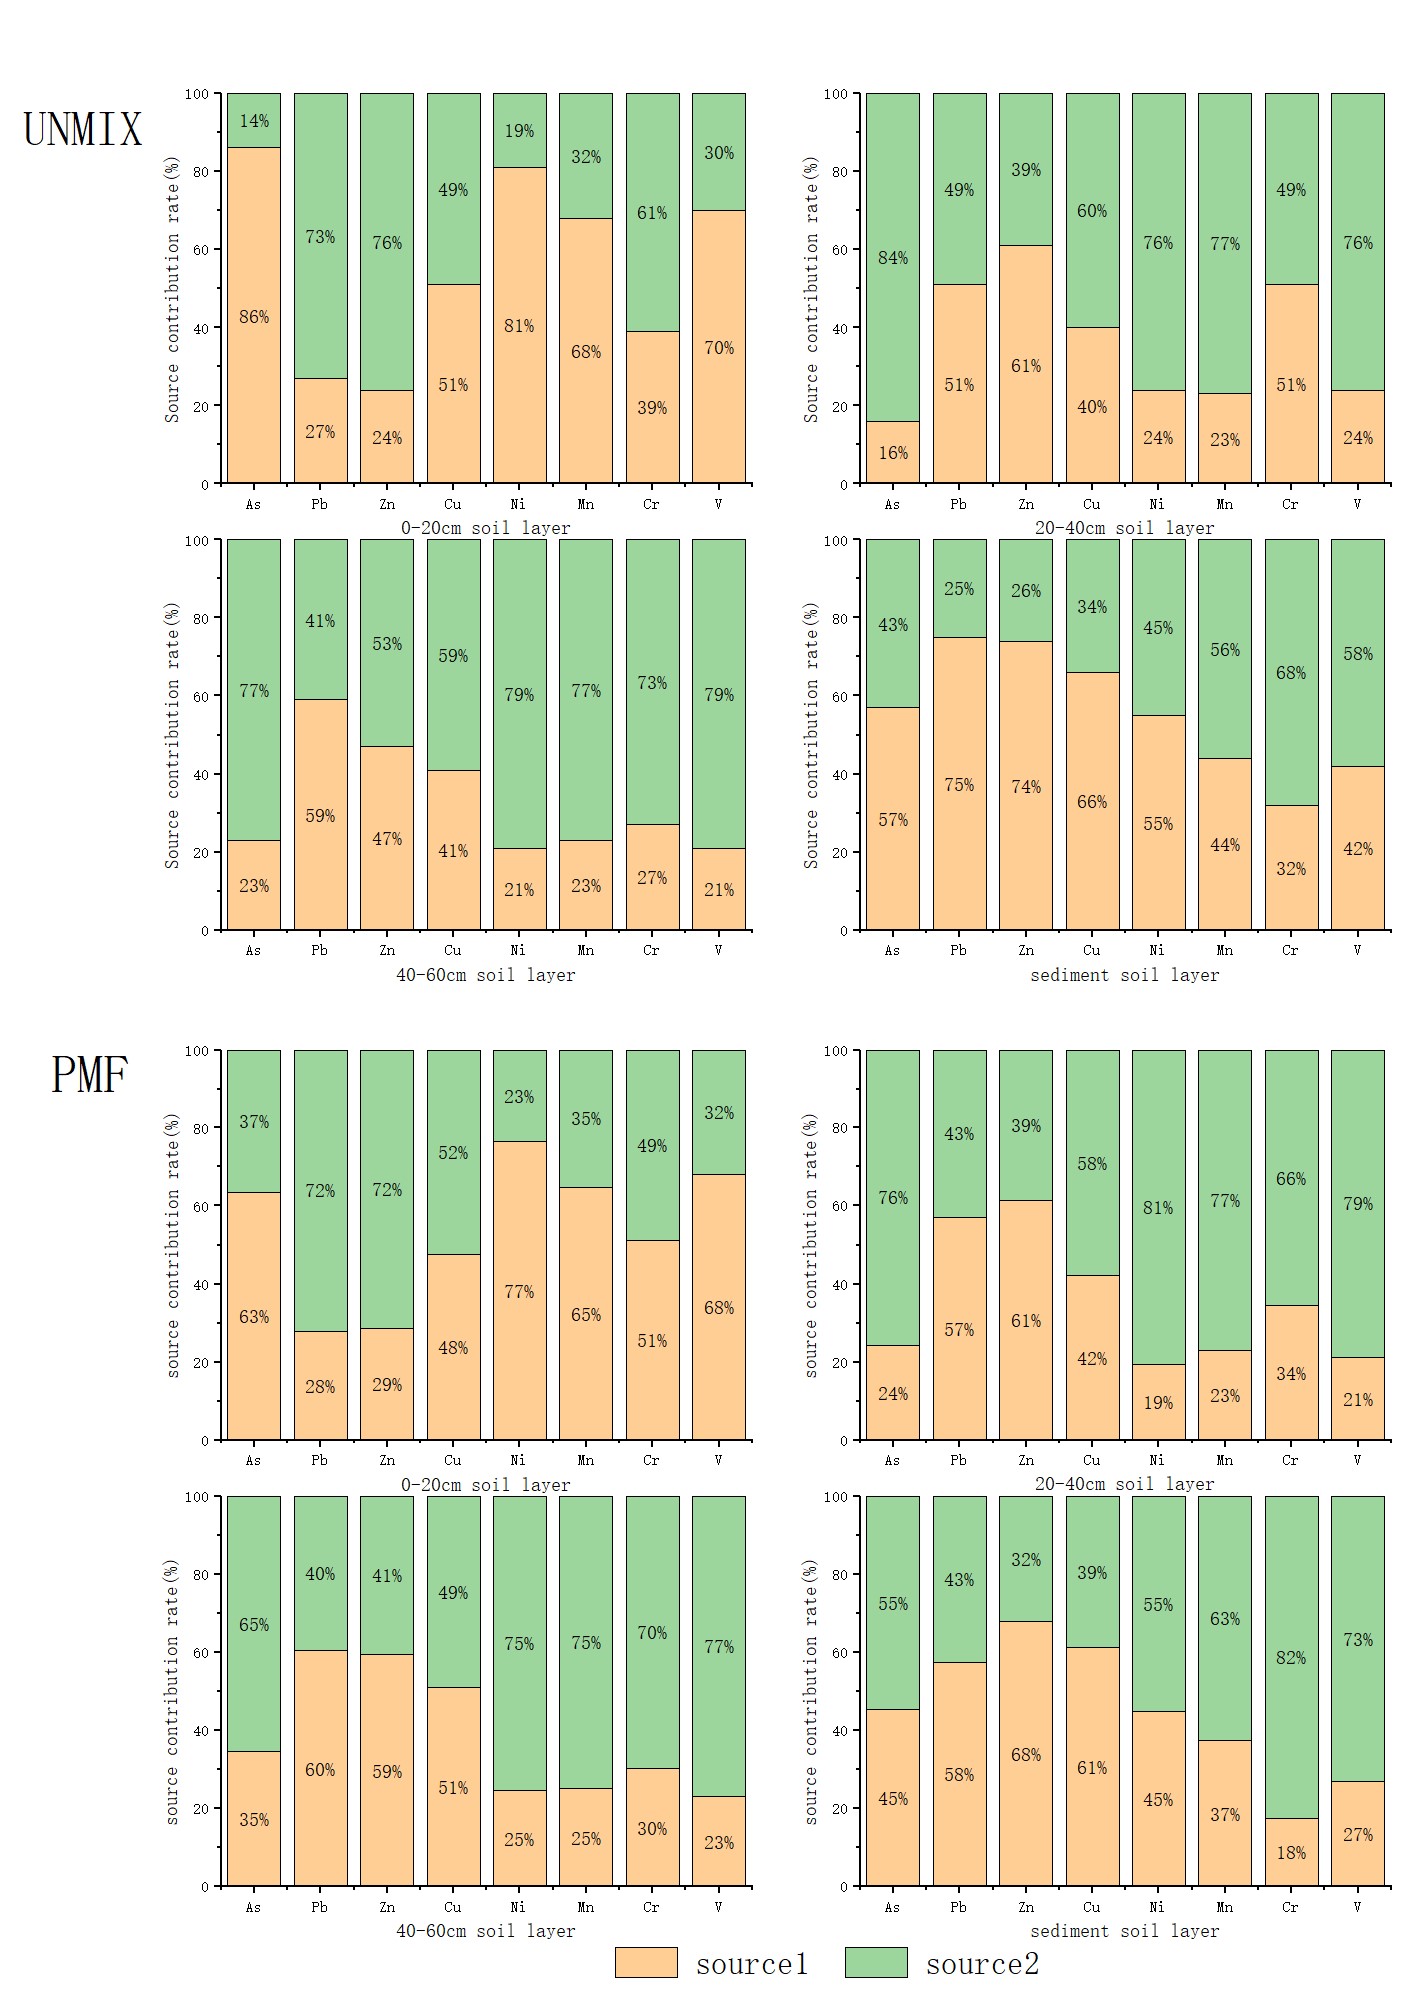
Figure 2. Contribution rates of different heavy metal sources in the study area (UNMIX and PMF)
The UNMIX and PMF models were used to analyse the samples of the four soil layers, and the results are shown in Fig. 2. As shown in the figure, both the UNMIX and PMF models determined the two sources of heavy metals in the soil. For the UNMIX model, min RSQ is the minimum R2 of any species in the model (the R2 of any species is greater than this value). Our results show that the minimum RSQ was 0.91, indicating that 91% of the species variance can be explained by the model, which is larger than the minimum value required by the model (min RSQ > 0.8); Min sig/noise = 3.05 in multiple operations, which was higher than the minimum value required by the system (min sig/noise > 2). For PMF, the minimum R2 in the three-layer soil operation was between 0.233 and 1, Q(robust) / Q (true) tended to converge, and the residual error was between -3 and 3, indicating that the model results can efficiently explain the source of soil heavy metals[40]. Therefore, the analysis results of these two models were reliable. As shown in Fig. 1, according to the UNMIX and PMF analysis results, the proportions of Zn and Pb sources in most soil layers are approximately same, indicating that these two heavy metals likely have the same source. The Pearson correlation coefficient analysis results presented in Table 2 also reveals that Pb and Zn are significantly correlated, which further supports this view. By comparing the source proportions of each soil layer, the source proportions of different soil layers were significantly different, indicating that different pollution sources have different effects on different soil layers. When the Pb and Zn sources increase (decrease), other heavy metals decrease (increase), indicating that other heavy metals may have different Pb and Zn sources. The analysis results of the two models for the three soil layers of 0–20 cm, 20–40 cm, and 40–60 cm were very similar; however, the difference in the sediment layer was relatively high. The sediment layer is considered to have very few samples, resulting in large fluctuations in the model analysis results; thus, the reliability is low. According to the analysis results of the two models, the Source 1 contributions of As, Mn, Ni, and V were primarily concentrated in the surface soil, and the analysis results of the UNMIX model were more obvious than those of the PMF model, indicating that these four heavy metals may belong to the same source and tend to be caused by later human activities.
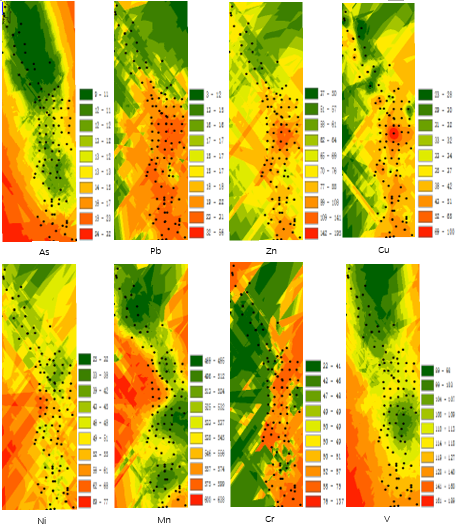
Figure 3. Distribution of heavy metal concentration in 0–20 cm soil layer
5.4. Surface distribution of heavy metal concentration via the Kriging interpolation method
Only the surface soil was sampled completely among the three soil layers, and other soil layers could not be excavated entirely because of various factors; therefore, the sampling points were incomplete. As shown in Fig. 3, we used the Kriging interpolation method to draw the distribution map of heavy metal concentration in the 0–20 cm soil layer and further analysed the heavy metal sources using this map. According to the correlation analysis, a significant correlation was observed between Zn, Pb, and Cu; moreover, the concentration distributions of As, Mn, and V had a significant correlations, as shown in Fig. 2. According to the distribution law of heavy metal concentrations, the distribution of Zn, Pb, Cr, and Cu at the southern part of the river was significantly higher than that at the northern part; however, the concentrations of As, Mn, Ni, and V were lower at the sampling point and higher around the sampling point. Based on this, we inferred that Zn, Pb, Cr, and Cu were from one of the pollution sources that were concentrated in the southern part of the river, whereas Mn, Ni, and V were from another pollution source that were evenly distributed on both sides of the river and slightly away. The southern end of Shuimo River is in the centre of Urumqi, which is a densely populated area. Therefore, it can be determined that Source 1 is a anthropogenic source, primarily including pollutants emitted by motor vehicles and human domestic garbage. However, the concentration of Source 2 was low near the river and slightly better around the river. It was determined as a natural source and primarily included the heavy metal pollution due to the soil-forming parent material. The concentration of heavy metals around the river was low, which can be attributed to the role of water flow in transferring the heavy metals.
However, there is no single source of heavy metals. According to the Pearson correlation analysis, Ni and other heavy metals are not related; however, this does not mean that it is from another pollution source. Fig. 2 shows that the concentration distribution of Ni is high in the south and low in the north, with low concentration at the sampling point and high concentration around the sampling point. This indicates that the Ni concentration is the result of the interaction between Sources 1 and 2, and there is no primary source connecting the two sources.
6. Conclusions
The PMF and UNMIX models were used to analyse the sources of heavy metals in the soil along the Shuimo River in Urumqi. The results show that the combination of the two methods improves the accuracy of the source analysis, and the analytical results of the two models were highly similar, which can be mutually verified. As, Mn, Ni, and V are were primarily derived from human activities, and the heavy metals contributed by these sources are primarily concentrated at the soil surface. However, Zn, Pb, Cr, and Cu primarily originated from the parent material of soil formation, and the heavy metals from this source are primarily concentrated in the deep soil layers. However, according to the statistical results of various soil heavy metal concentrations, no evident difference was observed in the average heavy metal concentrations in each soil layer, indicating that each heavy metal did not result from a single source but via the interaction of multiple sources. The soil environment along the Shuimo River was generally good. However, as a large city with a population of more than four million, the environment of Urumqi is likely to deteriorate further with the continuous impact of human activities. Therefore, to create a suitable living environment for residents along the river, continuously monitoring heavy metal concentrations in the soil along the Shuimo River is necessary. Moreover, further quantitative research on the sources of heavy metal pollution should be conducted to comprehensively analyse the sources of various pollutants, thereby providing feasible policy suggestions for river environmental protection and a basis for future research on controlling heavy metal pollution in the soil along the river bank.