|
Separation Technique
|
Advantages
|
Disadvantages
|
|
Size exclusion chromatography
|
-
-
-
Simple to design (isocratic gradient)
-
-
-
Arranges SV proteins into fractions of known MWs
-
-
-
No sample loss since solutes do not interact with stationary phase
-
-
-
Short analysis time
|
-
-
-
Low resolution compared to other techniques
-
-
-
Limited number of peaks can be resolved
-
-
-
Sample evidently requires further separation to reach purity
|
|
Ion-exchange chromatography
|
-
-
-
Resins have long life
-
-
-
Buffers are suitable and non-denaturing
-
-
-
High-resolution separation
|
-
-
-
Can only be used for charged molecules
-
-
-
Small changes in pH alter the binding of molecules
|
|
Affinity chromatography
|
-
-
-
High specificity
-
-
-
High resolution
-
-
-
Purification could be performed in a single step
|
-
-
-
Harsh buffers used could alter the structure and function of target proteins
-
-
-
Resin development is time-consuming and costly
|
|
RP-HPLC
|
-
-
-
Rapid, efficient, and accurate
-
-
-
Use of water-based solvents that are compatible with SV proteins
-
-
-
Most compatible with mass spectrometry
|
-
-
-
Costly organic solvents
-
-
-
Coelution of molecules with same polarity
|
|
1D gel electrophoresis
|
-
-
-
Gives an idea of the distribution of molecules in each fraction
-
-
-
Helps determine protein molecular weights
-
-
-
Requires small amount of sample
|
-
-
-
Procedure is time consuming
-
-
-
Large amounts of sample could not be separated at once
-
-
-
Suitable only for whole proteome analysis
|
|
2-D gel electrophoresis
|
-
-
-
Good for comparison of snake venoms
-
-
-
Whole proteome analysis could be performed in a single separation step
|
-
-
-
Inefficient separation
-
-
-
Poor reproducibility
-
-
-
Spot trains (hard to analyze each spot apart)
-
-
-
Low amount of proteins prevents identification my MS
|
3. Implementation of Separation Methods for SVs
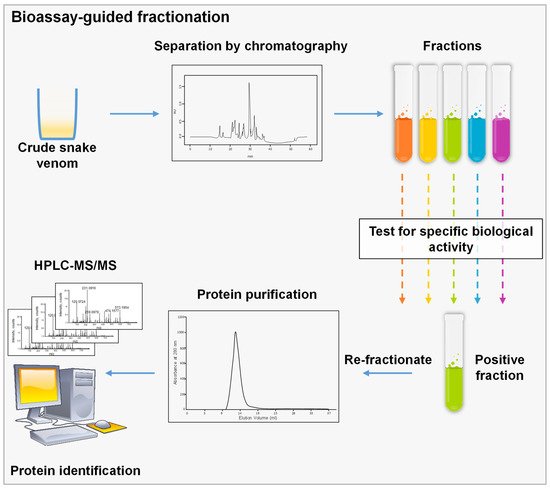
3.1. Bioassay-Guided Fractionation
It uses biological assays to perform a fractionation aiming to isolate a specific molecule. During the process, a complex mixture is separated typically by chromatographic techniques, and each fraction is tested separately for a specific biological feature. The fractions of interest are then re-fractionated until a pure protein is recovered (
Figure 1) [
58]. The choice of the assay to be used is directly related to the molecule to be isolated. For SVs, numerous bioassays are currently used for different specific components. In fact, SVs induce a wide spectrum of effects once injected in prey, since they target several organ systems: namely, the nervous and the cardiovascular systems [
59]. Different bioassays are developed for the isolation of cardiotoxic and neurotoxic components. Since SV cardiotoxic components are known to have effects on the cardiac muscle or vascular smooth muscle [
59], several bioassays might be used for the isolation of cardiotoxic components. Firstly, Langendorff model heart preparations could be used to screen for cardiotoxic molecules. For example, this model was used to screen for the cardiotoxic component of
Vipera ammodytes venom. First, the venom was fractionated using SEC and generated four fractions with fraction C having the highest cardiotoxicity. The subfraction C1 induced an irreversible cardiac arrest of the isolated heart, while subfraction C2 induced an irreversible significant decrease in heart rate without inducing cardiac arrest. Consequently, both fractions were re-fractionated using an RP-HPLC C4 column, and Ammodytin L (AtnL) was identified as the major protein inducing cardiotoxicity [
60]. Another robust biological model to analyze cardiotoxicity could be the zebrafish model. This model is used to monitor atrial and ventricular rates, blood flow and clot formation. Recently, we took advantage of zebrafish embryos transparency to assess the direct cardiotoxicity of SV [
61]. In addition, the zebrafish model was used to isolate the cardiotoxic molecule from
Lachesis muta venom. First, crude venom was fractionated using SEC; then, the active fractions were fractionated using AEX, and fraction 8 with the highest cardiotoxicity was further purified using an RP-HPLC C18 column, generating a pure protein “mutacytin-1” [
62]. Moreover, isolated rat mesenteric arteries might also be used to evaluate the vasorelaxant effect of fractions. This technique was used to isolate the vasorelaxant molecule in
Bothrops leucurus venom. Crude venom was fractionated with CEX followed by RP-HPLC for the vasorelaxant fraction. After MS analysis, the molecule inducing vasorelaxation turned to be a PLA2 [
63]. On the other hand, several neurotoxic components have been isolated and identified from SVs by the means of bioassay-guided fractionation. One of the most common neurotoxic assays used is the chick biventer cervicis nerve-muscle preparation. Neurotoxic components usually induce an inhibition of indirect twitches, leading to a decrease in muscle contraction in a concentration-dependent manner. This assay was used in tandem with SEC to isolate hostoxin-1 from
Hoplocephalus stephensi [
64], rufoxin from
Rhamphiophis oxyrhynchus [
65], and SPAN from
Austrelaps species [
66]. Another method to test neurotoxicity is the evaluation of neurotoxic effects on the sciatic nerve. The neurotoxic component of the venom of
Daboia russelii was identified using this bioassay. The venom was fractionated by SEC and fraction 13 induced neurotoxic symptoms, such as respiratory distress, hind limb paralysis, lacrimation, convulsions, and profuse urination. This fraction was further purified using RP-HPLC, and the isolated protein was shown to inhibit indirectly stimulated twitches of sciatic nerve–muscle preparations [
67]. Of note, SDS-PAGE is very useful in bioassay-guided fractionation, since it can indicate the protein content of each fraction eluted and the purity of the isolated protein [
61]. Different combinations of separation techniques have been used for the isolation of novel SV molecules that upon biological characterization implicate the clinical outcome of the toxins or their potential use for drug development.
Figure 1. Schematic representation of bioassay-guided fractionation, crude venom is separated using a chromatographic technique; then, fractions are assessed using a specified biological assay to choose the corresponding fraction. This step could be repeated several times until we reach a single peak or a pure molecule that could be identified by MS.
3.2. Whole Proteome Characterization and Identification
The currently available separation and analytical techniques allowed researchers to isolate and identify the most abundant constituents of the venoms. However, given the complexity of SVs, numerous molecules remain unexplored. More recently, the fundamental analysis of complex SV proteomes was made less challenging owing to the evolution of proteomics field. Accordingly, several proteomic techniques have been adapted, providing a rapid and relatively inexpensive method for the decomplexation of venom mixtures [
96,
97,
98]. Both proteomic approaches, bottom–up (BU) and top–down (TD), might be used to analyze SVs composition. The latter has not been used in snake venomics until recently, since it is still in the course of progression [
98,
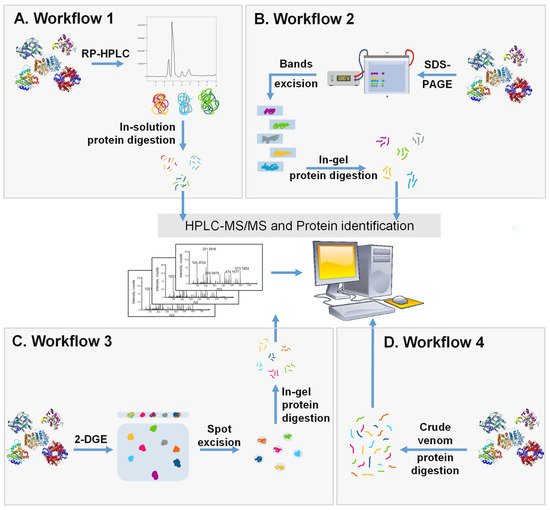
99]. On the other hand, bottom–up proteomics is more frequently used and typically involves the identification of trypsin-digested proteins by tandem mass spectrometry (MS/MS) after separation by both chromatographic and/or electrophoretic techniques. Multiple workflows are used for the BU proteomic analysis of SVs (
Figure 2).
Figure 2. Schematic representation of the 4 major workflows used for whole venom separation and proteome identification. (A) Crude SV is separated with RP-HPLC followed by in-solution trypsin digestion and the identification of components by LC-MS/MS. (B) Crude SV is separated by SDS-PAGE and protein bands are cut, digested, and analyzed using LC-MS/MS. (C) Crude venom is separated using 2-DGE followed by protein spot excision, in-gel digestion, and then protein identification by LC-MS/MS. (D) Crude venom is directly digested into peptides and analyzed using LC-MS/MS.
The first workflow (
Figure 2A) involves the separation of venom mixture with RP-HPLC using a stepwise or linear acetonitrile gradient. This step is followed by an in-solution trypsin digestion of fractions and LC-MS/MS. Prior to digestion, collected fractions can be tested using SDS-PAGE to evaluate the distribution of proteins in each fraction regarding the MW and number of protein bands. This technique was extensively used in the venomics field to reveal the proteomic composition of SVs such as
Bungarus sindanus,
Calliophis intestinalis,
Deinagkistrodon acutus,
Trimeresurus wiroti,
Trimeresurus puniceus, and
Hydrophis curtus [
100,
101,
102,
103,
104,
105]. This technique was also used in several studies to compare the variability between different SVs [
106].
The second workflow (
Figure 2B) involves the use of a electrophoretic separation. In this approach, crude venom is separated by SDS-PAGE, and protein bands are visualized using Coomassie Blue or silver stain. Later, the protein bands are cut, digested, and then analyzed by LC-MS/MS. An RP-HPLC step might be added before the gel separation to increase the resolution of the workflow. This approach was considerably used in venomics for distinct SVs. For example, it was used to characterize and compare venoms of
Trimeresurus macrops and
Trimeresurus hageni and led to the identification of 187 and 216 proteins, respectively [
107].
In the third workflow (
Figure 2C), 2-DGE is first performed and followed by the in-gel digestion of all protein spots that are then analyzed by LC-MS/MS. The strategy was shown to be effective for the separation and identification of several SV proteomes [
108,
109]. As with every technique, 2-DGE has its own advantages and disadvantages. In fact, it provides the advantage of high molecular weight proteins recovery; however, it is sometimes hard to distinguish protein spots due to inaccurate separation and spot trains [
110]. In addition, if protein quantity is insufficient in protein spots, then further analysis might not be performed [
111]. This technique has been used to analyze several snake proteomes such as
Gloydius intermedius,
Agkistrodon contortrix and
Naja asehi [
108,
109,
110]. A study comparing different workflows indicated that the in-gel digestion of proteins provides a lower resolution compared with direct in-solution digestion [
112]. However, after HPLC, in-gel protein digestion provides higher resolution compared to in-solution protein digestion [
113]. These findings show that the choice of the method should be related to the properties of the proteins present in the mixture and to the overall workflow adopted for the analysis.
The fourth workflow (
Figure 2D) is known as shotgun analysis. This technique involves the tryptic digestion of crude venom proteins. Ultimately, the resulting peptides are separated by RP-HPLC using a C18 column followed by MS to identify proteins. Shotgun analysis has numerous advantages over other techniques, since it does not require a decomplexation process at the beginning that is time consuming and, in some cases, expensive. This strategy allows the recovery of low abundant proteins, since they may be lost during the separation step performed in other techniques [
114]. This is reflected with a relatively high number of protein hits compared to other techniques. For example, the analysis of
Vipera ammodytes ammodytes venom with the shotgun technique identified 99 proteins that is folds higher than other workflows used to analyze this SV [
115]. This technique was also used for the analysis of
Deinagkistrodon acutus venom and led to the identification of 84 proteins [
116]. Despite the numerous advantages, some limitations have been reported such as the challenging identification of low molecular weight protein [
115]. One way to overcome this limitation is to employ a combinatorial peptide ligand library and membrane filtration to recuperate low MW proteins [
117]. This allows concentrating low-abundance proteins in the mixture, leading to a better protein coverage by shotgun analysis. The analysis of
Naja ashei venom by Hus et al. indicated that the shotgun technique uncovers proteins that are not identified by other techniques such as 2-DGE, in which 19 proteins were identified compared to 39 proteins identified with shotgun. In this study, the authors indicate that a decomplexation step, although being time and labor consuming, provides higher coverage of proteins [
110]. In another study,
Bothrops leucurus venom yielded 137 proteins hits for shotgun analysis compared to 62 proteins identified using the first workflow [
114].
Ultimately, even with the great advancement in the proteomic field, there is still no standard technique for SV analysis. Rather, a combination of several techniques could be used depending on the available resources and objectives of the study. This has been shown to provide a better coverage of the proteomes, since each technique might identify different sets of proteins. Proteomes of
Naja mossambica and
Naja naja nigricincta were analyzed using three different approaches, and the merged data identified 75 and 73 proteins, respectively, which was higher than the proteins identified by each approach alone [
106]. Similarly,
Naja naja nigricincta and
Bungarus caeruleus venoms were analyzed by three different approaches simultaneously, using the second and fourth workflows, identifying a total of 81 and 46 proteins, respectively, for each SV [
118].
To date, the literature available on snake venomics indicates undoubtedly that bottom–up proteomics is the strategy of choice for venom proteomes analysis. Yet, the use of such a strategy for the analysis of complex mixtures such as SVs is particularly challenging. This is due, in general, to the protein digestion step required prior to MS analysis. TD analysis provides an alternative to solve this problem, since intact proteins might be analyzed directly [
119]. TD was not used in the field of venomics until a few years ago, and its use is limited, since it requires very sophisticated and costly instrumentation. As with any other type of analysis, TD requires the separation of complex protein mixtures prior to MS. Therefore, RP-HPLC constitutes the best method for separation, since it is compatible with the top–down downstream analysis [
120]. However, other separation methods might be used as well [
121]. A multidimensional separation seems to provide the best resolution, and it includes the use of gel-based separations followed by RP-HPLC [
121]. TD proteomics was used successfully for the analysis of several SV proteomes including
Dendroaspis jamesoni,
Dendroaspis kaimosae,
Dendroaspis viridis, and
Ophiophagus hannah venoms [
122,
123]. In addition to being costly, TD analysis has other limitations, including its inconvenience for the identification of high molecular weight proteins that are an abundant constituent of viperid snakes [
119,
121]. Thus, to overcome the limitations of both strategies, an integration of TD and BU proteomics is currently employed and is designated as ‘middle–down proteomics’. This approach was used for the analysis of
Echis carinatus sochureki,
Protobothrops flavoviridis, and
Vipera anatolica senliki venoms and proved to be the most effective compared to each method alone [
124,
125].
Finally, even with the scientific advancement, there is still no standard technique to be employed for the separation of SVs. Therefore, separation and analytical methods should be carefully chosen based on the objectives of the research and the available resources.