Your browser does not fully support modern features. Please upgrade for a smoother experience.
Please note this is an old version of this entry, which may differ significantly from the current revision.
α-Synuclein (αS) is remarkable for both its extensive conformational plasticity and pathologic prion-like properties. A fundamental understanding of αS’ conformational properties has been translated to the development of strain amplification technologies, which have provided further insight into the role of specific strains in distinct α-synucleinopathies, and show promise for the early diagnosis of disease. Strain amplification assays, PMCA and RT-QuIC, are powerful emerging techniques that can detect misfolded αS to diagnose and differentiate synucleinopathies.
- α-synuclein
- strains
- PMCA
- RT-QuIC
1. Introduction
Protein misfolding cyclic amplification (PMCA) has emerged as a powerful tool to study the αS self-aggregation process, characterize the properties of different αS strains, and, more recently, as a sensitive and specific method to diagnose and distinguish distinct α-synucleinopathies. PMCA was first described in 2001 by Soto et al. as a method conceptually similar to polymerase chain reaction cycling, but with the purpose of amplifying minute amounts of a misfolded protein above biochemical limits of detection [1]. Generally, minute quantities of prion protein template units are fragmented by sonication to make polymerization points available for the misfolding of wild-type proteins. This process is cyclically repeated to amplify misfolded proteins to detectable levels, and analyzed with proteinase K digestion and Western blot analysis for the identification of pathological aggregates [1]. Similar in concept, real-time quaking-induced conversion (RT-QuIC) replaces sonication with vigorous intermittent shaking to promote seeded aggregation, and replaces Western blot analysis with the real-time monitoring of fluorescence emitted by aggregate-sensitive Thioflavin-T dye (ThT) during the aggregation process [2]. An overview of strain amplification techniques with αS is shown in Figure 1.
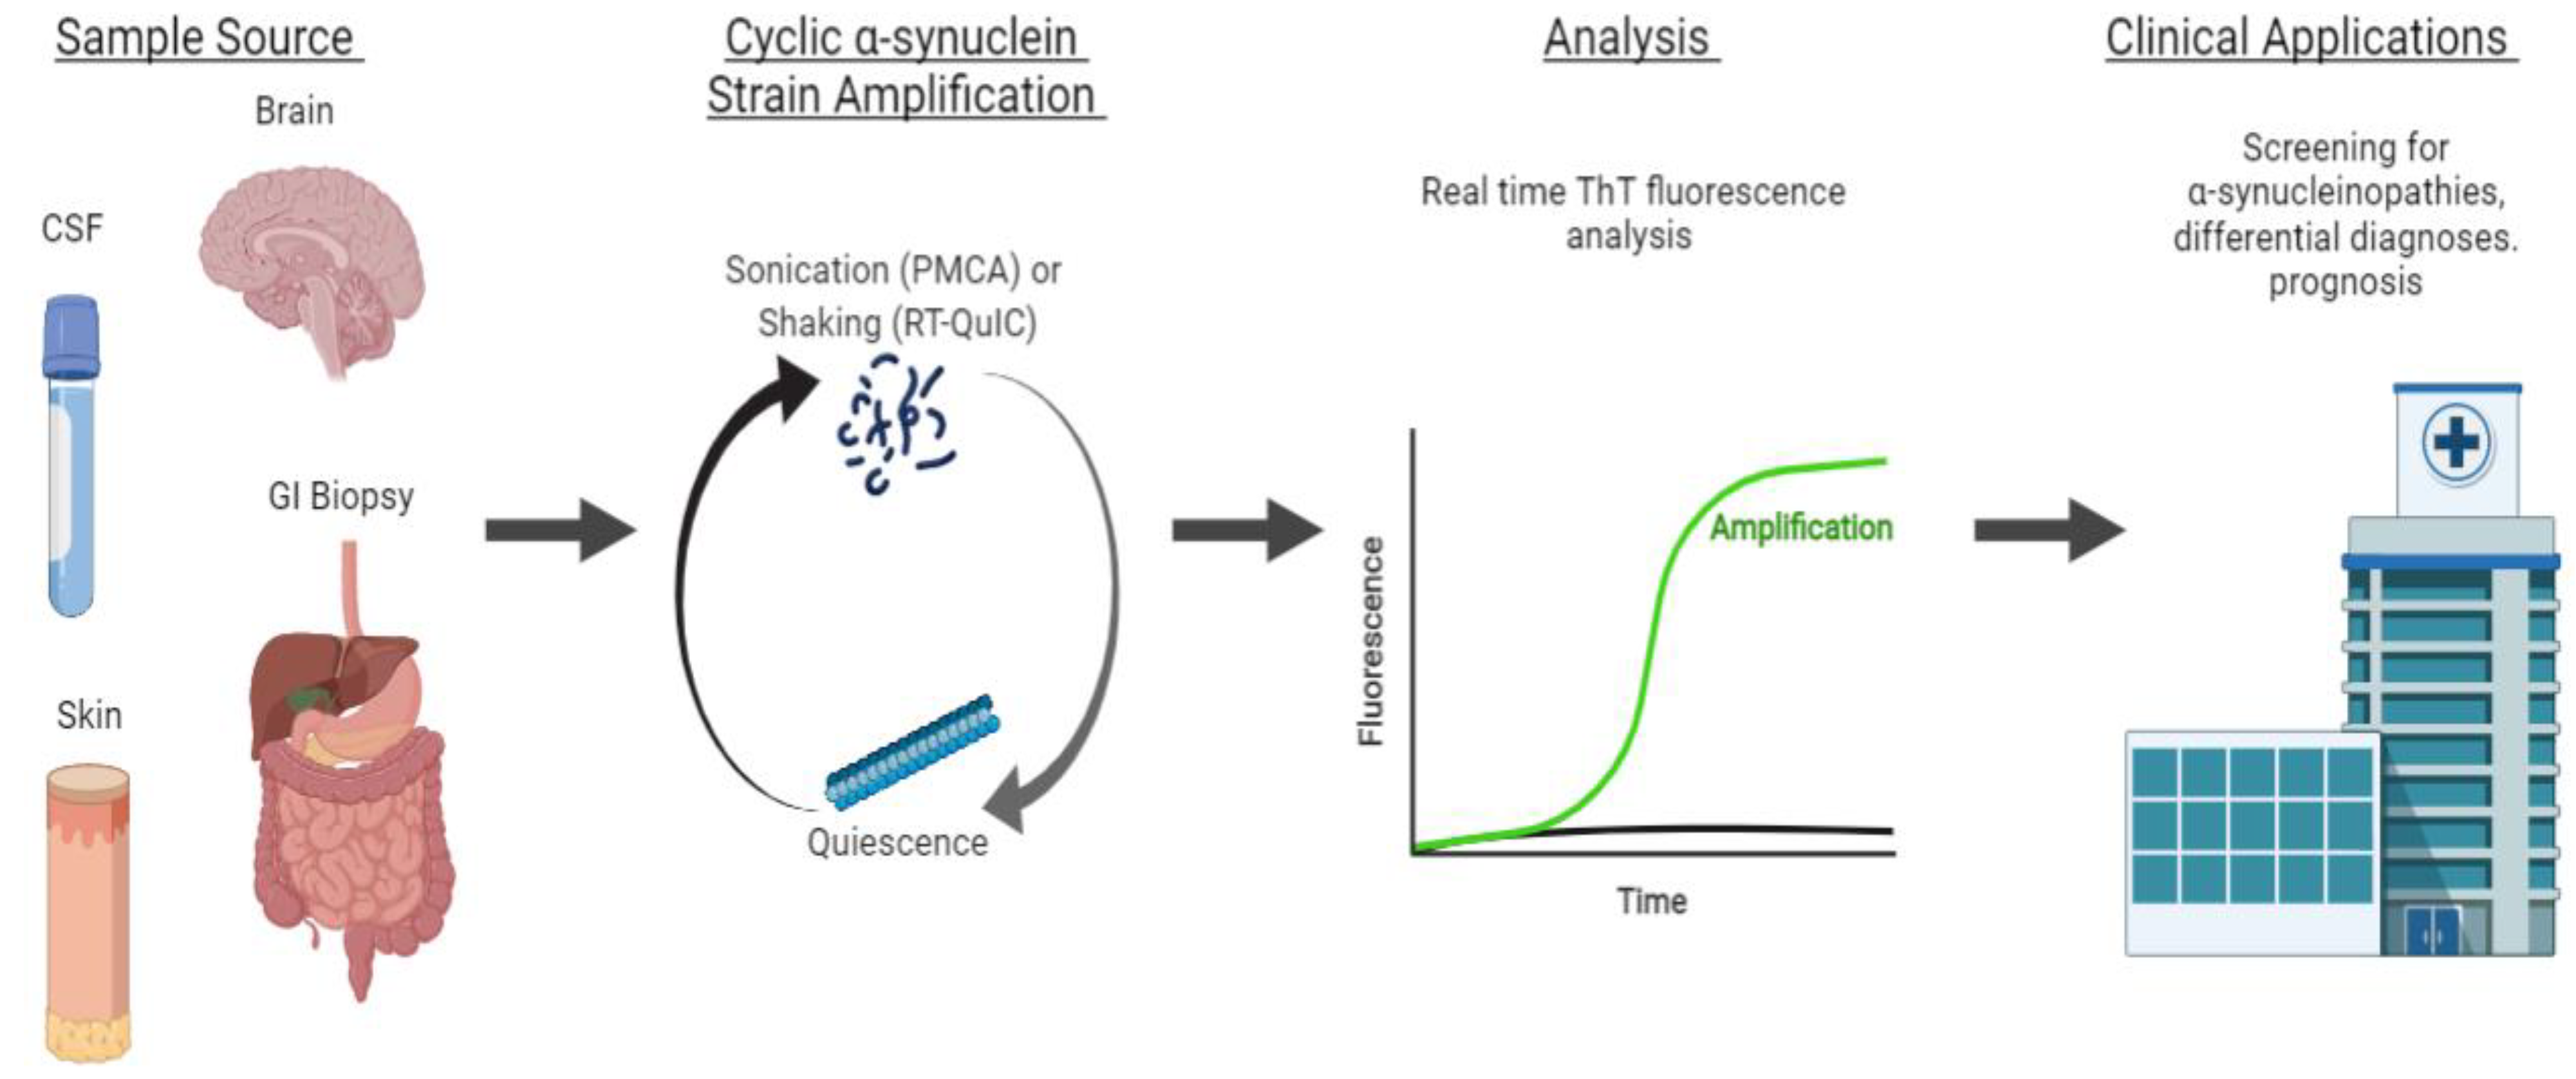
Figure 1. Strain amplification assay for αS. Sample sources include the brain, cerebrospinal fluid (CSF), skin, and gastrointestinal (GI) biopsies. From the sample, αS fibrils are amplified in cycles of sonication (PMCA) or shaking (RT-QuIC) to make polymerization points available for the misfolding of wild-type proteins. The sonication and shaking periods are followed by a period of quiescence, where the fibrils aggregate and polymerize. This process is cyclically repeated to amplify misfolded proteins to detectable levels that are analyzed by the real-time monitoring of ThT fluorescence. This technique can be applied clinically for the early screening, differential diagnoses, and prognosis of α-synucleinopathies.
Synucleinopathies are currently diagnosed based on clinical criteria, with definitive diagnosis only available post-mortem. However, the following content explores recent advances in strain amplification techniques that show promise for the early, objective diagnosis of synucleinopathies [3].
2. αS Detection through Strain Amplification Assays
The detection of the prion-like form of αS with strain amplification assays, PMCA and RT-QuIC, may have both prognostic and diagnostic values. Here, examples of each in the detection of αS in CSF and brain samples of patients with synucleinopathies will be examined. Both PMCA and RT-QuIC were modified for αS detection through fluorescence detection (ThT) instead of Western blot analysis, but differ in protocol, including pH, shaking conditions, and source of recombinant αS protein [4].
2.1. Detection of αS in CSF and Brain
In 2017, the Soto group adapted PMCA to detect αS in the CSF of participants with and without PD, which was the first instance of the use of αS-PMCA as a biochemical diagnosis tool [5]. Their PMCA technique was sensitive and specific in detecting αS in subjects with PD versus controls (Table 1). There were also notable kinetic parameters of the PMCA reaction that correlated with disease severity at the time of sample collection. This study demonstrated the potential applications of PMCA in diagnosis and in monitoring the progression of synucleinopathies [5]. The following year, Becker et al. also used PMCA to detect the seeding activity of αS in formaldehyde-fixed MSA samples, and showed that PMCA with sonication was a sensitive and quantitative method for detecting αS seeding activity [6].
In 2016, RT-QuIC was applied by the Green group to detect αS in the CSF and brains of subjects with dementia with LB and PD compared with controls (Table 1). This illustrated the feasibility of RT-QuIC in the early clinical assessment of patients with synucleinopathies [7]. Further exemplifying how the strain-amplification of αS can be an early biomarker for synucleinopathies, Iranzo et al. used RT-QuIC in a longitudinal study following patients with isolated rapid-eye-movement sleep behavior disorder (IRBD) [8]. IRBD has been identified as a potential prodromal stage of the synucleinopathies PD and dementia with LB. CSF from patients with IRBD and controls was collected and analyzed with RT-QuIC (Table 1). Kaplan–Meier analysis showed that participants who were αS-negative had a lower risk of developing Parkinson’s disease or dementia with Lewy bodies than participants who were αS-positive. This is an exciting development demonstrating the potential of RT-QuIC to diagnose PD or DLB, even before the onset of clinical symptoms. Early detection may facilitate neuroprotective interventions prior to extensive neuronal injury [8].
Table 1. Sensitivities and Specificities of Strain-Amplification Assays. The sensitivities and specificities from the studies described are listed in order of discussion, and categorized by sample source, application, and strain amplification technique.
| Sample Source | Application | Technique | Sensitivity | Specificity | Reference |
|---|---|---|---|---|---|
| CSF | Differentiation of PD from non-synucleinopathy controls | PMCA | 88.5% | 96.6% | Shahnawaz et al., 2017 [5] |
| CSF | Differentiation of DLB from controls | RT-QuIC | 92% | 95% | Fairfoul et al., 2016 [7] |
| Differentiation of PD from controls | 95% | 95% | |||
| CSF | Differentiation of PD from controls | PMCA | 95.2% | 89.9% | Kang et al., 2019 [4] |
| RT-QuIC | 96.2% | 82.3% | |||
| PMCA and RT-QuIC | 97.1% | 92.5% | |||
| CSF | Differentiation of IRBD participants from controls | RT-QuIC | 90% | 90% | Iranzo et al., 2021 [8] |
| GI biopsies | Differentiation of PD from controls | PMCA | 55.56% | 81.81% | Fenyi et al., 2019 [9] |
| Autopsy skin biopsies | Differentiation of PD from controls | PMCA | 82% | 96% | Wang et al., 2020 [10] |
| RT-QuIC | 94% | 98% | |||
| Living skin biopsies | PMCA | 80% | 90% | ||
| RT-QuIC | 95% | 95% | |||
| CSF | Differentiation of MSA from PD | PMCA | 95.4% | 100% | Shahnawaz et al., 2020 [11] |
| Differentiation of PD from non-synucleinopathy controls | 93.6% | 100% | |||
| Differentiation of MSA from controls | 84.6% | 100% | |||
| CSF | Differentiation of MSA from PD/DLB (maximum ThT fluorescence cutoff of <2000 AU) | PMCA | 100% | 83% | Singer et al., 2020 [12] |
| Differentiation of MSA from controls (maximum ThT fluorescence cutoff of >150 AU) | 97% | 100% |
2.2. Detecting αS with Seeding Aggregation Assays in Non-CSF Samples
Most seeding aggregation assay studies for αS have relied on CSF samples, but pathologic αS has been measured in other peripheral tissue and bodily fluids. In PD, increased αS measurements have been collected in post-mortem and ante-mortem peripheral tissue samples of the cardiac plexus, sympathetic ganglia, gastric myenteric plexus, colonic tissue, GI tract, cardiac sympathetic nervous system, heart, salivary gland, and vagus nerve, with increasing evidence that the skin may also be a possible site of αS detection with conventional techniques, such as ELISA and multiplex immunoassays. While CSF has been the most reliably studied bodily fluid for αS detection, αS has also been detected in plasma or serum, blood, and saliva, with red blood cells as a major source of αS [13][14]. In addition to CSF, PMCA and RT-QuIC have been examined with other sites, including peripheral tissue obtained through routine GI and skin biopsies. These additional sites can be more easily accessed or more commonly obtained than CSF, enabling routine screening and the early detection of synucleinopathies.
αS-PMCA was applied to routine GI biopsies by Fenyi et al. Ten out of the eighteen PD patients had detectable αS aggregates, while only one control of eleven was αS-PMCA-positive. Interestingly, although this control was asymptomatic at the time of biopsy, they developed PD symptoms at a 10-year follow-up [9]. This application of seeding aggregation assays in GI biopsies may not be very sensitive, as only 10 out of 18 PD patients were αS-PMCA-positive, but it may be a specific test with utility for screening applications.
In addition to GI biopsies, skin αS seeding through seeding aggregation assays are another potential biomarker for synucleinopathies. The seeding activity of skin αS was analyzed with RT-QuIC and PMCA assays on 160 autopsies and 41 biopsies, and differentiated the PD samples from controls (Table 1) [10]. With these sensitive and specific techniques to assess skin αS seeding activity, skin samples may be used in the antemortem diagnosis of PD and other synucleinopathies. However, studies on other non-CSF or brain samples have been limited, and there is potential for additional investigation in easily accessed bodily fluids, especially blood, as a known major source of αS. Further investigation in additional peripheral tissue sites or bodily fluids will provide insight into the feasibility of PMCA and RT-QuIC for the minimally invasive routine diagnosis of synucleinopathies.
2.3. Strain Amplification Assays in Differentiating Synucleinopathies
Prior studies focused mainly on using seeding aggregation assays to distinguish synucleinopathies from non-synucleinopathies, but recent developments in our understanding of kinetics, fibrillary aggregate structures, and advancements in technology have improved the discriminating ability of these assays to distinguish between synucleinopathies.
Shahnawa et al. of the Soto group were the first to establish an αS-PMCA assay to discriminate between samples of CSF from patients diagnosed with PD or MSA with high sensitivity and specificity. PMCA analysis indicated differences in the maximal ThT fluorescence and aggregation kinetics between CSF samples from PD versus MSA patients, which was confirmed by post-mortem brain specimens of the same subjects. Additional spectroscopic, biochemical, and toxicity studies also showed differences in structure and toxicity between MSA and PD αS aggregates [11].
The assessment of PMCA aggregation kinetics was conducted by the Soto group, as measured by ThT fluorescence. MSA samples aggregated faster, but reached a lower maximum fluorescence than PD samples. The group confirmed with post-mortem brain specimens of both PD and MSA patients that the activity of aggregates in CSF reflects that of aggregates in the brain. PMCA analysis distinguished PD from MSA, as well as PD and MSA from non-synucleinopathy controls (Table 1). After PMCA amplification, both MSA and PD samples contained equal amounts of aggregates, indicating that the difference in the maximal ThT fluorescence resulted from differences in ThT–aggregate interactions due to conformationally distinct αS prions in PD and MSAs. In examining structural differences, spectroscopy revealed that MSA aggregates have a higher proportion of β-sheet structures than PD aggregates. Additional studies of the aggregates with cryo-electron microscopy showed that both PD and MSA fibrils were composed of two protofilaments that intertwine in a left-handed helix. However, the structures of αS aggregates differed as MSA αS filaments had shorter twists (46–105 nm in length), whereas PD αS filaments were straighter, with longer helical twists (76.6–199 nm in length). This is consistent with immune-electron microscopy that showed brain-derived αS filaments from patients with MSA as predominantly twisted compared with the mostly straight filaments from PD patients. Additionally, in a cell culture model, MSA-derived αS-PMCA aggregates showed significant toxicity at concentrations four times lower than those of their PD-derived counterparts [11][15].
Additionally, in 2020, Singer et al. of the Low group, in collaboration with Soto, used PMCA to differentiate MSA from other Lewy body synucleinopathies in CSF samples [12]. The group observed the same pattern of αS aggregation kinetics as the Soto group in the previously discussed section, where PD/DLB aggregation occurred later with a higher maximum fluorescence level, which allowed them to differentiate MSA from PD/DLB. The group adjusted the cutoff for maximum ThT fluorescence to optimize the sensitivity and specificity of the assays to differentiate MSA from controls and MSA from PD/DLB (Table 1). The sensitivity and specificity are improved when ThT fluorescence is coupled with a neurofilament light-chain protein (NFL) biomarker cutoff, which is significantly elevated in MSA patients compared with healthy controls. The group found a range of cutoff values for both NFL and fluorescence values to differentiate MSA from PD/DLB and controls with high sensitivity and specificity [12].
Overall, PMCA was shown to maintain the biochemical and structural properties of disease-specific αS strains during the amplification process, and thus may serve as an important tool in distinguishing between MSA and PD, which may present with similar early clinical signs, despite their distinct progressions and treatment plans [10]. Without any current objective ante-mortem diagnosis tool for MSA and other synucleinopathies, PMCA is a potential non-invasive tool to analyze αS activity as a potential prognostic biomarker.
3. Comparing PMCA and RT-QuIC Detection of αS
A comparison of αS-PMCA and RT-QuIC was performed by Kang et al., who provided the Soto and Green groups with separate aliquots of CSF from the same subjects. Between the two techniques, there was a high concordance of results of 92%. Among the discrepant findings, no systematic explanation was found [4].
PMCA and RT-QuIC differ slightly in their protocol conditions, but both techniques apply a maximum ThT fluorescence threshold to identify a positive case of disease. The ThT dye is specific to aggregated fibrils, and is used in real-time to measure the kinetics of αS aggregation. Cutoff values for maximum ThT fluorescence are chosen to differentiate a sample with synucleinopathy from controls. Both assays were sensitive and specific, but the sensitivity and specificity were improved when both assays were performed together for concordant results (Table 1). In principle, both techniques support a common conceptual basis that misfolded αS proteins present in the CSF of PD patients can seed the aggregation of monomeric αS protein through a prion-like propagation of an aberrant protein conformation [16].
In summary, the self-aggregation assays, PMCA and RT-QuIC, show promise for the screening and diagnosis of Parkinson’s disease and other α-synucleinopathies. Recent advances in these techniques have enabled the identification of the conformationally distinct αS strains that underlie the pathophysiology of different α-synucleinopathies. They are objective tools with the capacity for early diagnosis, raising the possibility for enhanced patient care through early interventions targeting pathologic αS transmission or other neuroprotective measures. An enhanced understanding of the kinetics of αS aggregation, structural properties of αS fibrils, and coupling to additional biomarkers may further enhance the accuracy of these assays in the diagnosis and prognosis of synucleinopathies.
This entry is adapted from the peer-reviewed paper 10.3390/biom12070994
References
- Saborio, G.P.; Permanne, B.; Soto, C. Sensitive Detection of Pathological Prion Protein by Cyclic Amplification of Protein Misfolding. Nature 2001, 411, 810–813.
- Atarashi, R.; Sano, K.; Satoh, K.; Nishida, N. Real-Time Quaking-Induced Conversion: A Highly Sensitive Assay for Prion Detection. Prion 2011, 5, 150–153.
- Vilas, D. Moving Forward the in Vivo Diagnosis of the Synucleinopathies. Clin. Auton. Res. 2019, 29, 575–576.
- Kang, U.J.; Boehme, A.K.; Fairfoul, G.; Shahnawaz, M.; Ma, T.C.; Hutten, S.J.; Green, A.; Soto, C. Comparative Study of Cerebrospinal Fluid α-Synuclein Seeding Aggregation Assays for Diagnosis of Parkinson’s Disease. Mov. Disord. 2019, 34, 536–544.
- Shahnawaz, M.; Tokuda, T.; Waragai, M.; Mendez, N.; Ishii, R.; Trenkwalder, C.; Mollenhauer, B.; Soto, C. Development of a Biochemical Diagnosis of Parkinson Disease by Detection of α-Synuclein Misfolded Aggregates in Cerebrospinal Fluid. JAMA Neurol. 2017, 74, 163–172.
- Becker, K.; Wang, X.; Vander Stel, K.; Chu, Y.; Kordower, J.; Ma, J. Detecting Alpha Synuclein Seeding Activity in Formaldehyde-Fixed MSA Patient Tissue by PMCA. Mol. Neurobiol. 2018, 55, 8728–8737.
- Fairfoul, G.; McGuire, L.I.; Pal, S.; Ironside, J.W.; Neumann, J.; Christie, S.; Joachim, C.; Esiri, M.; Evetts, S.G.; Rolinski, M.; et al. Alpha-Synuclein RT-QuIC in the CSF of Patients with Alpha-Synucleinopathies. Ann. Clin. Transl. Neurol. 2016, 3, 812–818.
- Iranzo, A.; Fairfoul, G.; Ayudhaya, A.C.N.; Serradell, M.; Gelpi, E.; Vilaseca, I.; Sanchez-Valle, R.; Gaig, C.; Santamaria, J.; Tolosa, E.; et al. Detection of α-Synuclein in CSF by RT-QuIC in Patients with Isolated Rapid-Eye-Movement Sleep Behaviour Disorder: A Longitudinal Observational Study. Lancet Neurol. 2021, 20, 203–212.
- Fenyi, A.; Leclair-Visonneau, L.; Clairembault, T.; Coron, E.; Neunlist, M.; Melki, R.; Derkinderen, P.; Bousset, L. Detection of Alpha-Synuclein Aggregates in Gastrointestinal Biopsies by Protein Misfolding Cyclic Amplification. Neurobiol. Dis. 2019, 129, 38–43.
- Wang, Z.; Becker, K.; Donadio, V.; Siedlak, S.; Yuan, J.; Rezaee, M.; Incensi, A.; Kuzkina, A.; Orrú, C.D.; Tatsuoka, C.; et al. Skin α-Synuclein Aggregation Seeding Activity as a Novel Biomarker for Parkinson Disease. JAMA Neurol. 2020, 78, 30–40.
- Shahnawaz, M.; Mukherjee, A.; Pritzkow, S.; Mendez, N.; Rabadia, P.; Liu, X.; Hu, B.; Schmeichel, A.; Singer, W.; Wu, G.; et al. Discriminating α-Synuclein Strains in Parkinson’s Disease and Multiple System Atrophy. Nature 2020, 578, 273–277.
- Singer, W.; Schmeichel, A.M.; Shahnawaz, M.; Schmelzer, J.D.; Boeve, B.F.; Sletten, D.M.; Gehrking, T.L.; Gehrking, J.A.; Olson, A.D.; Savica, R.; et al. Alpha-Synuclein Oligomers and Neurofilament Light Chain in Spinal Fluid Differentiate Multiple System Atrophy from Lewy Body Synucleinopathies. Ann. Neurol. 2020, 88, 503–512.
- Atik, A.; Stewart, T.; Zhang, J. Alpha-Synuclein as a Biomarker for Parkinson’s Disease. Brain Pathol. 2016, 26, 410–418.
- Campese, N.; Beatino, M.F.; Del Gamba, C.; Belli, E.; Giampietri, L.; Del Prete, E.; Galgani, A.; Vergallo, A.; Siciliano, G.; Ceravolo, R.; et al. Ultrasensitive Techniques and Protein Misfolding Amplification Assays for Biomarker-Guided Reconceptualization of Alzheimer’s and Other Neurodegenerative Diseases. Expert Rev. Neurother. 2021, 21, 949–967.
- Lipp, A.; Sandroni, P.; Ahlskog, J.E.; Fealey, R.D.; Kimpinski, K.; Iodice, V.; Gehrking, T.L.; Weigand, S.D.; Sletten, D.M.; Gehrking, J.A.; et al. Prospective Differentiation of Multiple System Atrophy from Parkinson Disease, with and without Autonomic Failure. Arch. Neurol. 2009, 66, 742–750.
- Luk, K.C.; Kehm, V.; Carroll, J.; Zhang, B.; O’Brien, P.; Trojanowski, J.Q.; Lee, V.M.-Y. Pathological α-Synuclein Transmission Initiates Parkinson-like Neurodegeneration in Nontransgenic Mice. Science 2012, 338, 949–953.
This entry is offline, you can click here to edit this entry!