Your browser does not fully support modern features. Please upgrade for a smoother experience.
Please note this is an old version of this entry, which may differ significantly from the current revision.
A quartz crystal microbalance (QCM) is a typical acoustic transducer that undergoes a frequency shift due to changes in the mass of its surface. Its high sensitivity, robustness, small size design, and digital output have led to its widespread development for application in the fields of chemistry, physics, biology, medicine, and surface science. Mass sensitivity is one of the vital parameters and forms the basis for quantitative analysis using QCMs.
- quartz crystal microbalance (QCM)
- mass sensitivity
- electrode parameter
1. Introduction
A quartz crystal microbalance (QCM) is a typical bulk acoustic wave device that consists of a vibrating quartz plate sandwiched between two metal excitation electrodes. Due to the piezoelectric effect of quartz crystals, the QCM is a typical mass sensor that can translate the mass change on its surface into a frequency change [1][2][3]. With the advantages of simple structure, easy operation, low cost, high sensitivity, and measurement accuracy that can reach the nanogram level, QCMs have been widely used in chemistry, physics, biology, medicine, and surface science for compositional analysis of gases and liquids, as well as measurement of micromasses and film thickness and in viscoelastic structure detection [4][5][6][7][8][9][10]. The further development of the subsequent electrochemical quartz crystal microbalance (E-QCM) and quartz crystal microbalance with dissipation (QCM-D) techniques facilitate online tracking to detect changes in microscopic processes, with the advantage of access to rich information that is not possible with other methods [11][12][13][14][15][16][17][18][19][20][21].
A large number of review articles of QCM-related works have been published in the past. However, they are mainly application-oriented review articles. For example., Thompson et al. reviewed the theoretical aspects of QCMs for liquid phase operation and suggested measurement methods and applications [22]. Fauzi et al. focused on the graphene-material-based QCM sensors for gas and humidity detection [6]. Mujahid et al. provided a comparative review of high-frequency acoustic sensors (mainly QCMs, SAWs, and FBARs) for chemical and biochemical applications [23]. Later, Dirri et al. provided a review of QCM sensors for monitoring contaminants in space missions, i.e., space shuttle flights, NASA Space Transportation System (NASA STS), and satellite missions [24]. Akgöneüllü et al. reviewed QCM biosensors based on the molecular imprinting technique for disease-related biomarkers [25]. In addition, Alassi et al. presented a comprehensive review of the various existing electronic interfacing systems of QCMs, including impedance-based analysis, oscillators (conventional and lock-in based techniques), exponential decay methods, and the emerging phase-mass-based characterization [26].
The core component of the QCM is a quartz crystal resonator, so early publications on this topic also referred to it directly as a QCR, which was first used as a frequency control element [27][28][29]. As early as 1944, Bottom pointed out that the frequency change of a quartz crystal resonator during the aging process is proportional to the change in its surface thickness [30]. Around 15 years later, Sauerbrey theoretically deduced the relationship between the frequency shift and the mass change on the surface of QCM when ignoring the effect of the metal electrodes as [2][31]
where the negative sign indicates that the resonant frequency decreases as the additional mass on the surface of QCM increases. f0 is the fundamental frequency of the QCM, ρq (=2.648 g/cm3) is the quartz crystal density, μq (=2.947 × 10¹¹ g/cm·s2) is the shear modulus of the AT-cut quartz crystal, A is the effective vibration area, and Cf is the Sauerbrey mass sensitivity. Δm and Δf are the additional mass attached to the surface of QCM and the corresponding frequency shift, respectively. However, it is worth noting that the Sauerbrey equation is satisfied when the additional mass layer is rigid, uniformly distributed, and of small mass. The Sauerbrey equation can be used to quantify the relationship between mass information and electrical signals, thus laying the theoretical foundation for the use of a QCM as a mass sensor.
However, in practice, QCMs must have metal electrodes, so the effect of metal electrodes on the mass sensitivity cannot be ignored [32][33]. Due to the metal electrodes, the QCM mass sensitivity cannot simply be considered as a constant, but as a Gaussian distribution [34][35]. The electrode parameters have great influence on the mass sensitivity of the QCM, which may lead to increased errors in quantitative analysis. In quantitative analysis in the gas phase, Cf—which is the integration of the mass sensitivity over the sensing area, also known as the equivalent mass sensitivity—is mainly used, so the mass sensitivity distribution is important for QCM gas phase applications [31].
For a single drop of liquid on the center of a QCM electrode, the frequency change can be calculated using the following equation [36][37]:
where re and rd are the radii of the electrode and droplet, respectively. ρL and μL are the density and viscosity of the liquid, respectively. K is also the equivalent mass sensitivity, which means that the QCM mass sensitivity plays a decisive role in the frequency response of a single drop of liquid. It can be seen that the frequency variation of the QCM is still proportional to the mass sensitivity distribution in the droplet test.
Kanazawa et al. derived the formula for calculating the frequency change of the QCM when one surface of QCM is fully immersed in a Newtonian liquid [13][14]:
The thickness shear wave of the QCM is transmitted into the liquid interior through the contact with the liquid surface, and this shear wave rapidly decays to zero under the damping effect of the liquid load. According to acoustic wave theory, the penetration depth of the acoustic wave in the liquid is determined by the acoustic frequency, liquid viscosity, and liquid density [36].
Only the liquid layer within the depth of acoustic wave penetration, also known as the effective mass layer, affects the resonance frequency of the QCM [38]. Therefore, it can be shown that Equation (3) can be exactly equated to Equation (1). That is, the frequency change of Kanazawa’s equation in the liquid phase test is still proportional to the equivalent mass sensitivity, which means that mass sensitivity has an indispensable effect on the quantitative analysis of QCM in both gas and liquid phases. Therefore, it is necessary to investigate the influence of electrode parameters (electrode shape, electrode diameter, electrode thickness, electrode material, etc.) on the mass sensitivity distribution of QCM.
2. Electrode Shape and Mass Sensitivity
The shape commonly used for QCM electrodes is a symmetric circular configuration, also known as the m-m electrode QCM, as shown in Figure 1. Many scholars including Cumpson, Hillier, and Josse, have calculated the mass sensitivity distribution of the m-m electrode QCMs and found that it conforms to Gaussian distribution [34][35][39][40]. Cumpson et al. found that the higher the electrode density, the more the QCM vibration is confined to the electrode center [40].
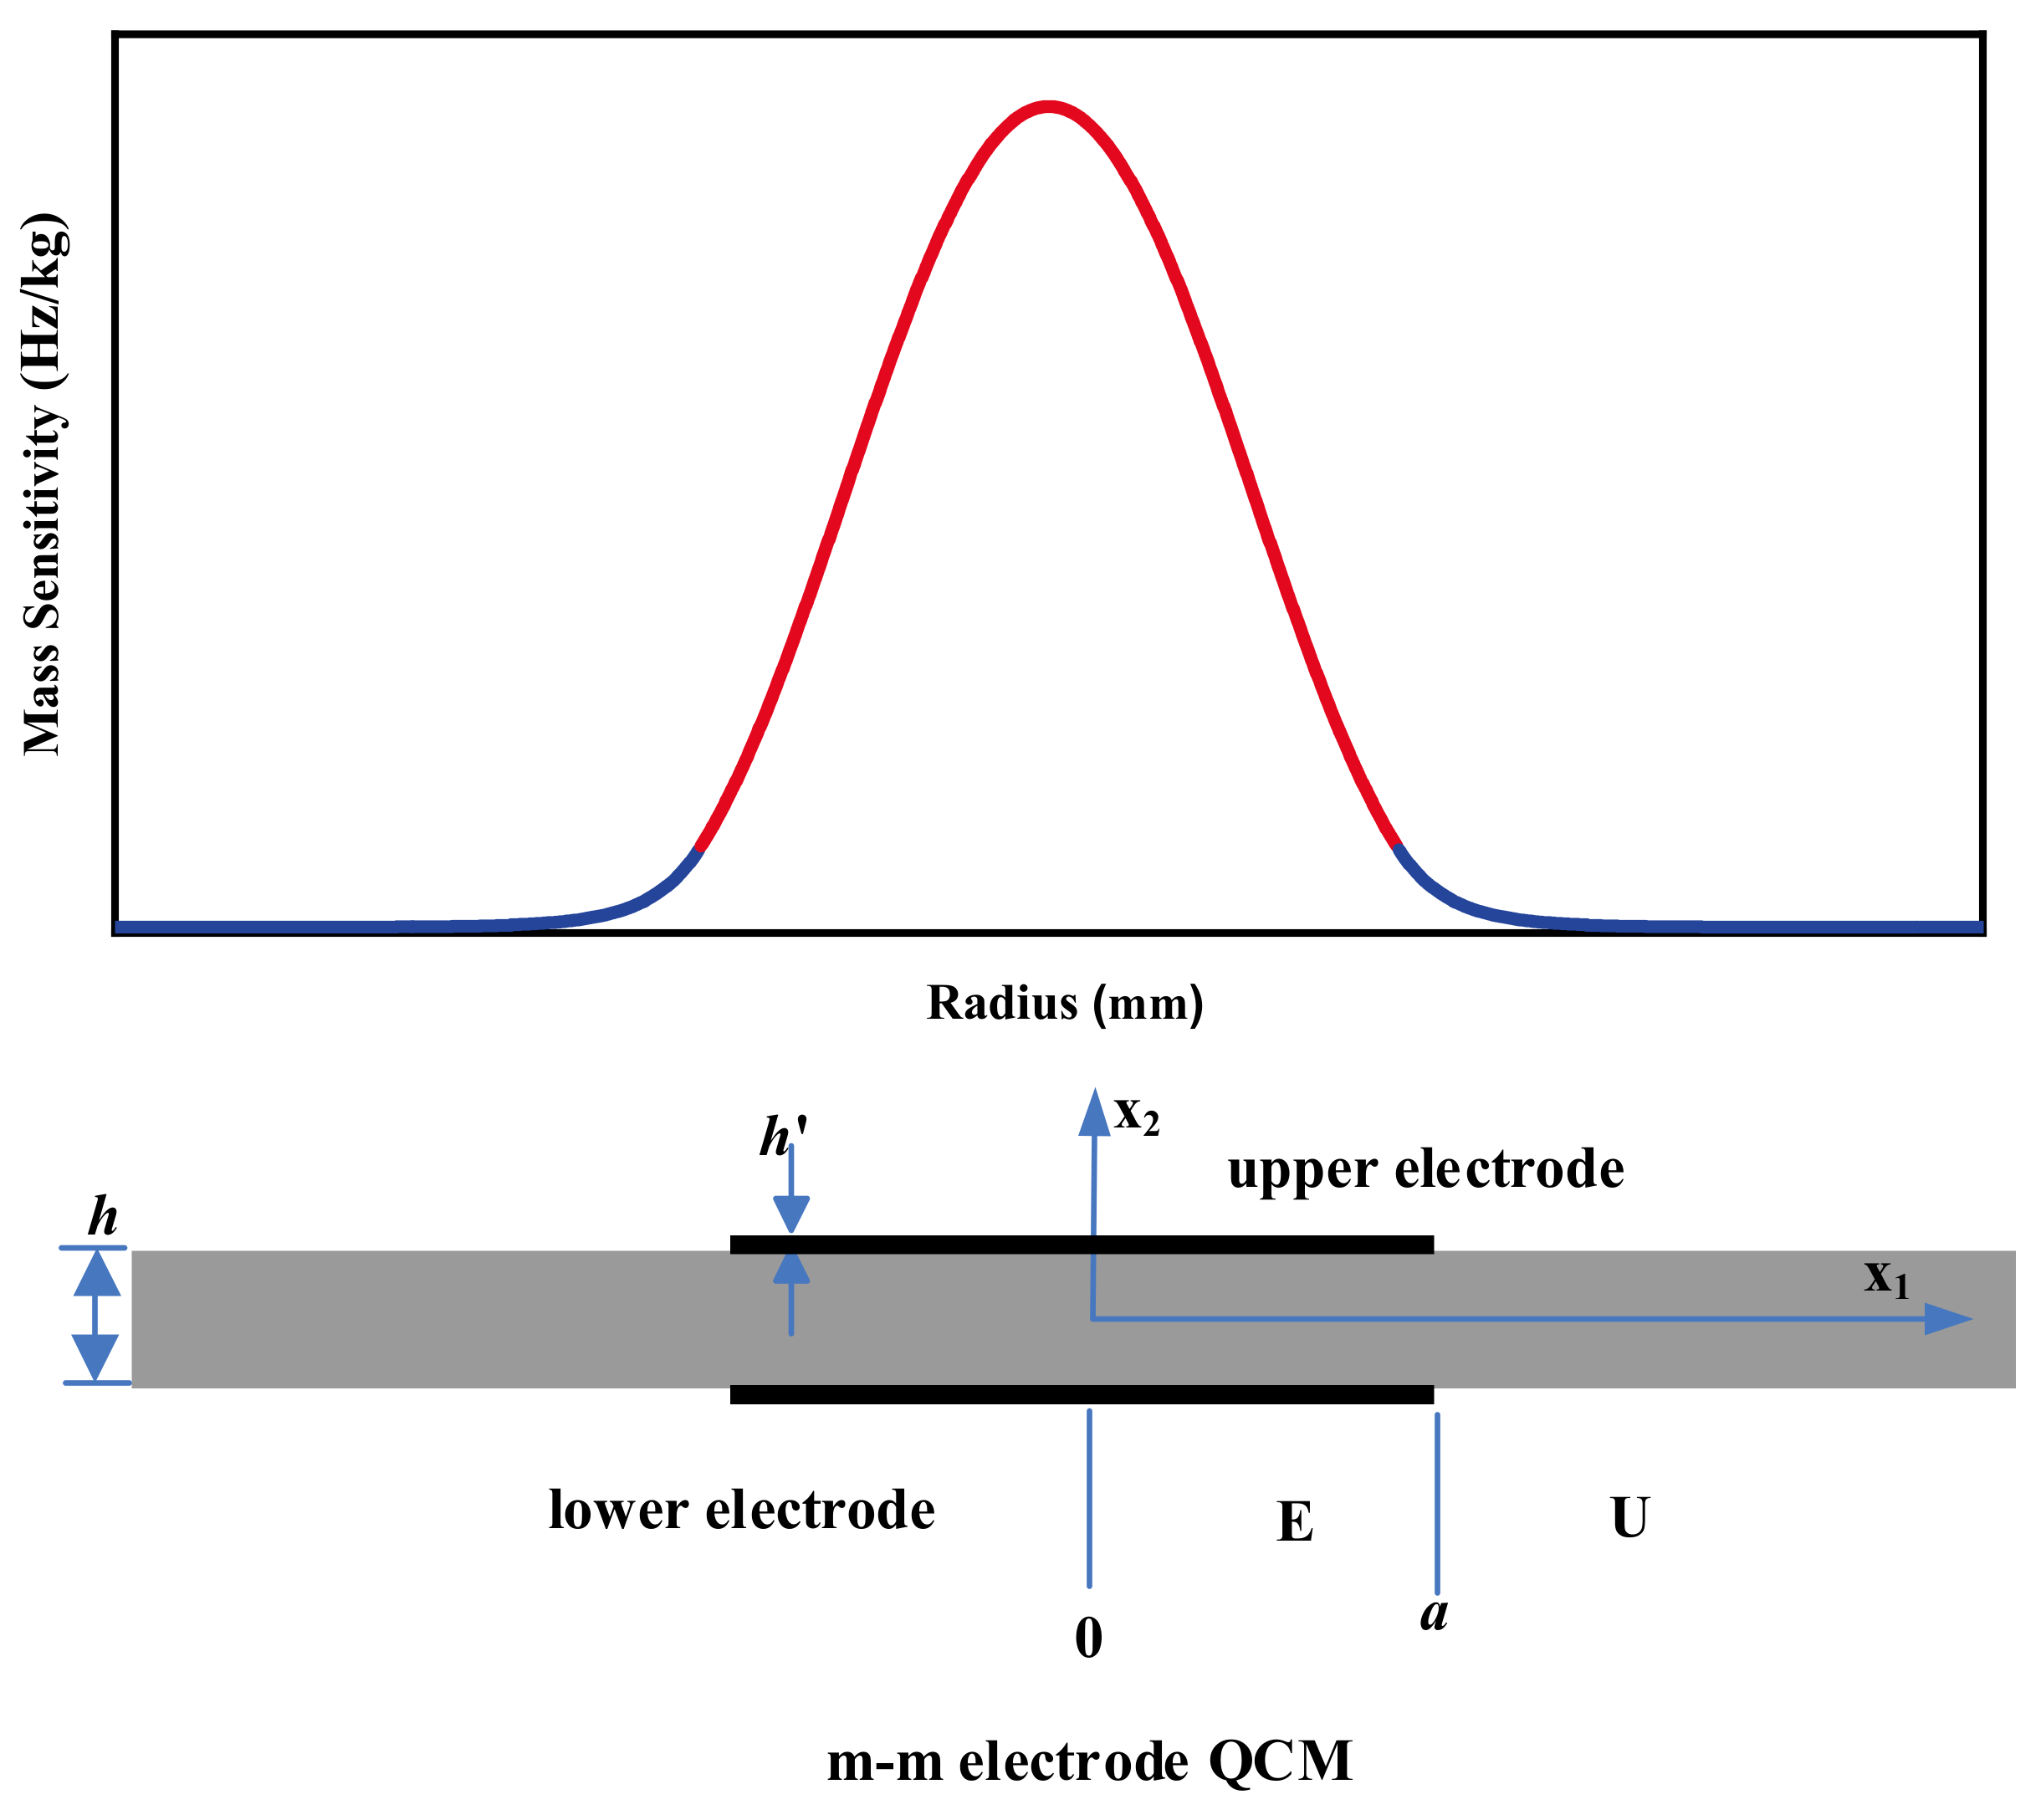
Figure 1. Schematic diagram of the structure and mass sensitivity distribution of the m-m electrode QCM [31]. Here a is the radius of the circular metal electrode. h and h′ are the thickness of the quartz wafer and the metal electrode, respectively.
In 1998, Josse et al. were the first to analyze the radial dependence of the mass sensitivity distribution for QCMs with modified electrode shapes, mainly n-m electrode QCMs and ring electrode QCMs, as shown in Figure 2a,b, respectively [39]. The n-m electrode QCM has circular electrodes on both upper and lower sides, but the diameter of the upper electrode (called n electrode) is smaller than that of the lower electrode (called m electrode). Generally, the diameter of the upper and lower electrodes are directly used to name the n-m electrode QCM; for example, the name 4–7 QCM indicates that the upper and lower diameters of the n-m electrode QCM are divided into 4 and 7 mm, respectively [39]. In the field of frequency control, it is recognized that quartz crystal resonators with n-m electrodes have a higher Q value than quartz crystal resonators with m-m electrodes, which means better stability. Josse et al. concluded that compared with the conventional m-m electrode QCM, the energy is more concentrated in the central region of the smaller electrode, which therefore have a higher mass sensitivity. The calculated results for the mass sensitivity distribution of the AT-cut, 11 MHz QCM with a mass loading factor of 0.006, are shown in Figure 2c. The 4–7 QCM has a significantly higher sensitivity curve than 7–7 QCM, which indicates that the mass sensitivity distribution of the n-m electrode QCM is significantly higher than that of the m-m electrode QCM. The 3–7 QCM has a significantly higher sensitivity curve than 4–7 QCM, which indicates that the smaller the electrode, the more energy concentrated at the center of the QCM and, therefore, the higher mass sensitivity. They also calculated the mass sensitivity of QCM with different mass loading factors for 4–7 QCMs, as shown in Figure 2d. It can be seen from the results that the larger the mass loading factor, the greater the mass sensitivity of n-m electrode QCM. The ring electrode QCM, as shown in Figure 2b, has a ring electrode on the upper surface and a circular electrode on the lower surface. Figure 2e,f show the particle displacement amplitude and mass sensitivity function distribution of the ring electrode QCM, respectively. It can be seen that the mass sensitivity of the ring electrode QCM shows a bimodal distribution, rather than the Gaussian-type mass sensitivity function distribution of the m-m electrode QCM and n-m electrode QCM, and the concavity trend between the bimodal peaks can be optimized by adjusting the mass loading factor.
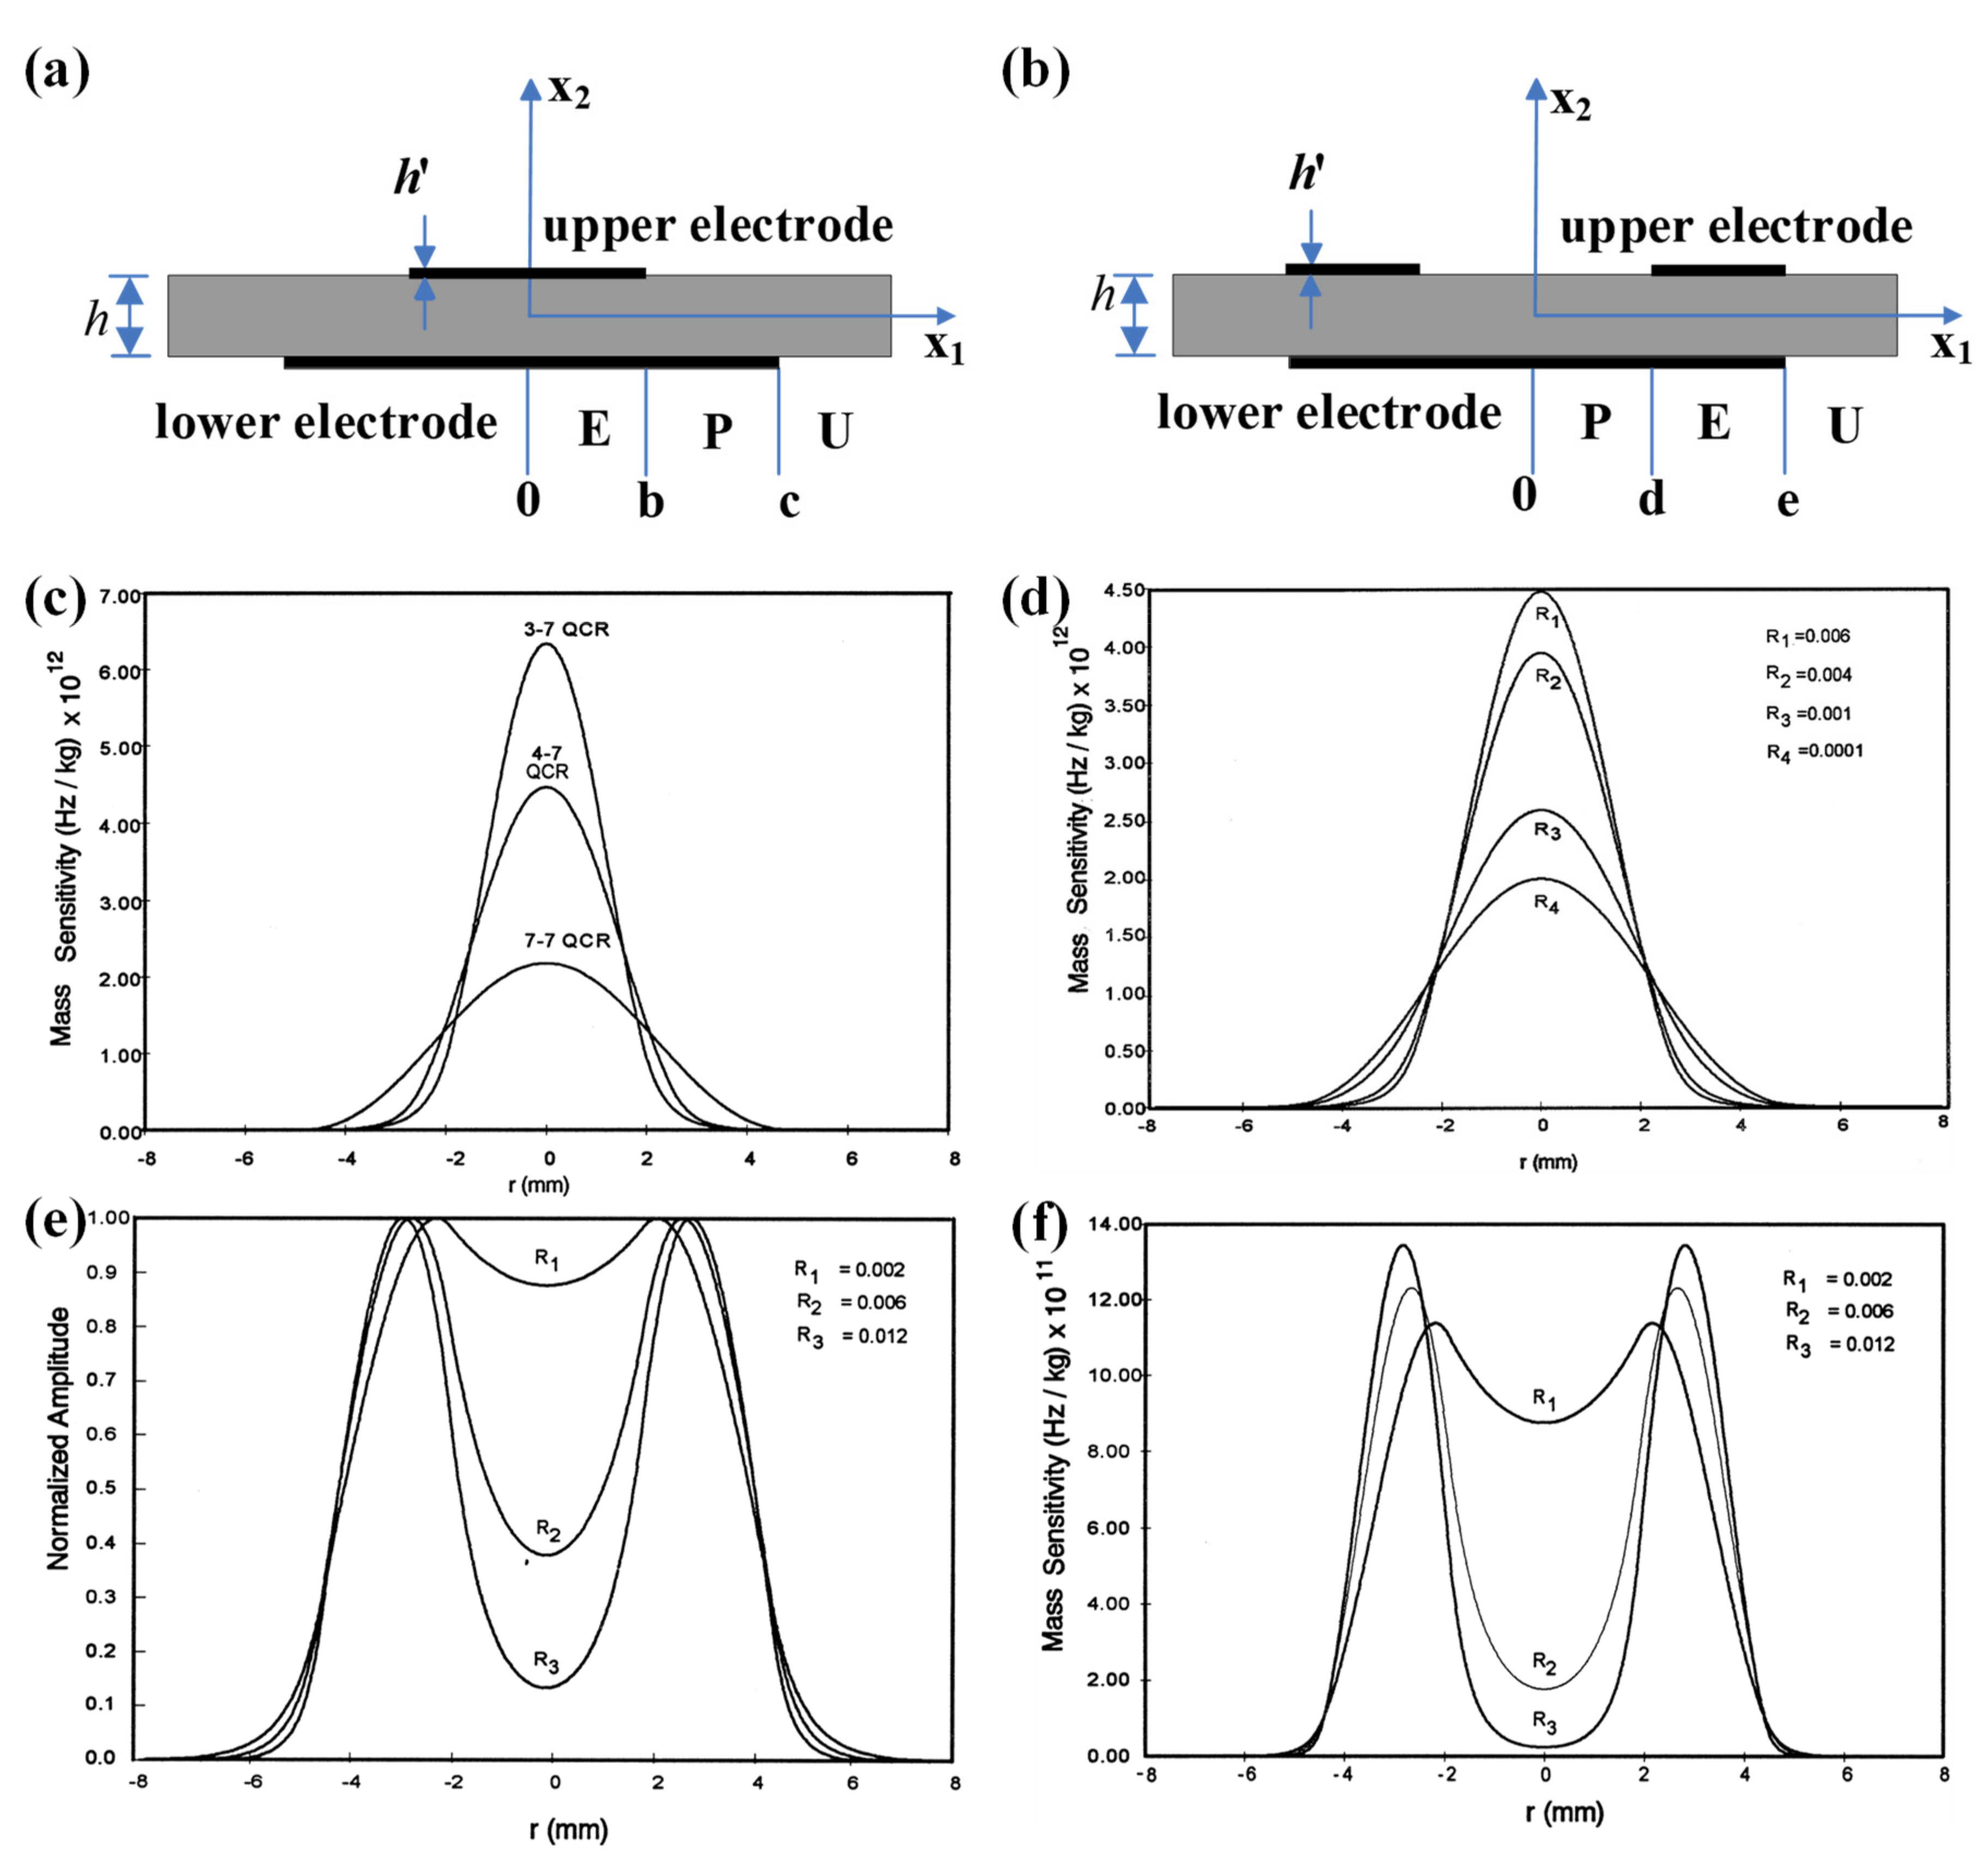
Figure 2. Schematic diagram of the structure of the (a) n-m electrode QCM and (b) ring electrode QCM. The mass sensitivity distribution function of n-m electrode 11 MHz AT-cut QCMs under (c) different diameters and (d) different mass loading factors. (e) Particle displacement amplitude profile and (f) mass sensitivity distribution function of ring electrode 11 MHz AT-cut QCMs [39]. b and c are the radii of the upper electrode and lower electrode for the n-m electrode QCM, respectively. d and e are the radii of the inner and outer electrode, respectively.
The Gaussian-type mass sensitivity distribution is not conducive to the quantitative analysis of QCM in practical applications, which is one of the reasons for poor reproducibility of QCM quantitative analysis [41]. Therefore, scholars hope to obtain uniform mass sensitivity by optimizing the QCM electrode shape, i.e., the mass sensitivity becomes a constant in the central region. In 2008, Richardson et al. continued to explore the mass sensitivity distribution of ring electrode QCM in depth with Josse’s work [42][43]. They illustrated, by calculation, that uniform mass sensitivity distribution can be obtained for AT-cut ring electrode with inner and outer diameters of 4 and 10 mm, respectively, at a mass loading factor of 0.0025. They tested the mass sensitivity distribution of this ring electrode QCM using the droplet weight method. Unfortunately, the experimental results showed that there is still a concavity between the double peaks of the mass sensitivity distribution of this ring electrode QCM.
Shi et al. investigated the mass sensitivity distribution of an AT-cut rectangular ring electrode QCM [44]. The electrode was also rectangular with its central part missing, thus forming a rectangular ring electrode. It was found that the vibrations tend to be trapped in the electrode region and decay away from the edge of the electrode. Through theoretical calculations and finite element analysis, the authors also demonstrated that by properly designing the electrode size, the vibrations in the central part of the plate can be made almost uniform, resulting in uniform mass sensitivity distribution. Unfortunately, there is no experimental evidence to support their idea.
In 2013, Gao et al. investigated the mass sensitivity distributions of several other modified electrode QCMs, mainly ring electrode QCM, dot-ring electrode QCM, and double-ring electrode QCM, in order to obtain uniform mass sensitivity function distribution [45]. The thicknesses of quartz wafer for fundamental, third overtone, and fifth overtone operating frequencies of 10 MHz QCM were 0.1648, 0.4974, and 0.8298 mm, respectively, with an electrode thickness of 1000 Å and inner and outer diameters of 2.12 and 2.85 mm, respectively. They first calculated the mass sensitivity distributions for fundamental, third overtone, and fifth overtone operating frequencies of 10 MHz, as shown in Figure 3c, and it can be seen that the fifth overtone mode is more suitable for obtaining uniform mass sensitivity function distribution. Then, the authors presented the dot-ring electrode QCM, and the double-ring electrode QCM, as shown in Figure 3a,b, respectively. Figure 3d shows the theoretical mass sensitivity function distributions calculated by authors. It can be seen that by forming two additional peak points, the concavity of the mass sensitivity distribution for the double-ring electrode QCM is significantly reduced compared with the ring electrode QCM and the dot-ring electrode QCM. It is worth noting that the mass sensitivity curve of QCM should be smooth and derivable everywhere, so there is room for further refinement of the calculation by Gao et al.
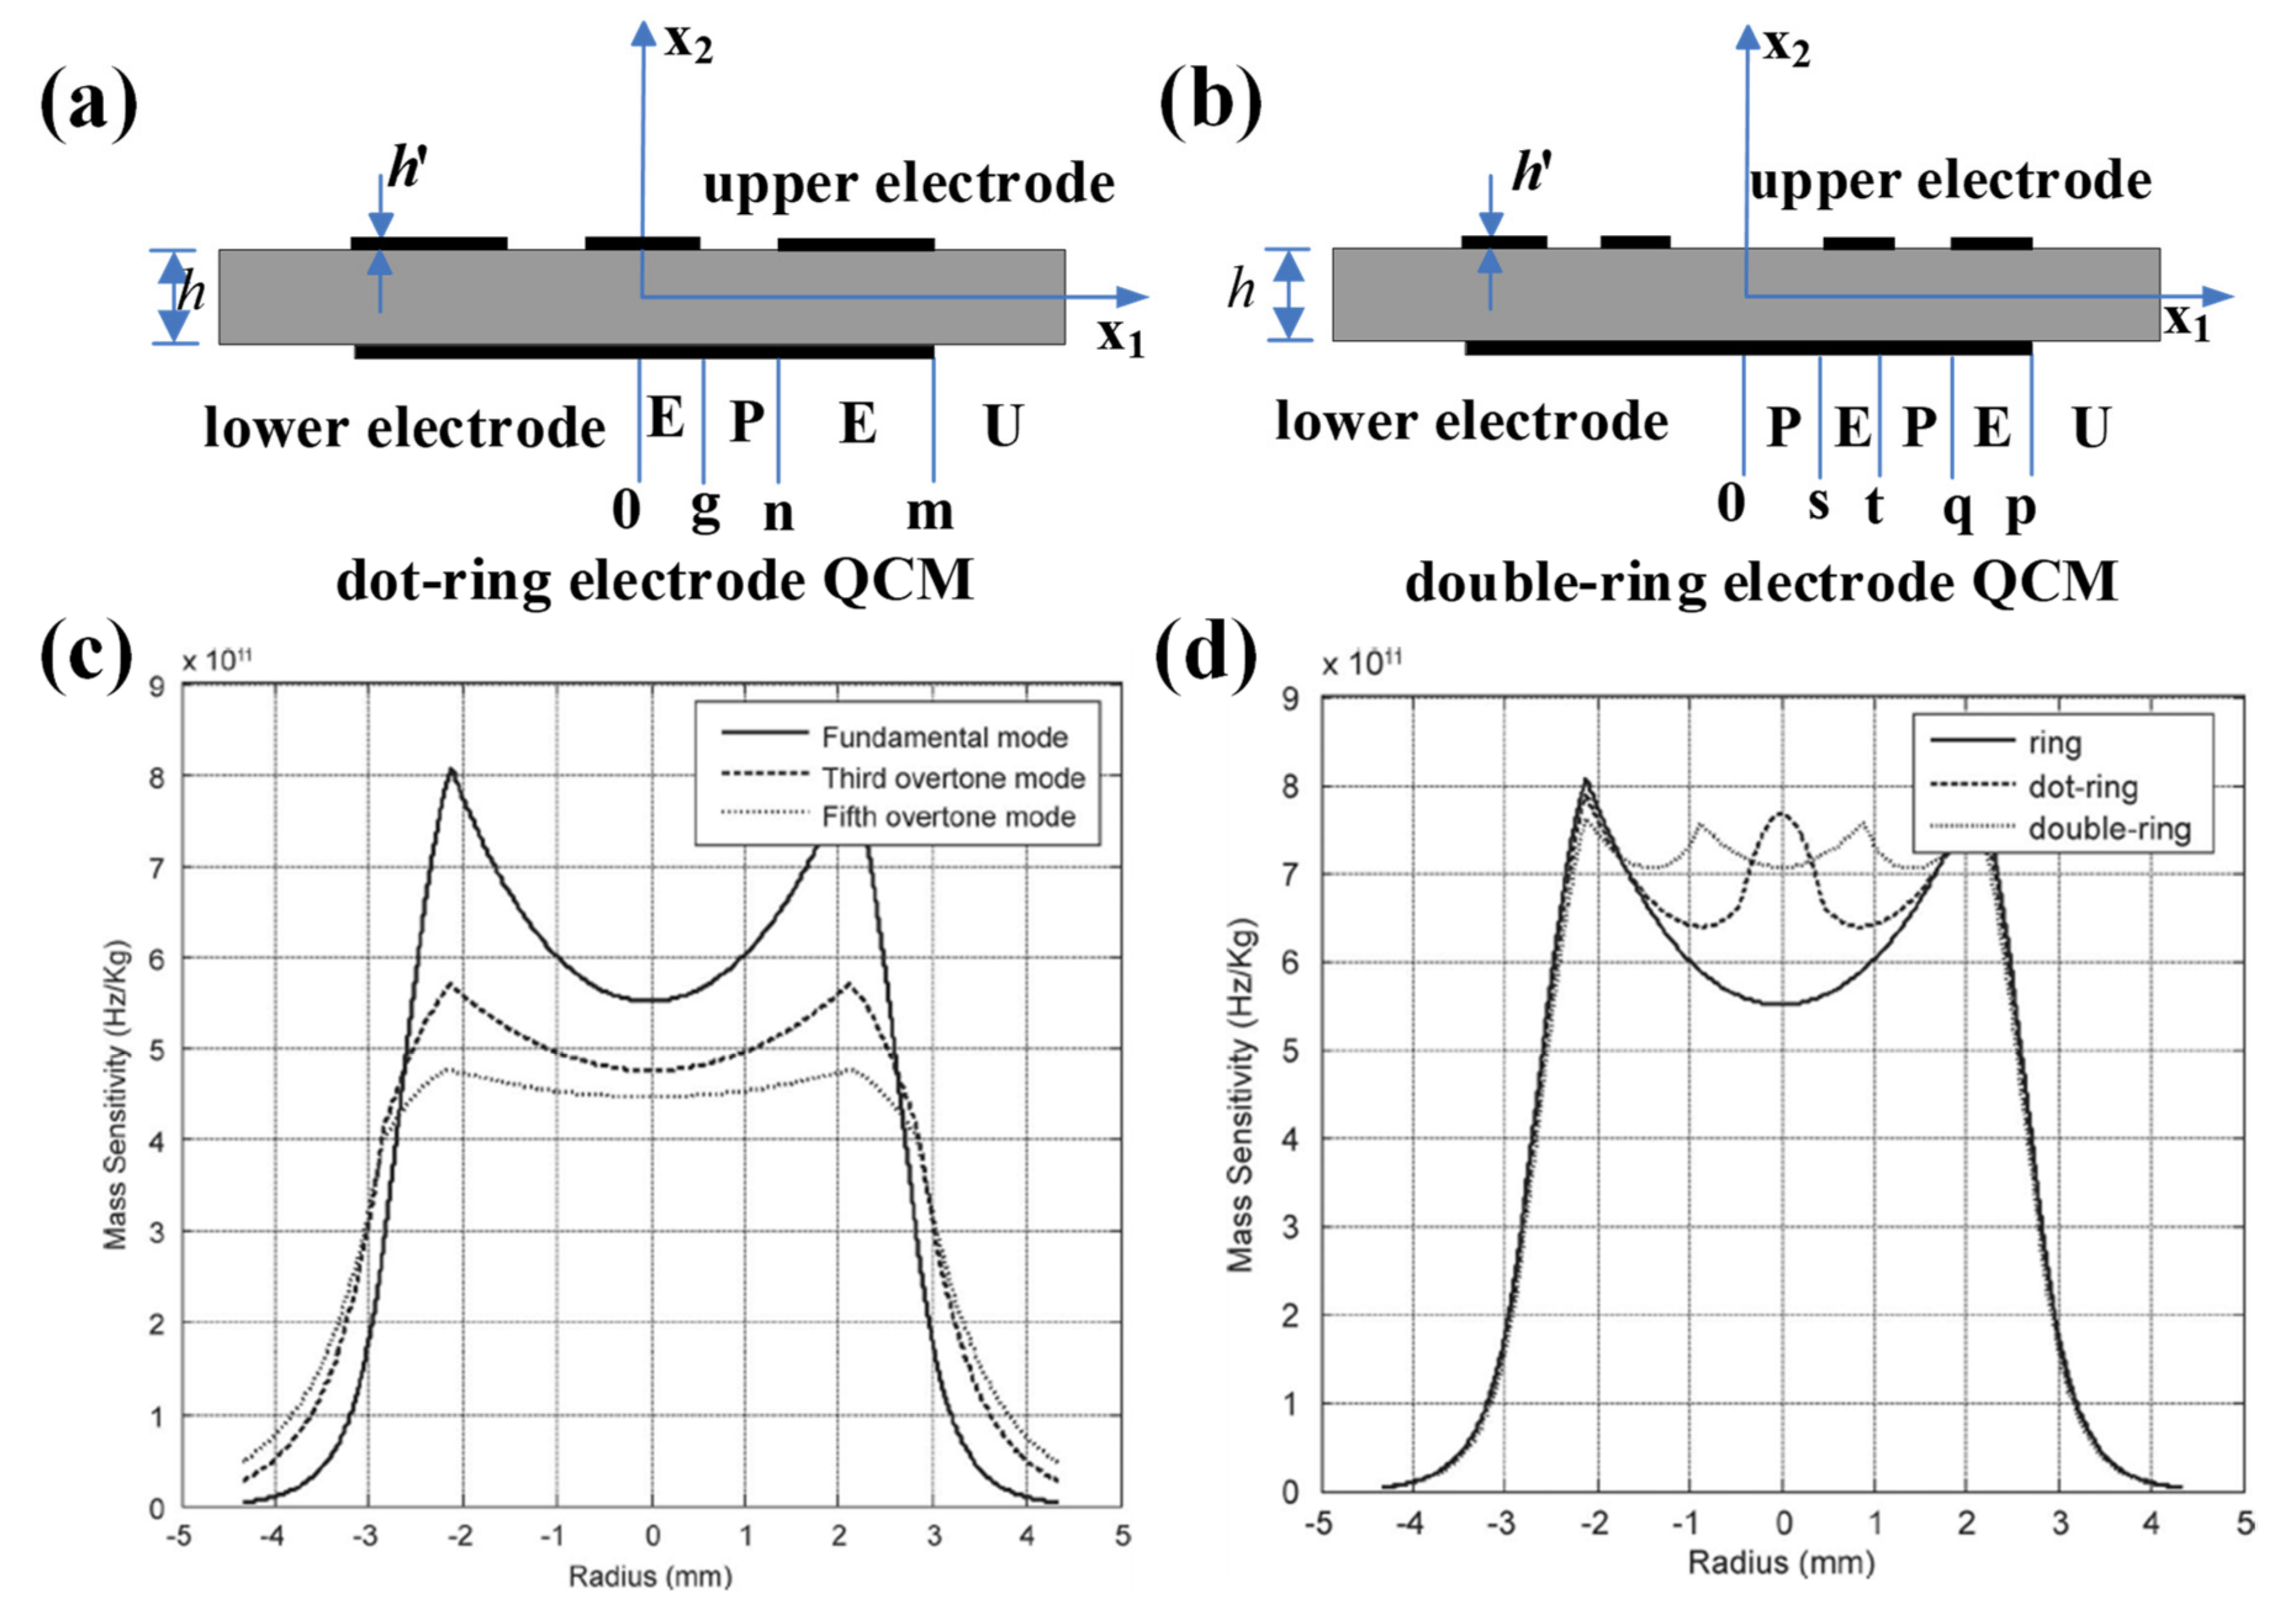
Figure 3. Schematic diagram of the structure of the (a) dot-ring electrode QCM and (b) double-ring electrode QCM. Mass sensitivity distribution for (c) ring electrode QCMs with fundamental, third overtone, and fifth overtone operating frequencies of 10 MHz. (d) Ring, dot-ring, and double-ring electrode quartz crystal resonators with fundamental operating frequencies of 10 MHz [45]. Here, g, n, and m denote the radius of the center dot and the inner and outer radii of the outer ring for the dot-ring electrode QCM, respectively. s, t, q, and p denote the inner and outer radii of the inner ring and the inner and outer radii of the outer ring for the double ring electrode QCM, respectively.
Based on Gao et al., other additional configurations of electrode shapes have been designed to obtain uniform mass sensitivity distribution [44][46][47][48]. For example, Jiang et al. used mathematical models and the finite element method (FEM) to further analyze in depth the mass sensitivity function distribution of the double-ring electrode QCM [47]. Through theoretical calculations and finite element simulations, they found that the mass sensitivity distribution of the double-ring electrode QCM varies with the electrode sizes s, t, n, and m. The average mass sensitivity of the double-ring electrode QCM was at its maximum and most uniformly distributed in this simulation when the size of s is close to half of n. This conclusion also applies when the value of t is close to half of m. Moreover, when the size of the electroded region is larger than the size of the partial electroded region (within the limit), the average mass sensitivity value will increase. In addition, there exists an optimal electrode outer radius with a more uniform displacement distribution for the double-ring electrode QCM. Soon after, they continued to investigate the distribution of the uniform mass sensitivity function of the ellipsoidal electrode QCM, as shown in Figure 4 [48]. Their results show that in order to achieve the uniformity of the mass sensitivity of the elliptical ring electrode QCM, it is recommended that the ratio of the short axis to the long axis of the elliptical ring electrode should be 0.8. In addition, by selecting the appropriate parameters, a more uniform mass sensitivity function can be obtained for the elliptical double ring electrode QCMs.
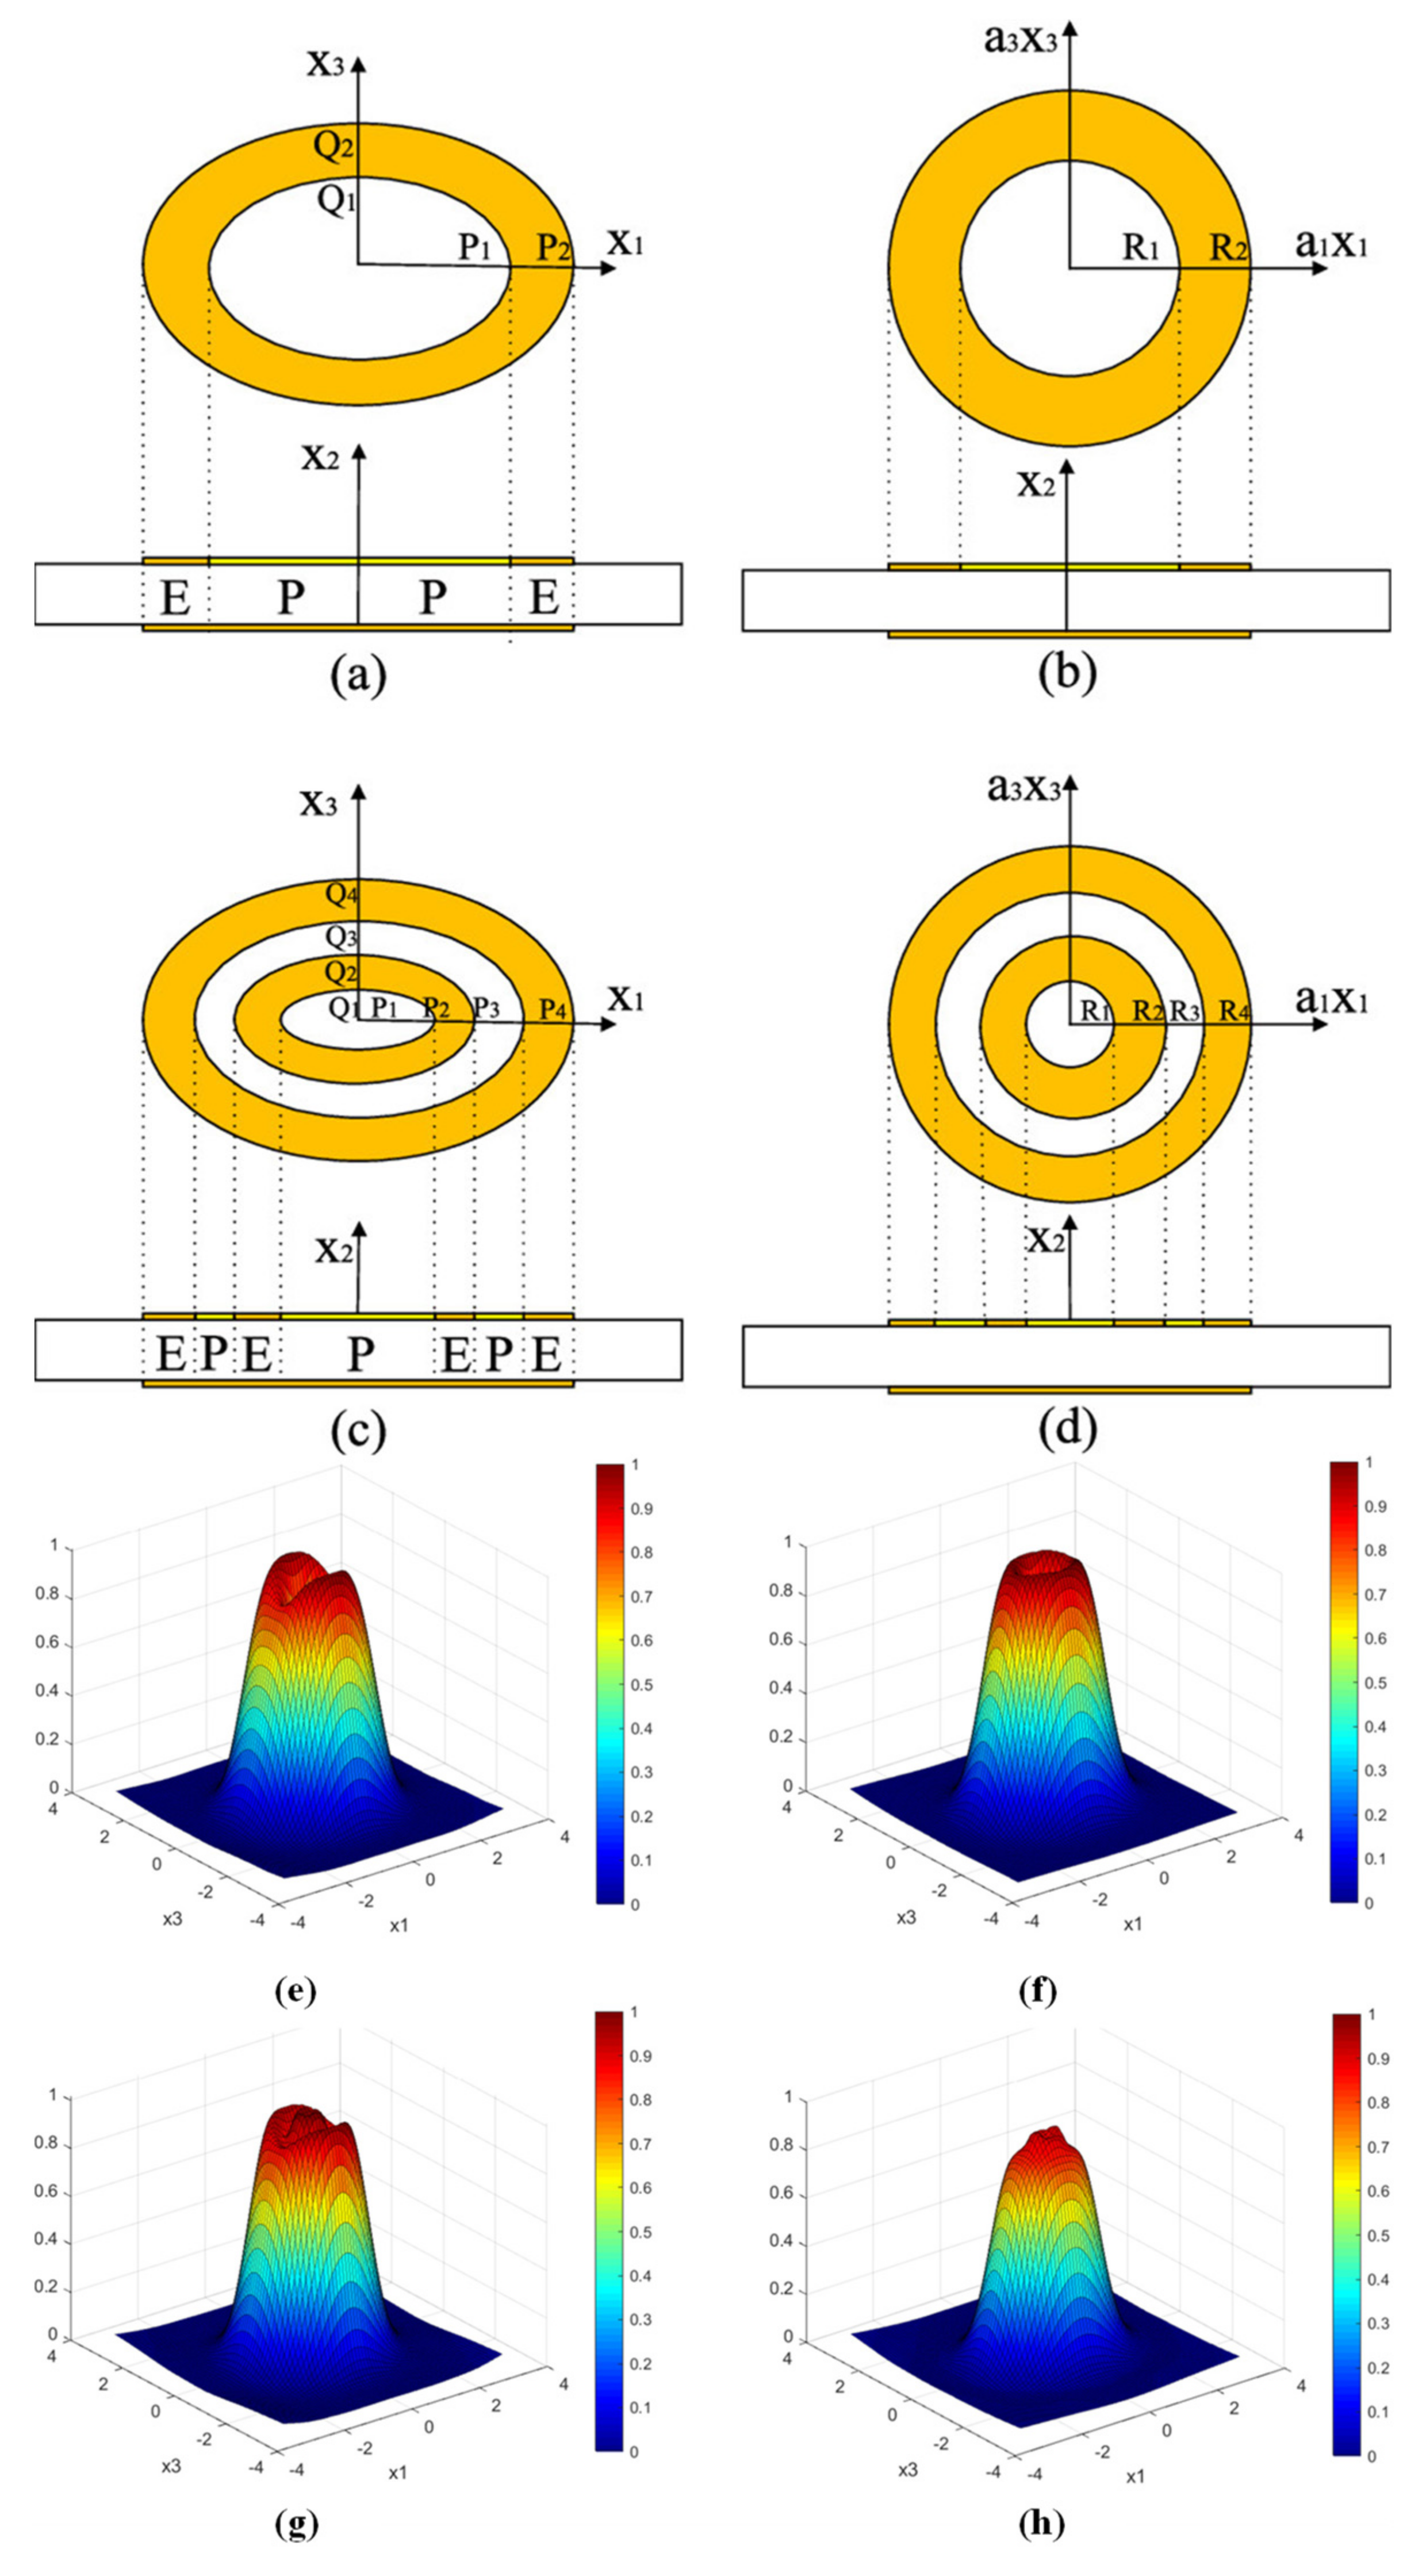
Figure 4. Structure of QCM with (a) elliptical single ring, (b) circular ring, (c) elliptical double ring, and (d) circular double ring electrodes. R1, R2, R3, and R4 are the radii of each circular electrode, respectively, and P1, P2, P3, and P4 are the major semi-axes of each elliptical electrode, respectively. Q1, Q2, Q3, and Q4 are the short semi-axes of each elliptical electrode, respectively. Surface displacement distribution of (e) circular single-ring electrode QCM, (f) elliptical single-ring electrode QCM, (g) circular double-ring electrode QCM, and (h) elliptical double-ring electrode QCM [48].
However, the mentioned electrode shapes are too complicated to process and are not conducive to practical use. Therefore, the mass sensitivity distributions of these QCMs with different electrode shapes have not been experimentally verified. In 2018, through theoretical calculation analysis, Huang et al. found that beyond the electrode mass loading factor, the inner and outer diameters of the ring electrode also have a significant effect on the mass sensitivity distribution of the ring electrode QCMs [41][49][50][51]. They concluded that uniform mass sensitivity distribution can be obtained with a ring electrode QCM when satisfying conditions of a suitable (1) ratio of inner and outer diameters; (2) inner diameter value; and (3) electrode thickness (depending on the mass loading factor). Take the AT-cut 10 MHz ring electrode QCM with inner and outer diameters of 2 and 5 mm, respectively, as an example, shown in Figure 5a. When the electrode material was gold, a mass loading factor of 0.0044 was suggested to obtain uniform mass sensitivity. For a silver electrode, the mass loading factor should be 0.0033. The theoretical calculation results are shown in Figure 5b. Finally, they demonstrated that mass sensitivity distribution was approximately uniform using the coating experiment.

Figure 5. (a) The angled view (upper) and profile map (lower) of the ideal ring electrode QCM, where t1 is the thickness of the electrode and d1 and d2 are the outer and inner diameters of electrode, respectively. (b) The ring-electrode on the topside (upper) and circle-electrode on the backside (lower) of actual ring electrode QCM. (c) Mass sensitivity distribution of AT-cut 10 MHz ring electrode QCM having inner and outer diameters of 2 and 5 mm, respectively [49][50].
This entry is adapted from the peer-reviewed paper 10.3390/s22145112
References
- Ji, Y.; Yin, Z.-W.; Yang, Z.; Deng, Y.-P.; Chen, H.; Lin, C.; Yang, L.; Yang, K.; Zhang, M.; Xiao, Q.; et al. From bulk to interface: Electrochemical phenomena and mechanism studies in batteries via electrochemical quartz crystal microbalance. Chem. Soc. Rev. 2021, 50, 10743–10763.
- Sauerbrey, G. Verwendung von Schwingquarzen zur Wägung dünner Schichten und zur Mikrowägung. Z. Phys. 1959, 155, 206–222.
- Mecea, V.M. From quartz crystal microbalance to fundamental principles of mass measurements. Anal. Lett. 2005, 38, 753–767.
- Chen, Q.; Huang, X.; Yao, Y.; Luo, K.; Pan, H.; Wang, Q. Ringed Electrode Configuration Enhances the Sensitivity of QCM Humidity Sensor Based on Lignin Through Fringing Field Effect. IEEE Sens. J. 2021, 21, 22450–22458.
- Pascal Delannoy, F.; Sorli, B.; Boyer, A. Quartz Crystal Microbalance (QCM) used as humidity sensor. Sens. Actuators A Phys. 2000, 84, 285–291.
- Fauzi, F.; Rianjanu, A.; Santoso, I.; Triyana, K. Gas and humidity sensing with quartz crystal microbalance (QCM) coated with graphene-based materials—A mini review. Sens. Actuators A Phys. 2021, 330, 112837.
- Chen, Q.; Yao, Y.; Huang, X.-h.; Liu, D.; Mao, K.-l. Simulation analysis and experimental verification for sensitivity of IDE-QCM humidity sensors. Sens. Actuators B Chem. 2021, 341, 129992.
- Bruckenstein, S.; Shay, M. Experimental aspects of use of the quartz crystal microbalance in solution. Electrochim. Acta 1985, 30, 1295–1300.
- Kumar, A.; Prajesh, R. The potential of acoustic wave devices for gas sensing applications. Sens. Actuators A Phys. 2022, 339, 113498.
- Liao, S.; Ye, P.; Chen, C.; Zhang, J.; Xu, L.; Tan, F. Comparing of Frequency Shift and Impedance Analysis Method Based on QCM Sensor for Measuring the Blood Viscosity. Sensors 2022, 22, 3804.
- Stephens, J.B.; Lave, E.G. Quartz Crystal Microbalances to Measure Wind Velocity and Air Humidity; NASA: Washington, DC, USA, 1975.
- Lu, C.; Czanderna, A.W. Applications of Piezoelectric Quartz Crystal Microbalances; Elsevier: Amsterdam, The Netherlands, 1984; Volume 7.
- Kanazawa, K.K.; Gordon, J.G. The oscillation frequency of a quartz resonator in contact with liquid. Anal. Chim. Acta 1985, 175, 99–105.
- Kanazawa, K.K.; Gordon, J.G. Frequency of a quartz microbalance in contact with liquid. Anal. Chem. 1985, 57, 1770–1771.
- Martin, B.A.; Hager, H.E. Flow profile above a quartz crystal vibrating in liquid. J. Appl. Phys. 1989, 65, 2627–2629.
- Kurosawa, S.; Tawara, E.; Kamo, N.; Ohta, F.; Hosokawa, T. Latex piezoelectric immunoassay: Detection of agglutination of antibody-bearing latex using a piezoelectric quartz crystal. Chem. Pharm. Bull. 1990, 38, 1117–1120.
- Rodahl, M.; Höök, F.; Krozer, A.; Brzezinski, P.; Kasemo, B. Quartz crystal microbalance setup for frequency and Q-factor measurements in gaseous and liquid environments. Rev. Sci. Instrum. 1995, 66, 3924–3930.
- Höök, F.; Ray, A.; Nordén, B.; Kasemo, B. Characterization of PNA and DNA immobilization and subsequent hybridization with DNA using acoustic-shear-wave attenuation measurements. Langmuir 2001, 17, 8305–8312.
- Huang, M.H.; Wu, Y.; Feick, H.; Tran, N.; Weber, E.; Yang, P. Catalytic growth of zinc oxide nanowires by vapor transport. Adv. Mater. 2001, 13, 113–116.
- Gagliardi, M.; Tori, G.; Agostini, M.; Lunardelli, F.; Mencarelli, F.; Sanmartin, C.; Cecchini, M. Detection of Oenological Polyphenols via QCM-D Measurements. Nanomaterials 2022, 12, 166.
- Spagnolo, S.; Muckley, E.S.; Ivanov, I.N.; Hianik, T. Application of Multiharmonic QCM-D for Detection of Plasmin at Hydrophobic Surfaces Modified by β-Casein. Chemosensors 2022, 10, 143.
- Thompson, M.; Kipling, A.L.; Duncan-Hewitt, W.C.; Rajaković, L.V.; Čavić-Vlasak, B.A. Thickness-shear-mode acoustic wave sensors in the liquid phase. A review. Analyst 1991, 116, 881–890.
- Mujahid, A.; Afzal, A.; Dickert, L.F. An Overview of High Frequency Acoustic Sensors—QCMs, SAWs and FBARs—Chemical and Biochemical Applications. Sensors 2019, 19, 4395.
- Dirri, F.; Palomba, E.; Longobardo, A.; Zampetti, E.; Saggin, B.; Scaccabarozzi, D. A review of quartz crystal microbalances for space applications. Sens. Actuators A Phys. 2019, 287, 48–75.
- Akgönüllü, S.; Özgür, E.; Denizli, A. Recent Advances in Quartz Crystal Microbalance Biosensors Based on the Molecular Imprinting Technique for Disease-Related Biomarkers. Chemosensors 2022, 10, 106.
- Alassi, A.; Benammar, M.; Brett, D. Quartz Crystal Microbalance Electronic Interfacing Systems: A Review. Sensors 2017, 17, 2799.
- Warner, A.W. High-frequency crystal units for primary frequency standards. Proc. IRE 1952, 40, 1030–1033.
- Vig, J.R.; Walls, F.L. A review of sensor sensitivity and stability. In Proceedings of the 2000 IEEE/EIA International Frequency Control Symposium and Exhibition, Kansas City, MO, USA, 9 June 2000; pp. 30–33.
- Vig, J.R.; Filler, R.L.; Kim, Y. Chemical sensor based on quartz microresonators. JMemS 1996, 5, 138–140.
- Bottom, V.E. Studies of the deterioration of quartz crystal units with special reference to the effects of temperature and humidity on the quartz plate and holder-techniques for fabrication stable crystal units. In Proceedings of the Chicago Crystal Conference, 11–12 July 1944; pp. 26–30. Available online: https://ieee-uffc.org/files/ieeeuffcorg/2021-09/Proceedings%20of%20Chicago%20Crystal%20Conference.pdf (accessed on 5 June 2022).
- Huang, X.; Bai, Q.; Hu, J.; Hou, D. A practical model of quartz crystal microbalance in actual applications. Sensors 2017, 17, 1785.
- Huang, X.; Chen, Q.; Pan, W.; Hu, J.; Yao, Y. Assessing the mass sensitivity for different electrode materials commonly used in quartz crystal microbalances (QCMs). Sensors 2019, 19, 3968.
- Chen, Q.; Huang, X.; Pan, W.; Xu, Y.; Fan, Z. Investigation on mass sensitivity of n-m type electrode quartz crystal microbalance. Sensors 2019, 19, 2125.
- Hillier, A.C.; Ward, M.D. Scanning electrochemical mass sensitivity mapping of the quartz crystal microbalance in liquid media. Anal. Chem. 1992, 64, 2539–2554.
- Ward, M.D.; Delawski, E.J. Radial mass sensitivity of the quartz crystal microbalance in liquid media. Anal. Chem. 1991, 63, 886–890.
- Yang, L.; Huang, X.H. Response of quartz crystal microbalance loaded with single-drop liquid in gas phase. Open Electr. Electron. Eng. J. 2014, 8, 197–201.
- Bai, Q.; Huang, X. Using quartz crystal microbalance for field measurement of liquid viscosities. J. Sens. 2016, 2016, 7580483.
- Martin, S.J.; Granstaff, V.E.; Frye, G.C. Characterization of a quartz crystal microbalance with simultaneous mass and liquid loading. Anal. Chem. 1991, 63, 2272–2281.
- Josse, F.; Lee, Y.; Martin, S.J.; Cernosek, R.W. Analysis of the radial dependence of mass sensitivity for modified-electrode quartz crystal resonators. Anal. Chem. 1998, 70, 237–247.
- Cumpson, P.J.; Seah, M.P. The quartz crystal microbalance; radial/polar dependence of mass sensitivity both on and off the electrodes. Meas. Sci. Technol. 1990, 1, 544–555.
- Chen, Q.; Huang, X.; Pan, W.; Fu, W. Implementation of QCM with uniform mass sensitivity distribution. In Proceedings of the 2020 Joint Conference of the IEEE International Frequency Control Symposium and International Symposium on Applications of Ferroelectrics (IFCS-ISAF), Keystone, CO, USA, 19–23 July 2020; pp. 1–3.
- Richardson, A.; Bhethanabotla, V.R.; Smith, A.L.; Josse, F. Patterned electrodes for thickness shear mode quartz resonators to achieve uniform mass sensitivity distribution. IEEE Sens. J. 2009, 9, 1772–1777.
- Richardson, A.; Bhethanabotla, V.R.; Smith, A.L.; Josse, F. Patterned electrodes for thickness shear mode quartz resonators to achieve uniform mass sensitivity distribution. In Proceedings of the SENSORS, 2008 IEEE, Lecce, Italy, 26–29 October 2008; pp. 1206–1209.
- Shi, J.; Fan, C.; Zhao, M.; Yang, J. Thickness-shear vibration characteristics of an AT-cut quartz resonator with rectangular ring electrodes. IJApE 2016, 51, 1–10.
- Gao, J.; Huang, X.; Wang, Y. The modified design of ring electrode quartz crystal resonator for uniform mass sensitivity distribution. IEEE Trans. Ultrason. Ferroelectr. Freq. Control 2013, 60, 2031–2034.
- Pan, W.; Huang, X.; Chen, Q. Analysis of the Uniformization of the QCM Mass Sensitivity Distribution through a Dot Multiring Electrode Structure. Anal. Chem. 2021, 93, 16828–16834.
- Jiang, H.; Tang, L. Uniformization of QCM’s mass sensitivity distribution by optimizing its metal electrode configurations. IEEE Sens. J. 2021, 21, 9008–9015.
- Jiang, H.; Tang, L. Uniform Mass Sensitivity Distribution of Elliptically Designed Electrodes Based on a Quartz Crystal Microbalance. ACS Omega 2021, 6, 32917–32924.
- Pan, W.; Huang, X.; Chen, Q. Uniformization of mass sensitivity distribution of silver electrode QCM. IEEE Trans. Ultrason. Ferroelectr. Freq. Control 2020, 67, 1953–1956.
- Huang, X.; Bai, Q.; Pan, W.; Hu, J. Quartz crystal microbalance with approximately uniform sensitivity distribution. Anal. Chem. 2018, 90, 6367–6370.
- Huang, X. A Quartz Crystal Microbalance Mass Sensor with Uniform Mass Sensitivity. CN201,810,308,560.1, 18 April 2018.
This entry is offline, you can click here to edit this entry!