Your browser does not fully support modern features. Please upgrade for a smoother experience.
Please note this is an old version of this entry, which may differ significantly from the current revision.
Subjects:
Engineering, Biomedical
Aptamers are a particular class of functional recognition ligands with high specificity and affinity to their targets. As the candidate recognition layer of biosensors, aptamers can be used to sense biomolecules. Aptasensors, aptamer-based biosensors, have been demonstrated to be specific, sensitive, and cost-effective. Furthermore, smartphone-based devices have shown their advantages in binding to aptasensors for point-of-care testing (POCT), which offers an immediate or spontaneous responding time for biological testing.
- aptamer
- smartphone
- POCT
2.1. Metal Ions Detection
Heavy metals are non-biodegradable and ubiquitously distributed in the biosphere with a highly toxic property [41]. Heavy metal ions discharged into the environment from household and industrial wastewater are likely to accumulate in living organisms through the alimentary canal, thereby harming human health [42,43]. Therefore, developing a fast and sensitive heavy metal ions detection method is very urgent and essential.
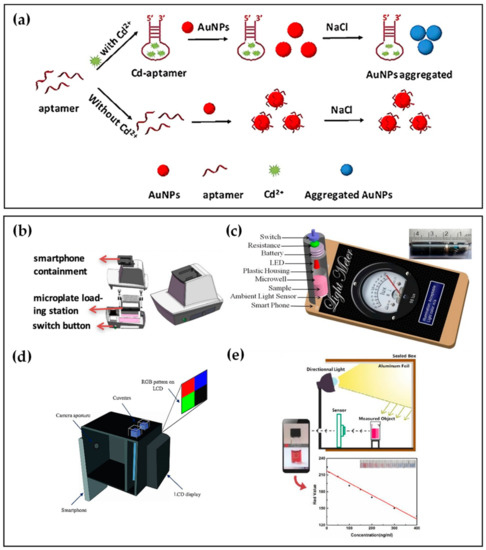
Many studies have reported the detection of heavy metal ions such as Cd2+ and Hg2+ based on their specific aptamers [44,45,46,47]. For Cd2+ detection, Wu et al. [44] presented a SELEX strategy for selecting Cd2+ aptamers and further adopted the selected aptamer as a recognition molecule to obtain the colorimetric detection of Cd2+. To improve the convenience and rapidity of detection, Gan et al. [48] introduced a smartphone-based colorimetric system to detect Cd2+. As shown in Figure 1a, in the presence of Cd2+, Cd-aptamers tend to combine with Cd2+ rather than gold nanoparticles(AuNPs), causing the dispersion of AuNPs. After adding NaCl solution, the AuNPs could aggregate to a different degree due to the number difference of bare AuNPs, making the solution changeable in color. While, in the absence of Cd2+ in the sample, aptamers immobilized on the AuNPs protected AuNPs from aggregation under NaCl conditions. Hence, the color of the last reaction solution changed from red to purple and finally to gray as the Cd2+ concentration increased. As shown in Figure 1b, a self-developed smartphone-based colorimetric system was used to capture the colorimetric image of a 96-well microplate, extract the pixel of the image, and then analyze the image data by the image processing algorithm. At last, the concentrations of Cd2+ in the sample were calculated by comparison with the colorimetric response standard curve of the Cd2+-spiked tap water sample. The linear range of Cd2+ was 2–20 μg/L, while the limit of detection (LOD) was 1.12 ug/L, showing a high selectivity and sensitivity of the smartphone-based colorimetric system.

Figure 1. (a) Colorimetric detection principle based on AuNPs. (b) Schematic illustration of the smartphone-based colorimetric system. (c) Optical microwell reader picture and schematic of a microwell reader mounted on an Android smartphone. (d) Schematic of the designed smartphone-based colorimeter. (e) Schematic illustration and the standard curve with different Cd2+ concentrations using the proposed smartphone-based colorimetric method.
Employing the same colorimetry principle based on the color change of AuNPs after adding NaCl solution, Xiao et al. [49] and Sajed et al. [50] proposed distinct smartphone-based aptasensors to detect Hg2+ or Cd2+. As depicted in Figure 1c, Xiao et al. [49] designed a microwell reader consisting of a resistor, a 520 nm light-emitting diode (LED), and a microwell to detect Hg2+. The microwell reader containing the sample was positioned on the top of the ambient light sensor. Following pressing the switch to form exciting light, the transmitted light intensity data were recorded and displayed on the light meter app, and the concentrations of Hg2+ were determined with the linear range of 1–32 ng/mL, and the LOD of 0.28 ng/mL in both Pearl River water and tap water samples.
Subsequently, Sajed [50] et al. used colorimetry at multiple points of the visible spectrum (470, 540, 640 nm). The group fabricated a gadget using three-dimensional printing technology applicable to any type of smartphone and integrated it with optical components, as revealed in Figure 1d. The gadget consisted of a thin film transistor liquid crystal display (TFTLED) board chamber, a focusing chamber of the camera, and two cuvette chambers containing the reference solution and the sample solution. A full-color TFTLCD was adopted as the light source, providing a uniform irradiance condition with any predefined pattern. Hg2+ concentration was estimated using multiple linear regression (MLR), a statistical technique for analyzing the connection between a dependent variable and multiple independent variables. In the MLR model, red, green, and blue (RGB) values extracted from images of samples by smartphone were applied as the input, while the concentration of Hg2+ in the sample was applied as the regression target. Light source enhancement, RGB analysis, and a novel image processing protocol make it possible to achieve an excellent level of sensitivity (1 nM).
Apart from NaCl solution, polydiene dimethyl ammonium chloride (PDDA) also leads to the aggregation of AuNPs, which can make the color of the response solution shift reported by Xu et al. [51]. The aptasensor combined with smartphone colorimetry to detect Cd2+ based on an aptamer competitive binding assay of PDDA and Cd2+. The directional light on the sealed box is reflected on the measured object by aluminum foil, as shown in Figure 1e. The images of samples were captured by smartphone, and a ColorAssist app read the RGB values. The linear correlation between Cd2+ concentration and red value (R-value) was plotted in Figure 1e, with a linear range of 1–400 ng/mL. The aptasensor of this work showed the potential for practical application as its results were in accordance with those from the atomic absorption spectrometer.
2. Small Molecules Detection
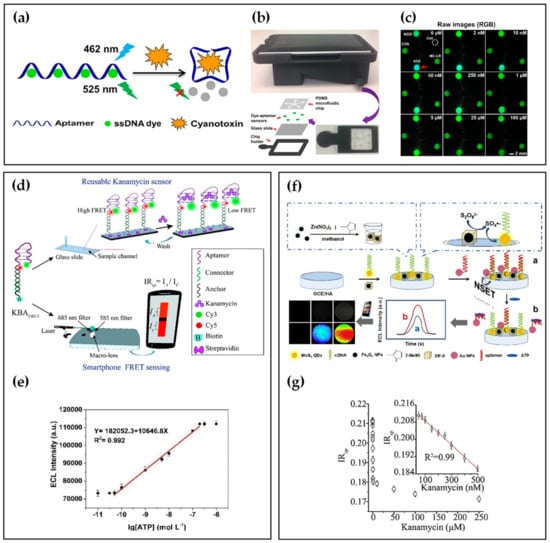
Many studies have reported small-molecule assays based on specific aptamers, such as cyanotoxin [52,53,54], kanamycin [55,56,57], and ATP [58]. In recent years, with an emphasis on POCT detection, many researchers have combined aptamer and smartphones to identify small molecules. Table 1 summarizes small-molecule detection using smartphone-based aptasensors. For example, Li et al. [59] developed an easy-to-use and miniaturized detector, using a fluorescent aptasensor array composed of specific aptamers and dyes for the multiplexed detection of four common cyanotoxins as environmentally hazardous substances. As shown in Figure 2a, a blue 462 nm laser illuminates single-stranded DNA (ssDNA) dyes without cyanotoxins, and the green fluorescence decreases upon adding analyte solutions, resulting from aptamer conformational changes. The authors also developed a smartphone-based fluorescence readout platform that integrated a microfluidic chip where the aptamer binding assays occurred with a 3D-printed attachment (Figure 2b). The emitted green fluorescence from the microfluidic chip was filtrated by a filter in the attachment and detected by the smartphone camera. In the raw images, the fluorescent intensity of the reaction was reversely proportional to the concentration of anatoxin-a (ATX). At the same time, the other four areas did not show any distinct changes in fluorescence signals, which certified the high specificity of aptamers (Figure 2c). As a result, the smartphone-based sensor platform realized accurate detection and measurement of four common cyanotoxin species, with the LOD lower than 3 nM, in parallel.
In addition to the change in intensity of single-color fluorescence, the analytes can be detected by the signal conversion of two-color fluorescence. Saurabh et al. [60] demonstrated ratiometric Förster resonance energy transfer (FRET) between fluorescent dye pairs on aptamers for rapid-response and sensitive kanamycin detection. As depicted in Figure 2d, the upper half of dye-labeled kanamycin DNA aptamer (KBA) is the kanamycin binding aptamer, while the bottom is double-stranded DNA used for surface modification of glass slide. When kanamycin was bound to KBAFRET, KBA displayed a lower level of FRET efficiency due to the unique placement of a donor-acceptor dye pair. The ratiometric FRET-based estimation could be implemented on a custom-made smartphone-based fluorescence setup with a LOD of 28 nM (Figure 2e).
Another energy transfer model superior to FRET is nanometal surface energy transfer (NSET), which has a higher energy transfer efficiency and a more extended energy transfer distance than dipole-dipole FRET [61,62]. Employing the NSET strategy, Nie et al. [63] developed an electrochemiluminescence (ECL) biosensor for point-of-care detection of ATP. As shown in Figure 2f, Fe3O4 NP@ZIF-8 was used as an effective catalyst, and its poor electron transfer capabilities could not influence the other reagents. MoS2 QDs produced NSET with AuNPs by the specific binding of cDNA and ATP aptamer, which decreased the ECL signal of MoS2 QDs. When ATP bound to the aptamer, the ECL-NSET system was deconstructed, resulting in the recovery of the ECL signal. Furthermore, a self-developed software for smartphones could capture changes in the ECL signal, which achieved point-of-care detection of ATP with a LOD of 0.015 nmol L−1 (Figure 2g).
Table 1. A summary of small-molecule detection using smartphone-based aptasensors.
| Target Analyte | Detection Probe | Detection Method | LOD | Reference |
|---|---|---|---|---|
| Cyanotoxins | aptamer−dye | Fluorescence detection | <3 nM | [59] |
| Kanamycin | aptamer-dyes | Fluorescence detection | 28 nM | [60] |
| ATP | aptamer-MoS2 QD | Electrochemiluminescence | 0.015 nmol L−1 | [63] |
| ATP | aptamer-Fe(CN)63− | Colorimetry | NR | [64] |
| Mycotoxin | aptamer−dyes | Fluorescence detection | 0.1 ng/mL | [65] |
| Chloramphenicol | AuNPs-aptamer | Colorimetry | 5.88 nM | [66] |
| 17-β-estradiol | dye-split aptamer fluorescent beads | Fluorescence detection | 1 pg/mL (in spiked wastewater samples) | [67] |
| Streptomycin | aptamer−dye | Fluorescence analysis | 94 nM | [68] |
| Streptomycins | AuNPs-aptamer | Colorimetry | 12.3 nM | [69] |
| Ibuprofen | AuNPs-aptamer | Colorimetry | 1.24 pg/mL (S-Ibu) 3.91 pg/mL (R-Ibu) |
[70] |
| Sulfadimethoxine | AuNPs-aptamer | Colorimetry | 0.023 ppm | [71] |
| Cocaine | AuNPs-aptamer-UCNPs | Luminescence detection | 10 nM (in aqueous solution) 50 nM (in human saliva) | [72] |

Figure 2. (a) Detection theory of the fluorescent aptasensor. (b) Schematic illustration of the smartphone−based fluorescent aptasensor. (c) Raw fluorescence images in response to different concentrations of ATX. (d) Schematic of FRET-based kanamycin aptasensor. (e) Calibration curve for Kanamycin detection. (f) Schematic of the ECL biosensor. (g) Correlation between the ATP concentration and ECL intensity.
3. Nucleic Acids Detection
The principle of detecting nucleic acids using aptamers is complementary base pair, and then specific aptamers can be designed by target sequences [20,73]. MicroRNAs (miRNAs), a kind of nucleic acid, can play as biomarkers of some tumors and cancers [74]. Hence, realizing portable and efficient on-site miRNAs detection is critical for clinical prevention and therapy of many cancer patients [75,76]. Aptasensors for miRNA detection offer higher sensitivity, lower costs, and require less sample than other approaches, opening new possibilities for detecting circulating miRNA in POCT [77,78]. Furthermore, smartphones with portability, high-resolution camera, a global positioning system (GPS), and Internet connection capability can provide healthcare diagnostics in resource-limited circumstances.
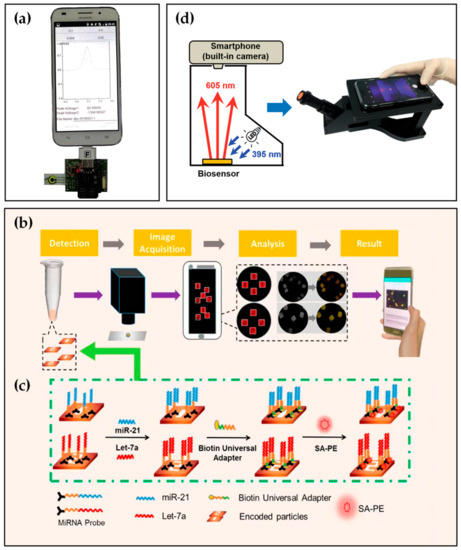
Consequently, the combination of smartphone and molecular diagnostics is particularly critical. Although the achievements in this research direction are relatively few, some progress has been made. For example, in the study presented by Shin Low et al. [20], aptamer appeared as a complementary strand of miR-21 binding with each other by complementary base pairs. Then, circulating miR-21 was detected in saliva using a smartphone-based biosensing system. The system consisted of a disposable electrochemical aptasensor, a self-designed circuit board, a smartphone with Bluetooth function, and a specially developed Android application (Figure 3a). Furthermore, the biosensing system demonstrated equivalent performance to a commercial electrochemical workstation, suitable selectivity, and an acceptable recovery rate of 96.2% to 107.2% in spiked artificial saliva.

Figure 3. (a) Real image of the smartphone-based electrochemical biosensing system for detection of miR-21. (b,c) Schematic illustration of the miR-21, let-7a simultaneous detection based on aptamer and smartphone. (d) Internal illustration and appearance of self-made equipment with a smartphone.
Tian et al. [79] presented a smartphone-based detection platform for the detection of multiple miRNAs simultaneously. The quantitative detection platform included number-coded hydrogel microparticles, a microscope, and a smartphone with fluorescence image recognition software (Figure 3b). After the reaction shown in Figure 3c, hydrogel microparticles prepared by flow lithography technology displayed different fluorescence intensities. Images were achieved by a smartphone camera and then analyzed by an image processing procedure installed on the smartphone. In this work, the LOD of the detection platform reached the femtomole level in spiked healthy human serum samples, which demonstrated the POCT of tumor biomarkers.
4. Proteins or Glycoproteins Detection
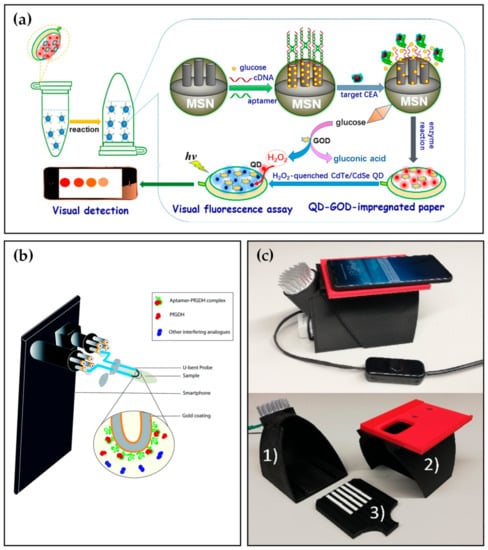
Carcinoembryonic antigen (CEA), a 180 kDa glycoprotein and a tumor biomarker, plays a significant role in predicting, prognosis, and tumor screening of many malignancies [84,85]. The CEA concentration of healthy individuals is less than 5 μg L−1, while patients containing cancer cells are more than 20 μg L−1 in serum [86]. Therefore, a rapid, reliable, and sensitive CEA detection method is of particular need to the public. Shu et al. [87] established an electrochemical aptasensor to detect CEA. Based on the signal amplification of AuNPs, the biosensor demonstrated excellent sensitivity and selectivity toward CEA, which indicated a high potential for practical application. Several years later, combining with a smartphone, Qiu et al. [88] developed a paper-based analytical device (PAD) for the fluorescence detection of CEA. As depicted in Figure 4a, the assay was conducted in a centrifuge tube where glucose molecules were gated into the mesoporous silica nanocontainers (MSNs) with the help of the CEA aptamer. Upon adding the analyte, CEA reacted with aptamers contributing to opening the pore and releasing glucose. The released glucose was catalyzed by glucose oxidase (GOD) immobilized on paper to produce hydrogen peroxide and gluconic acid, which quenched the fluorescence of CdTe/CdSe QDs and then measured by a smartphone and a commercial fluorospectrometer. Under optimal conditions, the system enabled sensitive detection of target CEA with a LOD of 6.7 pg mL−1 in spiked PBS solution, lower than most commercial enzyme-linked immunosorbent assay (ELISA) kits for CEA.
Enzymes, most of which are proteins, can be detected using aptasensor such as Plasmodium falciparum glutamate dehydrogenase (PfGDH) [89,90] and creatine kinase isoenzymes (CK-MB) [91]. To further increase the convenience of detection, Sanjay et al. [92] constructed a multi-channel, smartphone-based optic fiber platform for quantitative detection of PfGDH. As depicted in Figure 4b, the smartphone flashlight and camera were coupled to two ends of optic fiber by a four-channel smartphone accessory. U-bent optic fiber probes were prepared by gold-plating and PfGDH aptamer modification on the surface of plastic optic fibers. After the addition of simulated malaria samples, the images of the light spots were captured by a smartphone camera and analyzed by ImageJ. software. Consequently, the smartphone-based aptasensor exhibited a LOD of 264 pM in spiked buffer and 352 pM in spiked serum. For the CK-MB, Zhang et al. [93] proposed a dual sensitization smartphone colorimetric strategy to detect CK-MB gathering rolling circle amplification (RCA) coils and Au tetrahedra. The platform demonstrated reasonable specificity with a low LOD of 0.8 pM and performed well in spiked human serum samples.
The above reports were all for the detection of a single target, Mahmoud et al. [94] proposed a novel system for the simultaneous determination of two proteins, interleukin-6 (IL-6) and thrombin, using corresponding antibodies and aptamers, respectively. The system was composed of a 3D-printed smartphone imager (Figure 4c) and lateral flow strips modified with QD labels thrombin aptamers [95] and interleukin-6 antibodies. Through RGB channels, colored pictures of lateral flow strips were split to achieve optical multiplexing, which reduced turnaround time. With the LOD of 100 pM for IL-6 and 3 nM for thrombin in spiked buffer solutions, the smartphone-based system was suitable for duplex detection, particularly in low-resource conditions.

Figure 4. (a) Visual fluorescence detection mechanism of CEA biomarker based on paper-based analytical device (PAD). (b) Schematic illustration of the smartphone-based optic fiber platform. (c) Smartphone dark box comprising (1) a bottom part fitted with a UV-LED light source, (2) a lid fitted with a replaceable smartphone adapter, and (3) a sample plate for seven lateral flow strips.
This entry is adapted from the peer-reviewed paper 10.3390/bios12070477
This entry is offline, you can click here to edit this entry!
