The main pollutants in car wash wastewater are detergents, dirt, oil, and grease. Untreated wastewater released into rainwater sewer systems or other water bodies may pollute the water and generate excessive bubble foams, which negatively affects urban appearance. Car washes are divided into mechanical car washes and manual or self-service car washes. In general, car washes have a small operation and scale, occupy limited land, and cannot afford wastewater treatment costs. Therefore, most car washes are not equipped with wastewater treatment facilities. Consequently, the discharge of wastewater from car washes negatively affects the water quality in the surrounding environment and results in wasteful use of water resources.
- carwash
- wastewater
1. Introduction
2. Car Wash Wastewater Treatment Technique
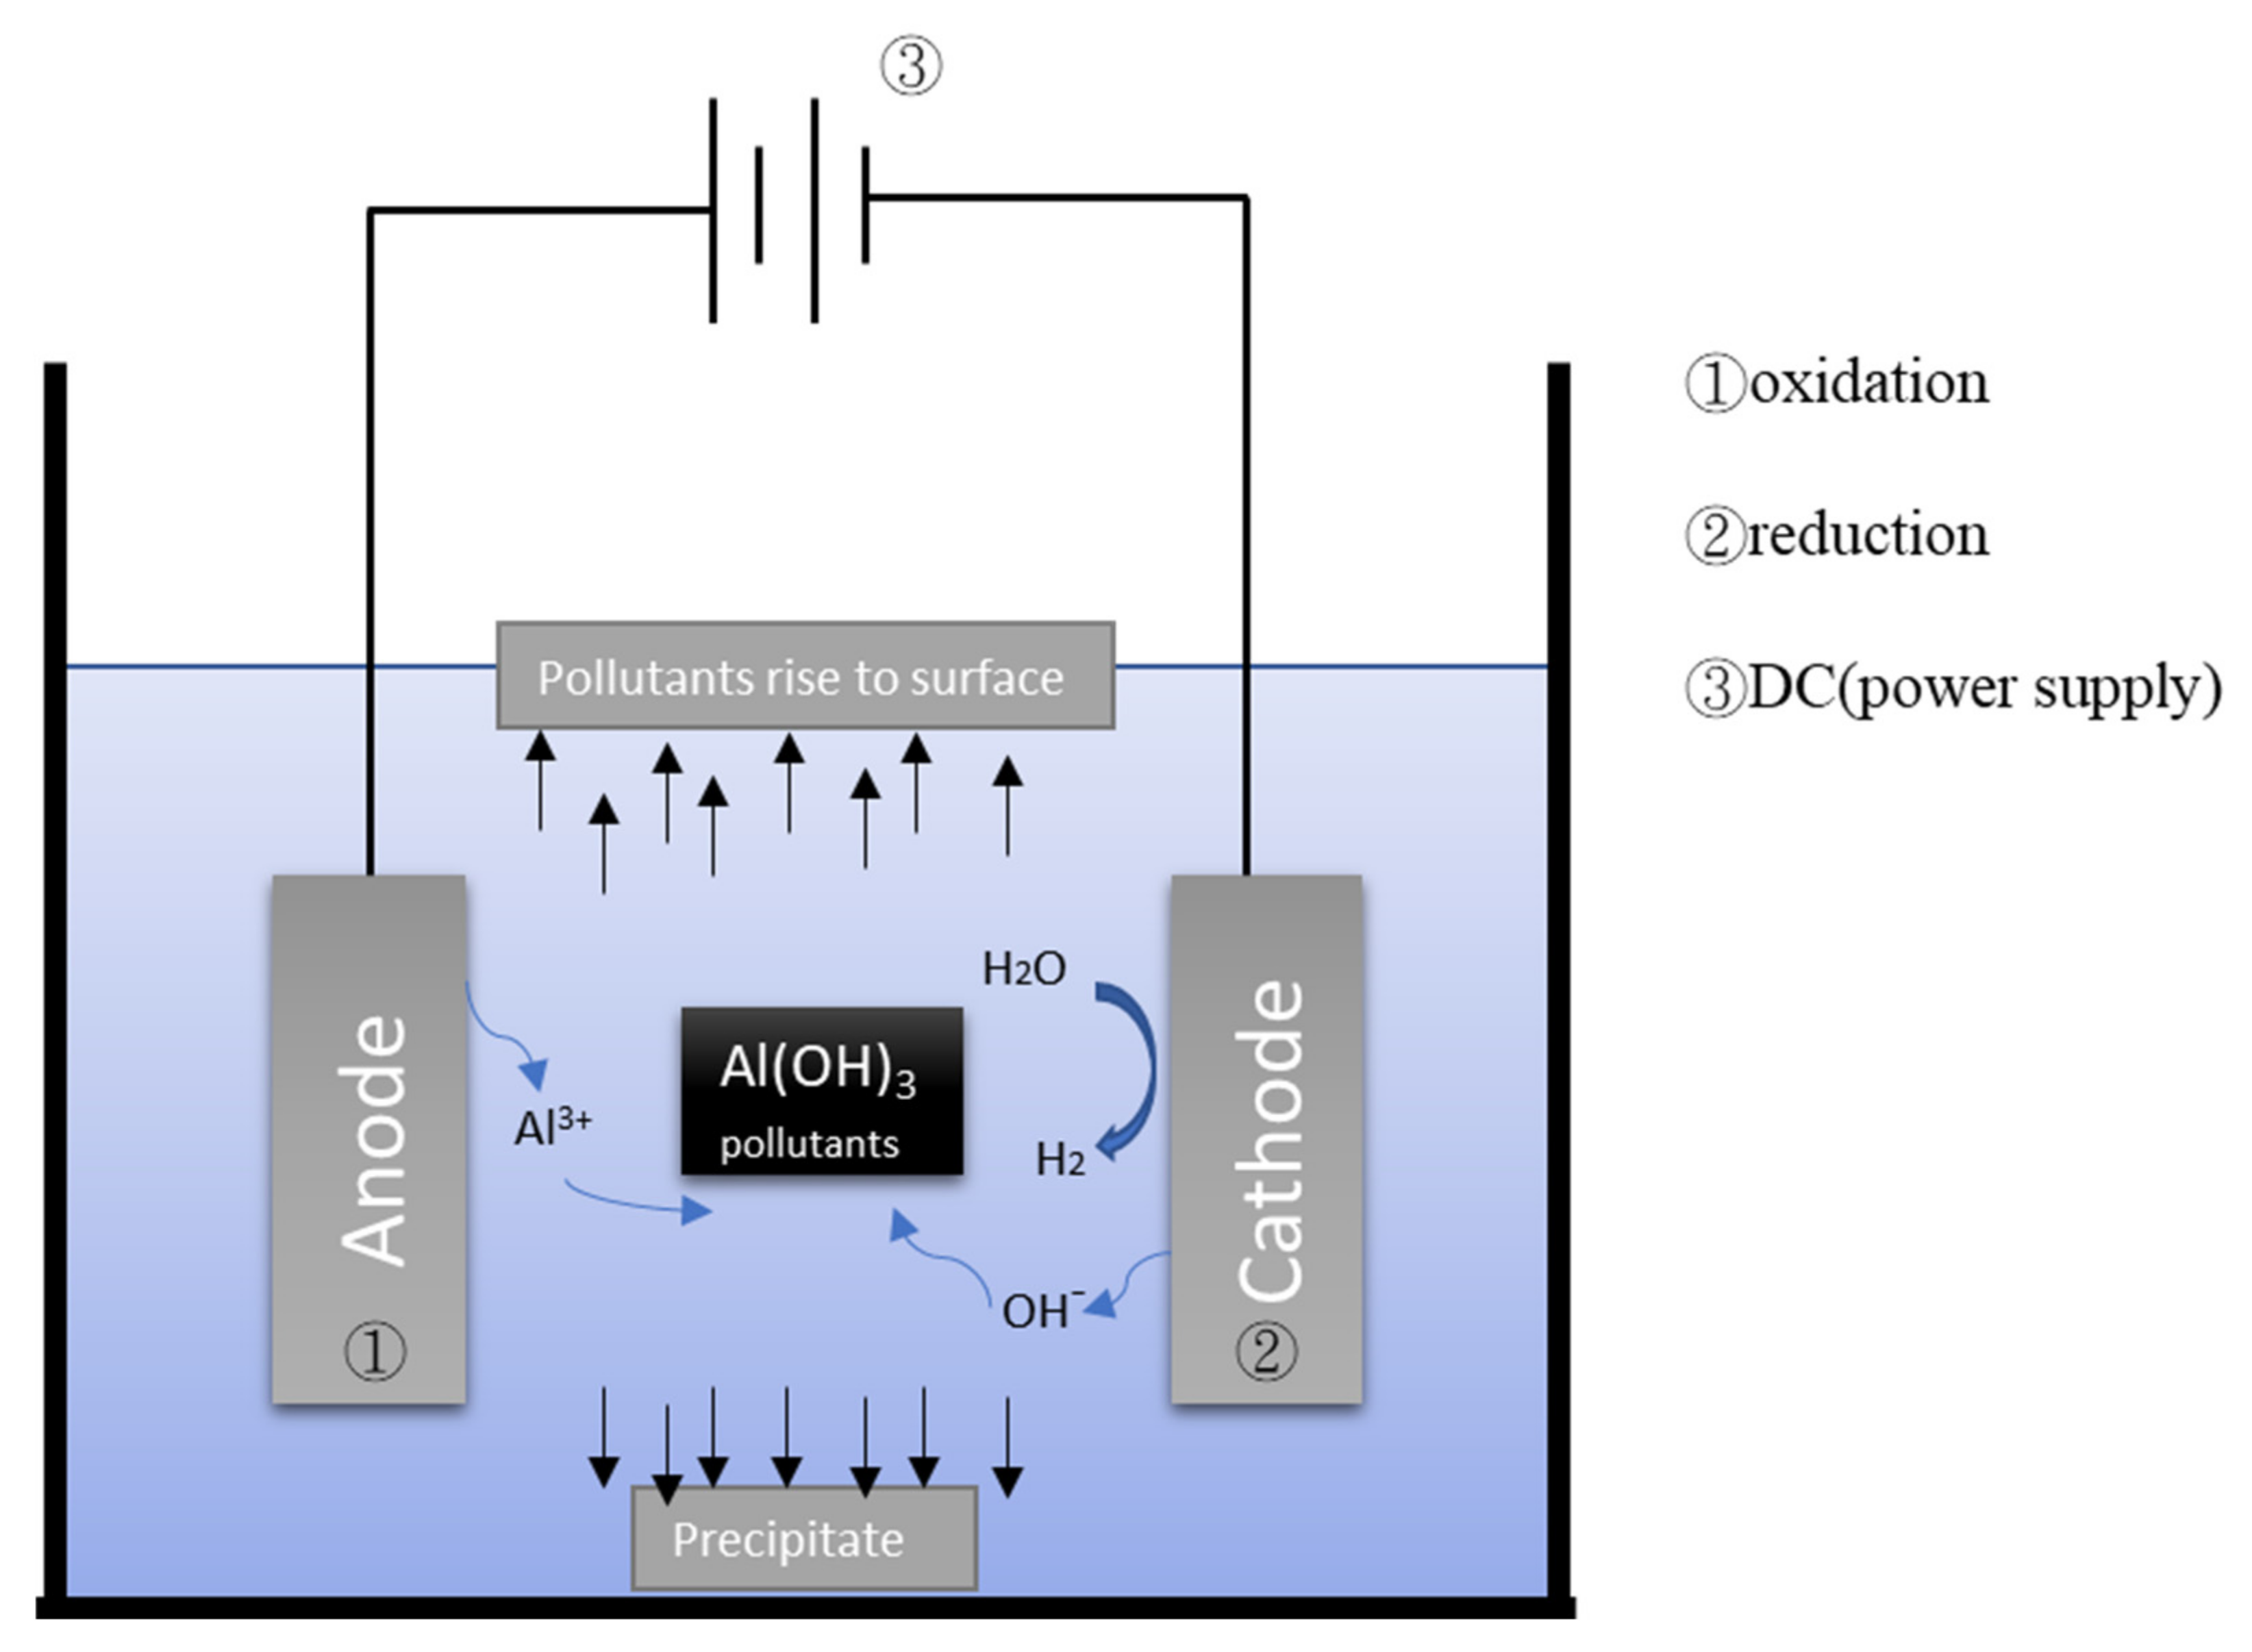
2.1. Electrocoagulation (EC)

| Country | Area | Ref. | Technique | SS (mg/L) |
Turbidity (NTU) |
COD (mg/L) |
O&G (mg/L) |
AS (mg/L) |
|---|---|---|---|---|---|---|---|---|
| Mexico | Toluca | [5] | EC + AD | — | 92~98% | 78~94% | — | — |
| Mexico | Toluca | [6] | EC + EO | — | 98~98.4% | 76~96% | 92~100% | 81~92% |
| Italy | Genoa | [8] | EC + EO | — | — | 75~97% | — | — |
| Iran | Tehran | [9] | EC | — | 85.5% | 80.8% | — | — |
| Iran | Tehran | [10] | EC | — | — | 88% | — | — |
| Iran | Ahvaz | [11] | EC | — | — | 90% | — | — |
| USA | Texas | [12] | EC | — | — | 79% | — | — |
| Egypt | Shatby | [7] | EC | — | ~87% | ~85% | — | — |
| Turkey | Istanbul | [13] | EC | — | — | 88% | 82% | 99% |
| Turkey | Tekirdag | [14] | EC | — | 99% | 76% | — | — |
| China | Zhenjiang | [15] | EC + Ultrasound | — | 96% | 69% | — | — |
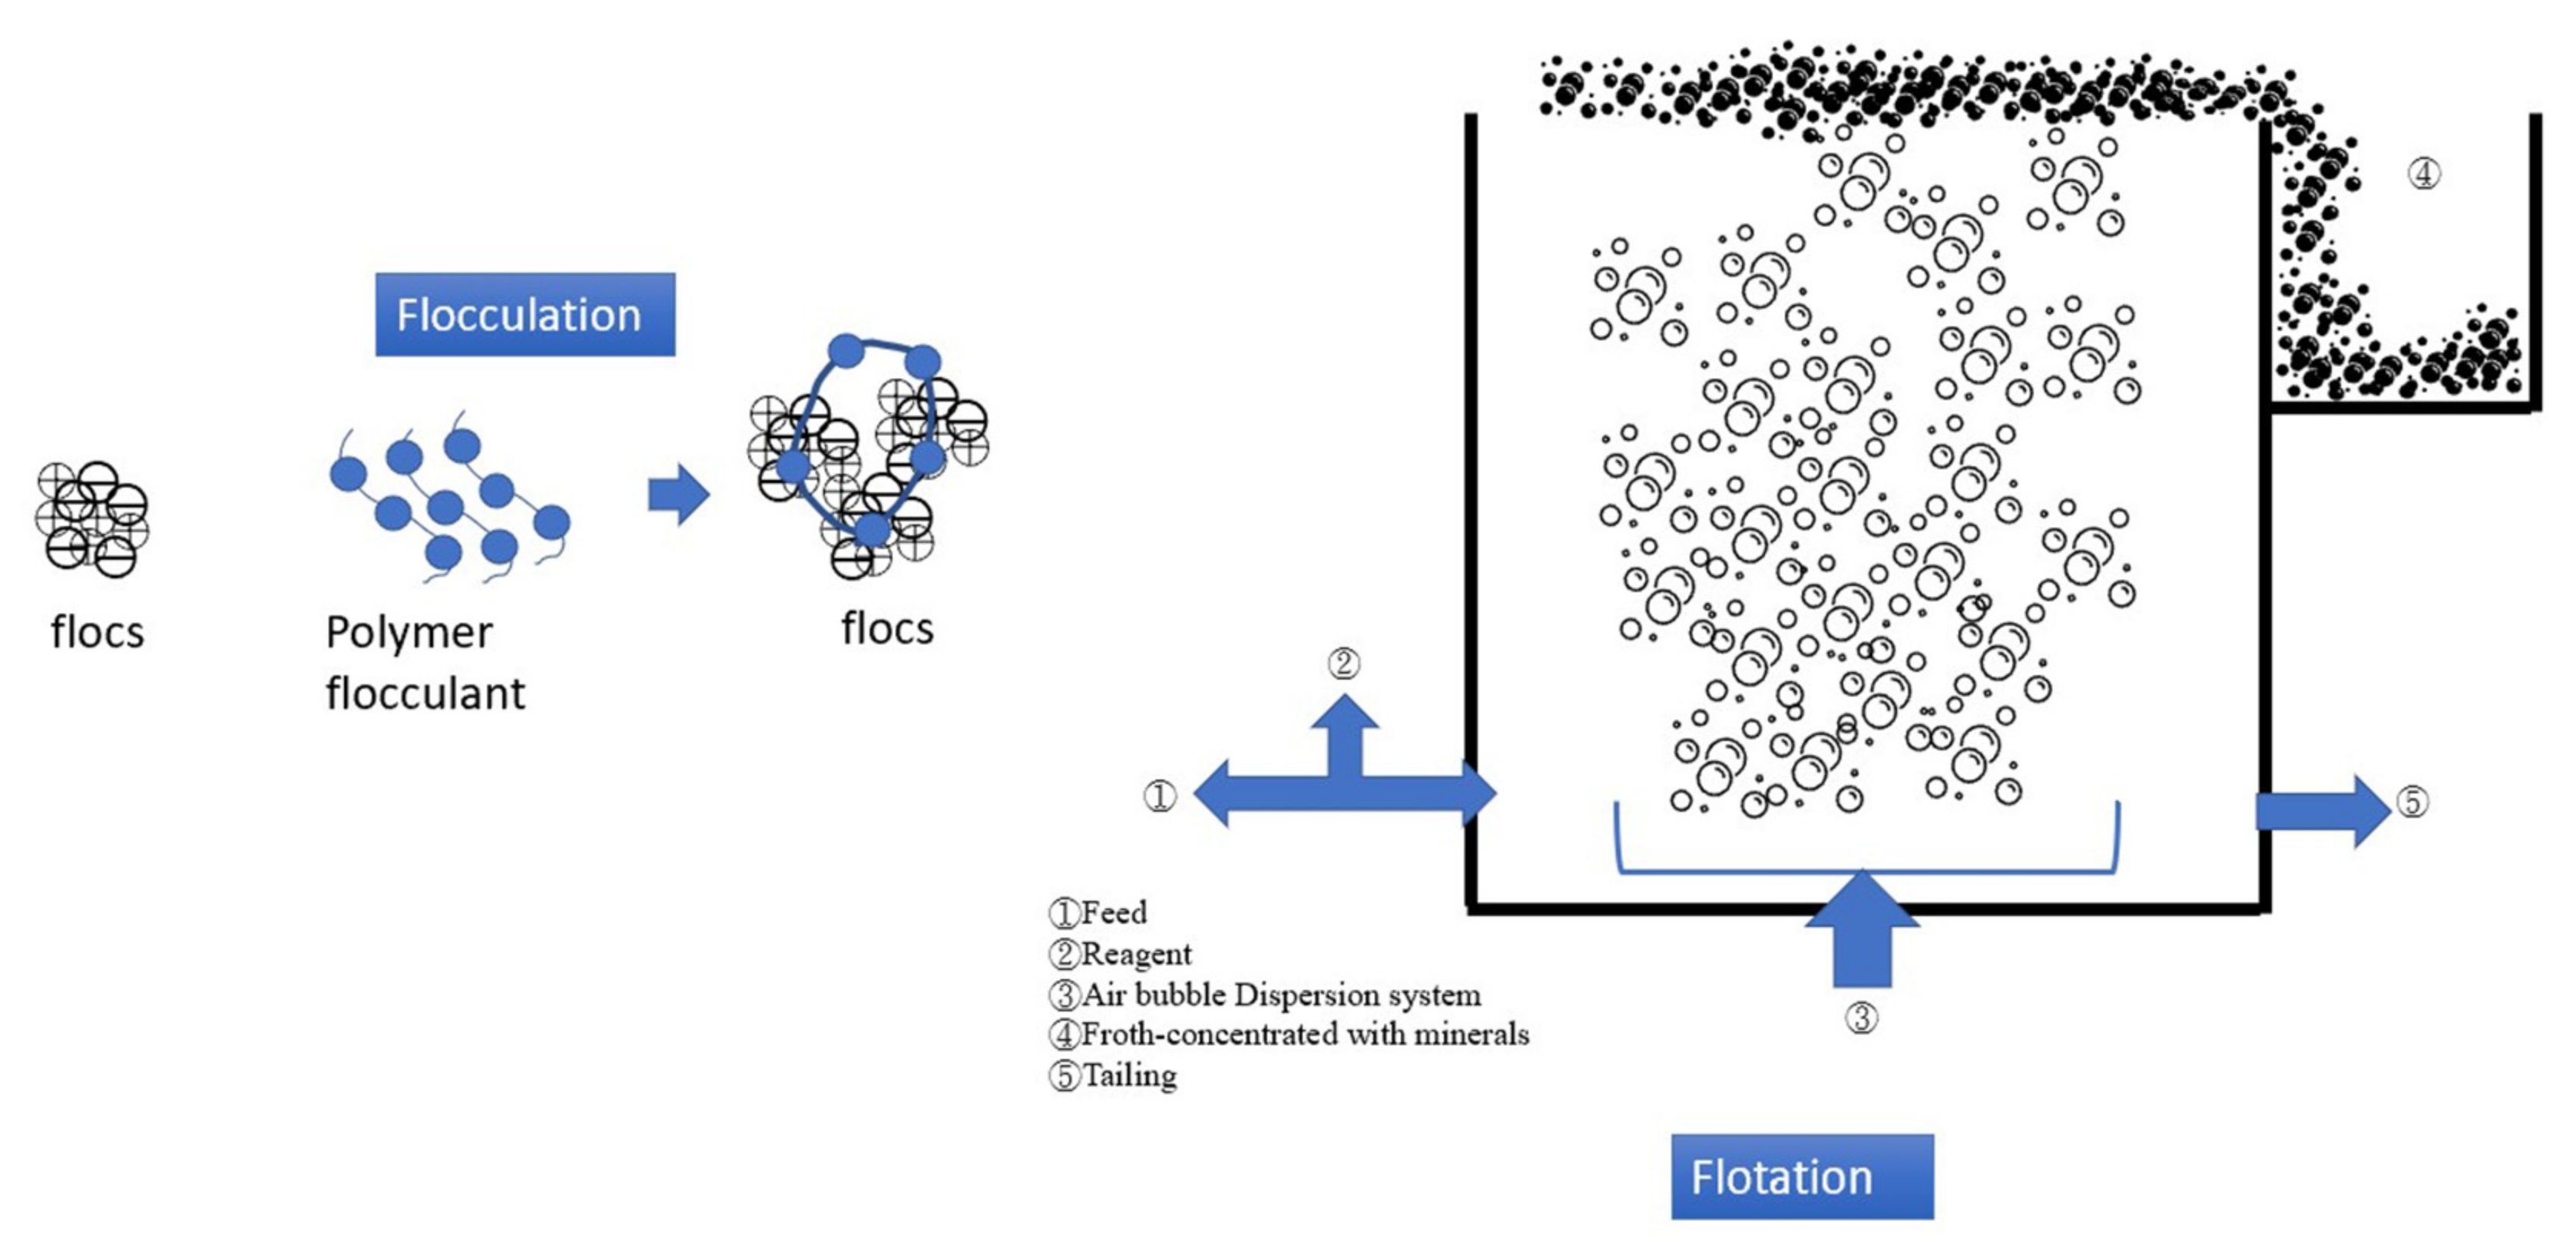
2.2. Flocculation–Flotation (FF)

| Country | Area | Ref. | Technique | SS (mg/L) |
Turbidity (NTU) |
COD (mg/L) |
O&G (mg/L) |
AS (mg/L) |
|---|---|---|---|---|---|---|---|---|
| Brazil | Porto Alegre | [17] | FF + O | 83–99% | 89–95% 93–98% | 39–85% 81–99% | — | 78–89% 81–99% |
| Brazil | Porto Alegre | [16] | FF | — | 91-96% | — | — | 40% |
| Brazil | Sao Paulo | [18] | FF + SF | — | 87–91% | — | — | — |
| Brazil | Porto Alegre | [20] | FF | 89% | 93% | 11% | — | — |
| Brazil | Porto Alegre | [19] | FF + SC | 91–93% | 91–96% | 63–76% | — | — |
| Pakistan | Hyderabad, Sindh | [21] | DAF + F | — | 97% | — | 99% | — |
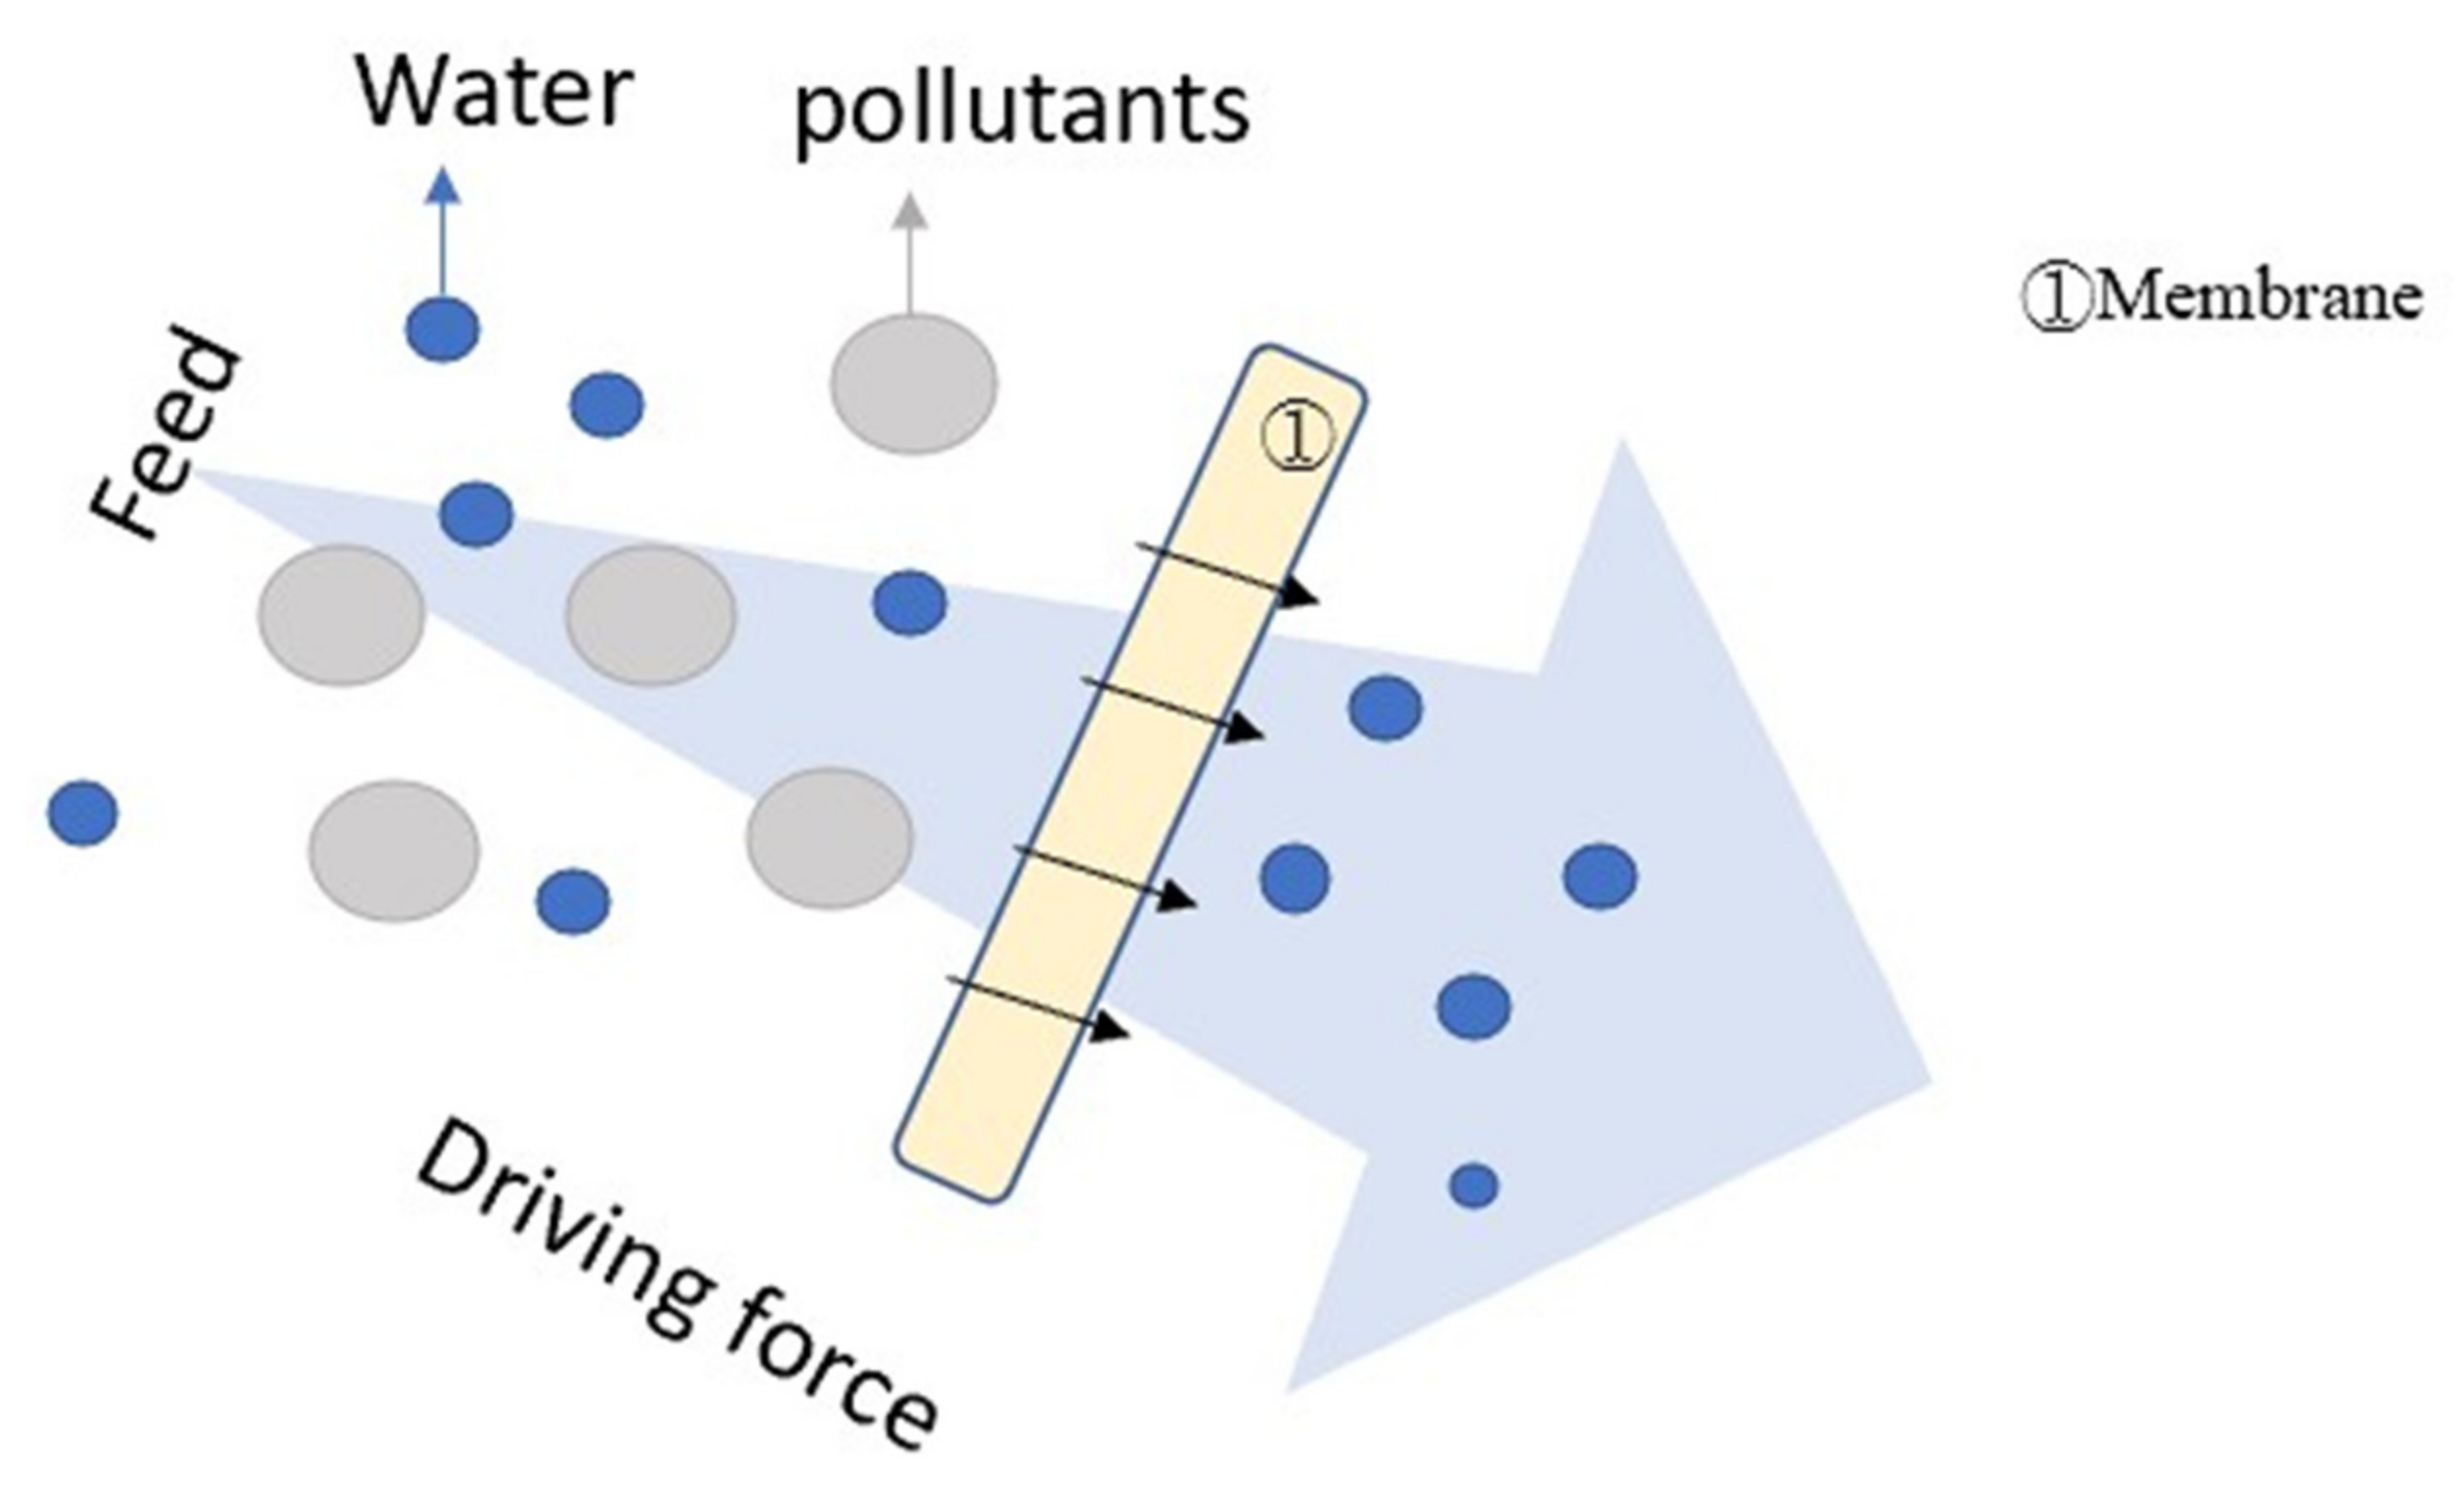
2.3. Filtration (F)

| Country | Area | Ref. | Technique | SS (mg/L) |
Turbidity (NTU) |
COD (mg/L) |
O&G (mg/L) |
AS (mg/L) |
|---|---|---|---|---|---|---|---|---|
| Belgium | Leuven | [28] | UF + NF | — | — | 60~95% | — | 88~95% |
| Sweden | — | [29] | UF | — | — | 60% | — | — |
| Turkey | Istanbul | [13] | EC + NF | 99% | — | 88% | 90% | 91% |
| Malaysia | Johor, Skudai | [30] | UF + NF | — | — | 55~92% | — | — |
| Brazil | Belo Horizonte | [31] | MF + UF | — | 96.2~99.3% | 81~85% | — | — |
| Turkey | Istanbul | [32] | UF + NF | — | — | Negligible~97% | — | — |
| Indonesia | Semarang | [27] | UF | — | 100% | 91% | 83% | — |
| Japan | Tokyo | [33] | F + UF | — | 75% | 50~90% | — | — |
| China | Shanghai | [34] | C + UF | — | 85% | 80% | — | |
| Vietnam | Hanoi | [35] | MBR + F | — | — | 90% | 88% | — |
| Australia | Melbourne | [36] | UF + RO | 100% | 99.9% | 96% | — | — |
| Pakistan | Peshawar | [26] | SED + F | 80% | 99% | — | 49.2% | |
| India | Aligarh | [37] | SF | 89.2% | — | 83.5% | — | — |
| India | Trichy | [38] | UF | — | 82% | 47–60% | — | — |
2.4. Coagulation–Flocculation (CF)

| Country | Area | Ref. | Technique | SS (mg/L) |
Turbidity (NTU) |
COD (mg/L) |
O&G (mg/L) |
AS (mg/L) |
|---|---|---|---|---|---|---|---|---|
| Italy | Brescia | [4] | CF | — | 98% | 74% | — | — |
| Iran | Zahedan | [40] | C | 37% | — | 44% | — | 76% |
| Egypt | Elminia | [41] | CF + SF + O + SF | — | 100% | 88% | — | — |
| Malaysia | Parit Raja, Johor | [39] | CF | — | 97% | 35% | — | — |
| Malaysia | Parit Raja | [42] | C | — | 94% | 60% | — | — |
| Malaysia | Taman University | [43] | C | — | 90% | 60% | — | — |
| China | Shenyang | [44] | C + UF | — | 94% | — | >40% | — |
| China | Shanghai | [45] | C + M | — | 70% | — | — | — |
| India | Bangalore | [46] | CF + F | — | — | 80–90% | 92–93% | — |
| Pakistan | Abbottabad | [47] | C + H2O2 | — | 97% | 93% | 96% | — |
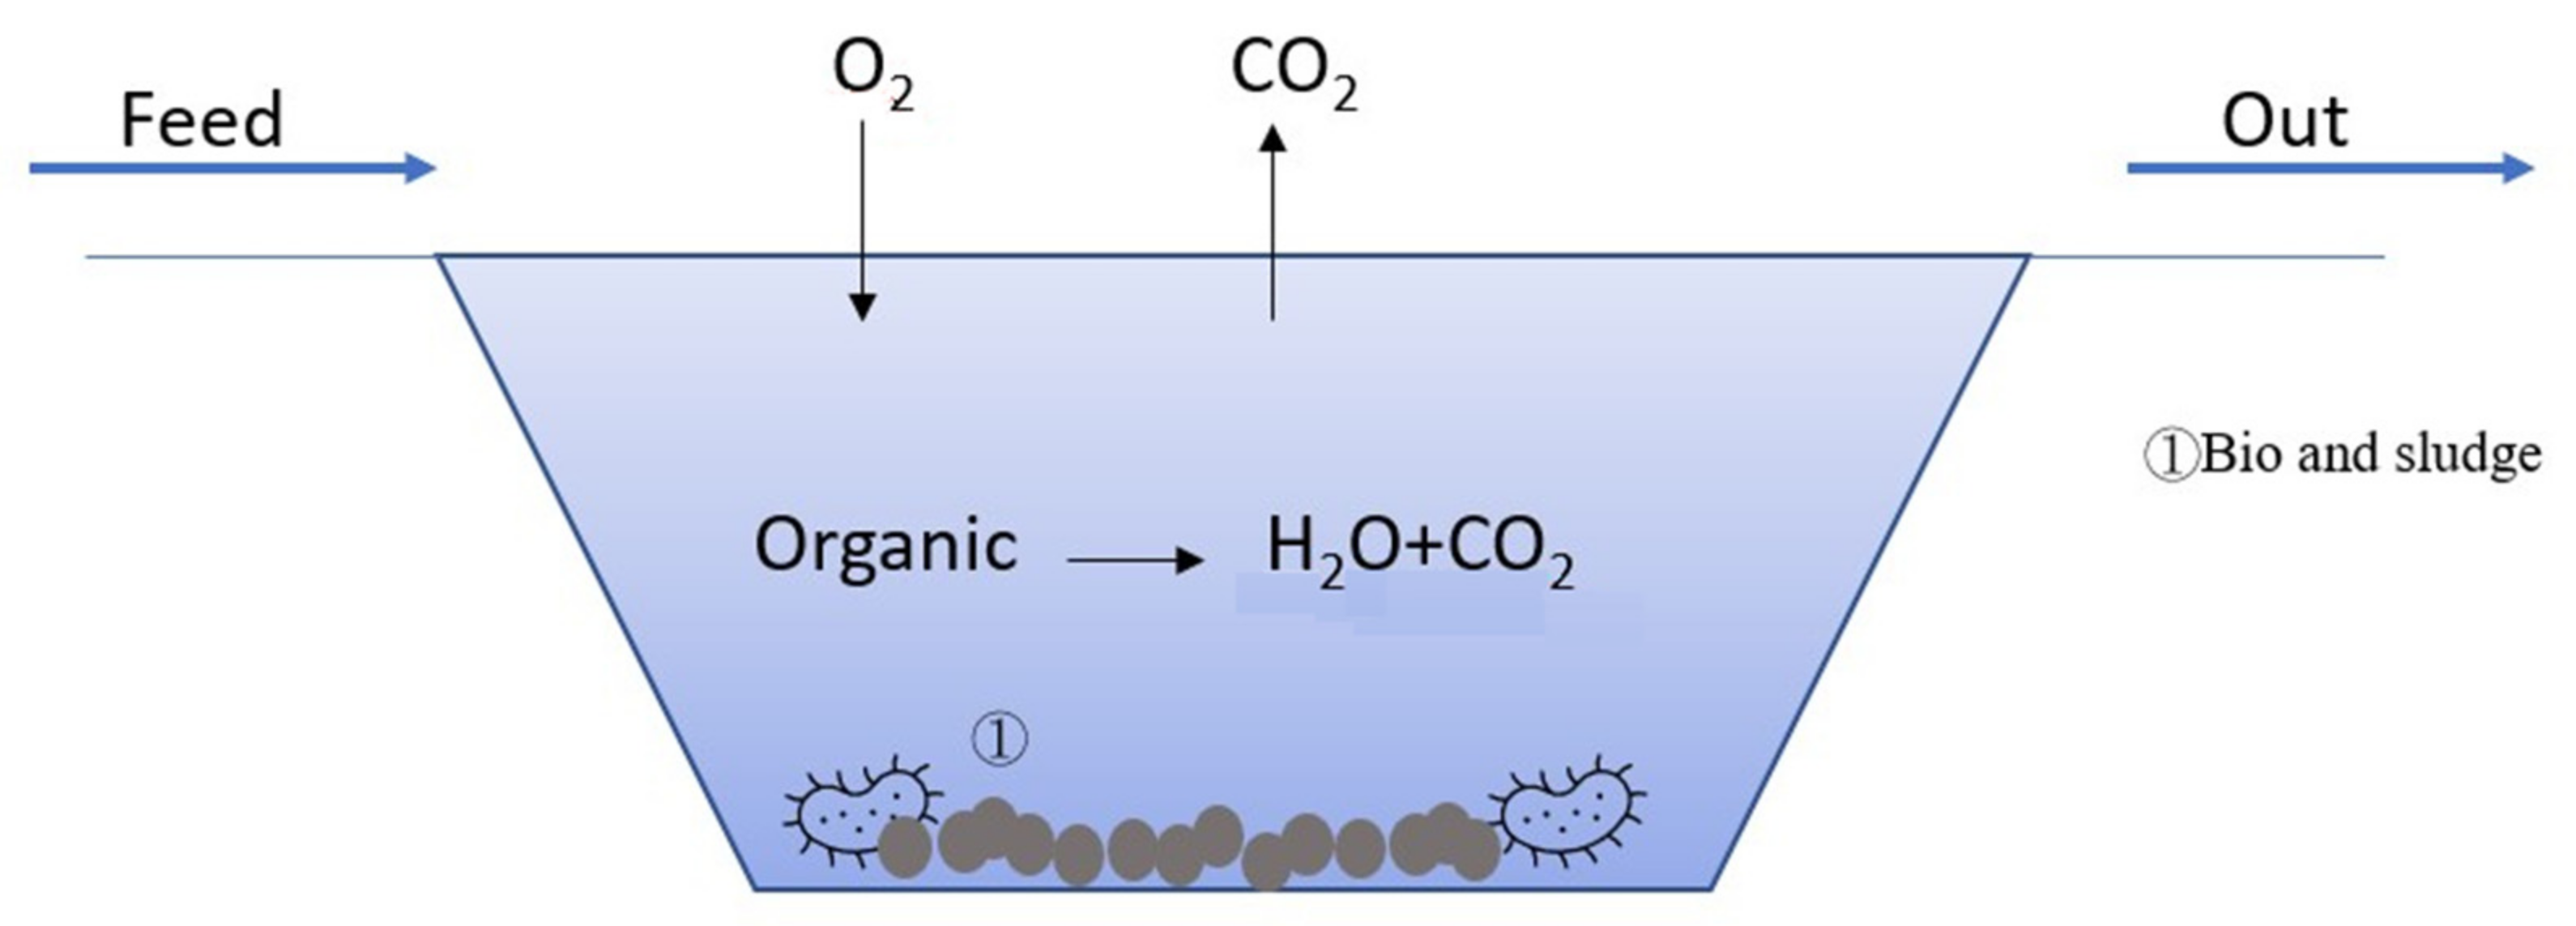
2.5. Bio-Treatment

| Country | Area | Ref. | Technique | SS (mg/L) |
Turbidity (NTU) |
COD (mg/L) |
O&G (mg/L) |
AS (mg/L) |
|---|---|---|---|---|---|---|---|---|
| Brazil | Sao Paulo | [3] | RBC + F | — | 72~97% | 56~94% | — | — |
| USA | New Jersey | [48] | four bioretention mesocosms | 84~95% | — | — | — | 89~96% |
| Taiwan | Hsinchu | [51] | Bio + M | 95.7% | — | 70.2% | — | — |
| Australia | Geelong | [49] | C + MBR | 99.8% | 99.6% | — | — | — |
| Australia | Melbourne | [50] | enhanced MBR (eMBR) | — | 99.9% | 99.8% | 5.9~6.7 LMH | — |
2.6. Other Methods
| Country | Area | Ref. | Technique | SS (mg/L) |
Turbidity (NTU) |
COD (mg/L) |
O&G (mg/L) |
AS (mg/L) |
|---|---|---|---|---|---|---|---|---|
| Egypt | South of Egypt | [52] | Photo-Fenton’s process | — | — | 82~93.4% | — | — |
| Syria | Aleppo | [53] | AD | — | — | 81.6% | 86.8% | 88.3% |
| Brazil | Natal | [54] | EO | — | — | 96% | — | 83~96% |
This entry is adapted from the peer-reviewed paper 10.3390/su14105764
References
- Torkashvand, J.; Farzadkia, M.; Younesi, S.; Gholami, M. A systematic review on membrane technology for carwash wastewater treatment: Efficiency and limitations. Desalin. Water Treat. 2021, 210, 81–90.
- Talebzadeh, F.; Valeo, C.; Gupta, R.; Constabel, C.P. Exploring the Potential in LID Technologies for Remediating Heavy Metals in Carwash Wastewater. Sustainability 2021, 13, 8727.
- Subtil, E.L.; Rodrigues, R.; Hespanhol, I.; Mierzwa, J.C. Water reuse potential at heavy-duty vehicles washing facilities—The mass balance approach for conservative contaminants. J. Clean. Prod. 2017, 166, 1226–1234.
- Vaccari, M.; Gialdini, F.; Collivignarelli, C. Study of the reuse of treated wastewater on waste container washing vehicles. Waste Manag. 2013, 33, 262–267.
- Rubi-Juarez, H.; Barrera-Diaz, C.; Uena-Nunez, F. Adsorption-assisted electrocoagulation of real car wash wastewater with equilibrium and kinetic studies. Pollut. Res. 2017, 36, 175–184.
- Rubi-Juarez, H.; Barrera-Diaz, C.; Linares-Hernandez, I.; Fall, C.; Bilyeu, B. A combined electrocoagulation-electrooxidation process for carwash wastewater reclamation. Int. J. Electrochem. Sci. 2015, 10, 6754–6767.
- El-Ashtoukhy, E.S.Z.; Amin, N.K.; Fouad, Y.O. Treatment of real wastewater produced from Mobil car wash station using electrocoagulation technique. Environ. Monit. Assess. 2015, 187, 628–638.
- Panizza, M.; Cerisola, G. Applicability of electrochemical methods to carwash wastewaters for reuse. Part 2: Electrocoagulation and anodic oxidation integrated process. J. Electroanal. Chem. 2010, 638, 236–240.
- Mirshahghassemi, S.; Aminzadeh, B.; Torabian, A.; Afshinnia, K. Optimizing electrocoagulation and electro-Fenton process for treating car wash wastewater. Environ. Health Eng. Manag. J. 2017, 4, 37–43.
- Mohammadi, M.J.; Salari, J.; Takdastan, A.; Farhadi, M.; Javanmardi, P.; Yari, A.R.; Dobaradaran, S.; Almasi, H.; Rahimi, S. Removal of turbidity and organic matter from car wash wastewater by electrocoagulation process. Desalin. Water Treat. 2017, 68, 122–128.
- Mohammadi, M.J.; Takdastan, A.; Jorfi, S.; Neisi, A.; Farhadi, M.; Yari, A.R.; Dobaradaran, S.; Khaniabadi, Y.O. Electrocoagulation process to Chemical and Biological Oxygen Demand treatment from carwash grey water in Ahvaz megacity, Iran. Data Brief 2017, 11, 634–639.
- Gomes, A.J.; Das, K.K.; Jame, S.A.; Cocke, D.L. Treatment of truck wash water using electrocoagulation. Desalin. Water Treat. 2016, 57, 25991–26002.
- Gonder, Z.B.; Balcioglu, G.; Vergili, I.; Kaya, Y. An integrated electrocoagulation-nanofiltration process for carwash wastewater reuse. Chemosphere 2020, 253, 126713.
- Kara, S. Treatment of transport container washing wastewater by electrocoagulation. Environ. Prog. Sustain. Energy 2013, 32, 249–256.
- Chu, J.Y.; Li, Y.R.; Li, N.; Huang, W.H. Treatment of Car-washing Wastewater by Electrocoagulation-Ultrasound Technique for Reuse. Adv. Mater. Res. 2012, 433–440, 227–232.
- Zaneti, R.; Etchepare, R.; Rubio, J. More environmentally friendly vehicle washes: Water reclamation. J. Clean. Prod. 2012, 37, 115–124.
- Etchepare, R.; Zaneti, R.; Azevedo, A.; Rubio, J. Application of flocculation–flotation followed by ozonation in vehicle wash wastewater treatment/disinfection and water reclamation. Desalin. Water Treat. 2015, 56, 1728–1736.
- Zaneti, R.; Etchepare, R.; Rubio, J. Car wash wastewater reclamation. Full-scale application and upcoming features. Resour. Conserv. Recycl. 2011, 55, 953–959.
- Zaneti, R.N.; Etchepare, R.; Rubio, J. Car wash wastewater treatment and water reuse—A case study. Water Sci. Technol. 2013, 67, 82–88.
- Rubio, J.; Zaneti, R.N. Treatment of washrack wastewater with water recycling by advanced flocculation–column flotation. Desalin. Water Treat. 2009, 8, 146–153.
- Bhatti, S.; Siddiqui, Z.; Memon, S.; Kandhir, I.; Memon, M.A.; Mahesar, A.W. Analysis and treatment wash off water from vehicular service station in Hyderabad. Sindh Univ. Res. J. SURJ (Sci. Ser.) 2017, 49, 473–478.
- Zapién Serrano, L.Z.; Ortiz Lara, N.O.; Ríos Vera, R.R.; Cholico-González, D. Removal of Fe(III), Cd(II), and Zn(II) as Hydroxides by Precipitation–Flotation System. Sustainability 2021, 13, 11913.
- Park, J.H.; Han, Y.S.; Ji, S.W. Investigation of Mineral-Processing Wastewater Recycling Processes: A Pilot Study. Sustainability 2018, 10, 3069.
- Siddig, O.; Al-Afnan, S.; Elkatatny, S.; Bahgat, M. Novel Cake Washer for Removing Oil-Based Calcium Carbonate Filter Cake in Horizontal Wells. Sustainability 2020, 12, 3427.
- Mohamed, A.; Basfar, S.; Elkatatny, S.; Al-Majed, A. Prevention of Barite Sag in Oil-Based Drilling Fluids Using a Mixture of Barite and Ilmenite as Weighting Material. Sustainability 2019, 11, 5617.
- Syed, N.H.; Ahmad, J.; Khan, N.A.; Khan, N.; Shafiq, M.A. A low-cost wastewater treatment unit for reducing the usage of fresh water at car wash stations in Pakistan. Pak. J. Sci. Ind. Res. A Phys. Sci. 2019, 62A, 57–66.
- Istirokhatun, T.; Destianti, P.; Hargianintya, A.; Oktiawan, W.; Susanto, H. Treatment of car wash wastewater by UF membranes. In Proceedings of the International Conference of Chemical and Material Engineering, Kyoto, Japan, 29 December 2015; p. 060025.
- Boussu, K.; Kindts, C.; Vandecasteele, C.; van der Bruggen, B. Applicability of nanofiltration in the carwash industry. Sep. Purif. Technol. 2007, 54, 139–146.
- Jönsson, C.; Jönsson, A.S. The influence of degreasing agents used at car washes on the performance of ultrafiltration membranes. Desalination 1995, 100, 115–123.
- Lau, W.J.; Ismail, A.F.; Firdaus, S. Car wash industry in Malaysia: Treatment of car wash effluent using ultrafiltration and nanofiltration membranes. Sep. Purif. Technol. 2013, 104, 26–31.
- Pinto, A.C.S.; de Barros Grossi, L.; de Melo, R.A.C.; de Assis, T.M.; Ribeiro, V.M.; Amaral, M.C.S.; de Souza Figueiredo, K.C. Carwash wastewater treatment by micro and ultrafiltration membranes: Effects of geometry, pore size, pressure difference and feed flow rate in transport properties. J. Water Process Eng. 2017, 17, 143–148.
- Uçar, D. Membrane processes for the reuse of car washing wastewater. J. Water Reuse Desalin. 2018, 8, 169–175.
- Hamada, T.; Miyazaki, Y. Reuse of carwash water with a cellulose acetate ultrafiltration membrane aided by flocculation and activated carbon treatments. Desalination 2004, 169, 257–267.
- Tan, X.; Tang, L. Application of enhanced coagulation aided by UF membrane for car wash wastewater treatment. In Proceedings of the 2008 2nd International Conference on Bioinformatics and Biomedical Engineering, Shanghai, China, 16–18 May 2008; pp. 3653–3656.
- Do, K.U.; Kim, J.H.; Chu, X.Q. Sludge characteristics and performance of a membrane bioreactor for treating oily wastewater from a car wash service station. Desalin. Water Treat. 2018, 120, 166–172.
- Moazzem, S.; Wills, J.; Fan, L.; Roddick, F.; Jegatheesan, V. Performance of ceramic ultrafiltration and reverse osmosis membranes in treating car wash wastewater for reuse. Environ. Sci. Pollut. Res. 2018, 25, 8654–8668.
- Alam, J.; Farooqi, I.H. Management of grey water of an automobile workshop—A case study. In Proceedings of the International Workshop on Civil Engineering and Architecture, Istanbul, Turkey, 8–9 August 2014; pp. 133–138.
- Kiran, S.A.; Arthanareeswaran, G.; Thuyavan, Y.L.; Ismail, A.F. Influence of bentonite in polymer membranes for effective treatment of car wash effluent to protect the ecosystem. Ecotoxicol. Environmen. Saf. 2015, 121, 186–192.
- Al-Gheethi, A.A.; Mohamed, R.M.S.R.; Rahman, M.A.A.; Johari, M.R.; Kassim, A.H.M. Treatment of wastewater from car washes using natural coagulation and filtration system. IOP Conf. Ser. Mater. Sci. Eng. 2016, 136, 012046.
- Bazrafshan, E.; Mostafapoor, F.K.; Soori, M.M.; Mahvi, A.H. Application of combined chemical coagulation and electrocoagulation process to carwash wastewater treatment. Fresenius Environ. Bull. 2012, 21, 2694–2701.
- Abdelmoez, W.; Barakat, N.A.M.; Moaz, A. Treatment of wastewater contaminated with detergents and mineral oils using effective and scalable technology. Water Sci. Technol. 2013, 68, 974–981.
- Radin Mohamed, R.M.S.; Abdul Rahman, N.; Mohd Kassim, A.H. Moringa Oleifera and Strychnos Potatorum seeds as natural coagulant compared with synthetic common coagulants in treating car wash wastewater: Case study 1. Asian J. Appl. Sci. 2014, 2, 693–700.
- Mohamed, R.M.S.R.; Saphira, R.M.; Kutty, A.I.; Mariam, N.; Kassim, M.; Hashim, A. Efficiency of using commercial and natural coagulants in treating car wash wastewater treatment. Aust. J. Basic Appl. Sci. 2014, 8, 227–234.
- Zhang, J.K.; Yang, Y.B.; Wang, H.Y.; Dong, Z.B. CFU combined process for the treatment of oily car washing wastewater. Appl. Mech. Mater. 2013, 253–255, 999–1004.
- Tang, L.; Tan, X.J.; Cui, F.Y.; Zhou, Q.; Yin, J. Reuse of carwash wastewater with hollow fiber membrane aided by enhanced coagulation and activated carbon treatments. Water Sci. Technol. 2007, 56, 111–118.
- Asha, M.N.; Chandan, K.S.; Harish, H.P.; NikhileswarReddy, S.; Sharath, K.S.; Liza, G.M. Recycling of waste water collected from automobile service station. Procedia. Environ. Sci. 2016, 35, 289–297.
- Bhatti, Z.A.; Mahmood, Q.; Raja, I.A.; Malik, A.H.; Khan, M.S.; Wu, D. Chemical oxidation of carwash industry wastewater as an effort to decrease water pollution. Phys. Chem. Earth Parts A/B/C 2011, 36, 465–469.
- Bakacs, M.E.; Yergeau, S.E.; Obropt, C.C.; ASCE, P.E.M. Assessment of car wash runoff treatment using bioretention mesocosms. J. Environ. Eng. 2013, 139, 1132–1136.
- Boluarte, I.A.R.; Andersen, M.; Pramanik, B.K.; Chang, C.Y.; Bagshaw, S.; Farago, L.; Jegatheesan, V.; Shu, L. Reuse of car wash wastewater by chemical coagulation and membrane bioreactor treatment processes. Int. Biodeterior. Biodegrad. 2016, 113, 44–48.
- Moazzem, S.; Ravishankar, H.; Fan, L.; Roddick, F.; Jegatheesan, V. Application of enhanced membrane bioreactor (eMBR) for the reuse of carwash wastewater. J. Environ. Manag. 2020, 254, 109780.
- Hsu, S.K.; Chen, C.H.; Chang, W.K. Reclamation of car washing wastewater by a hybrid system combining bio-carriers and non-woven membranes filtration. Desalin. Water Treat. 2011, 34, 349–353.
- Tony, M.A.; Bedri, Z. Experimental design of photo-Fenton reactions for the treatment of car wash wastewater effluents by response surface methodological analysis. Adv. Environ. Chem. 2014, 2014, 958134.
- Baddor, I.M.; Farhoud, N.; Abdel-Magid, I.M.; Alshami, S.; Hassan Ahmad, F.; Olabi, E.A. Study of car wash wastewater treatment by adsorption. In Proceedings of the International Conference of Engineering, Information Technology, and Science, Kuala Lumpur, Malaysia, 1 May 2014; pp. 2–22.
- Ganiyu, S.O.; dos Santos, E.V.; de Araújo Costa, E.C.T.; Martínez-Huitle, C.A. Electrochemical advanced oxidation processes (EAOPs) as alternative treatment techniques for carwash wastewater reclamation. Chemosphere 2018, 211, 998–1006.
