Hybrid Microgrid System: History
Please note this is an old version of this entry, which may differ significantly from the current revision.
Contributor:

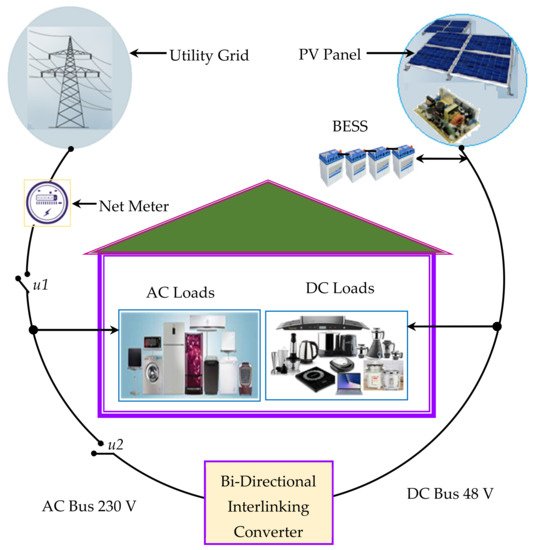
A novel energy management system for a hybrid microgrid has been developed that uses a new control algorithm termed Inefficient Power Conversion Elimination Algorithm (IPCEA). The proposed algorithm compares the Net Transferable Power (NTP) available at the DC side with the loss rate across the converter. The converter is switched off (or disconnected from the grid and load) if the NTP is less than 20% of the converter rating to avoid low-efficiency power conversion. The solar PV system is connected to the DC bus to supply the DC loads while the AC loads are supplied from the AC source (utility power). An auxiliary battery pack has been integrated to the DC side to feed DC loads during the absence of solar energy. Battery Energy Storage System (BESS) has been deployed to manage energy distribution effectively. Power distribution is managed using a centralized microgrid controller, and the load demand is met accordingly. Thereby, power generated by solar PV can be utilized effectively. Microgrid technology's effectiveness is emphasized by comparative analysis, and the achievements have been discussed in detail and highlighted using a prototype model.

The proposed study intends to design a novel switching strategy to incorporate a hybrid microgrid in the distribution system effectively. It comprises the following conventional electrical installation with an intelligent microgrid distribution system:

i) To implement a renewable-based IPCEA considering the availability of Net Transferable Power (NTP) at DC bus and the rate of converter loss to minimize low efficient power conversion.

ii) To effectively manage battery energy within the DC side of the microgrid to minimize the charge cycle and improve its performance. 

iii) To decrease the stress on the utility grid by reducing the rate of power exchange.

  • AC/DC microgrid
  • Hybrid microgrids
  • Energy Management Systems
  • Battery Energy Storage Systems
  • Power losses
  • Power electronics

1. Hybrid Microgrid System Description

A renewable energy-based hybrid microgrid configuration for the realization of the proposed IPCEA is shown in Figure 1. The AC loads are connected to the AC bus and are fed by an AC source (utility power). The DC bus of the microgrid comprises Solar PV, batteries, and DC loads. The power generated from solar PV is managed at MPP and stored using a dedicated battery when necessary. The battery bank is connected for load management and to feed the DC load during the absence of solar and utility power. Consequently, if the battery’s state of charge reaches less than 50%, then the power is driven from the utility. The expression for SoC of the battery is as below.
S o C = 1 1 Q I B d t                    
where
Figure 1. Hybrid microgrid system configuration.
  • SoC—Battery State of Charge
  • Q—Battery Capacity
  • IB—Battery Current
The incorporation of renewable energy sources, such as solar PV, plays a vital role in conversion loss reduction. Primarily, the conversion loss while feeding the DC load demand is greatly reduced. It can be expressed as follows.
During DC Demand > PPV
P D C . l o a d . f e e d = D C   D e m a n d P P V + P D C . P T   1 η r e c 1 + P A C . P T   1 η A p p . i n v 1    
During DC Demand < PPV
P D C . l o a d . f e e d = P P V D C   D e m a n d
From Equation (3), it can be inferred that the loss across the rectifier and the loss due to the appliance transformer can be eliminated by including solar PV power.
Similarly, when the battery is charged using solar power, the majority of the loss-causing factors can be avoided. This is expressed as
P B . c h g ,   l o s s = P B . i n t ,   l o s s + P d c   c o n v ,   l o s s  
Equation (4) indicates that battery charging includes only internal loss and DC converter loss, since it is charged directly from Solar PV DC power. The rectifier loss, transformer loss, and appliance transformer loss are eliminated.

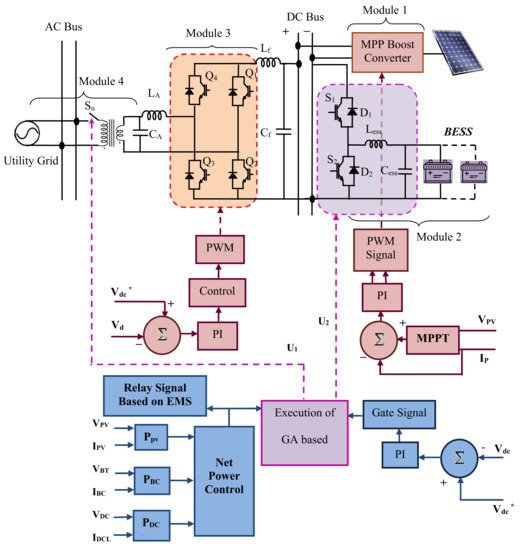
2. Proposed Microgrid Controller Configuration

Intelligent energy management of the microgrid-based residential distribution system is done performed using a microgrid controller. The schematic of the controller is depicted in Figure 7.
Figure 2. Schematic diagram of the hybrid microgrid controller.Parameters used in Figure 2.
  • Q1, Q2, Q3, Q4—Bidirectional interlinking converter IGBT switches
  • S1, S2,—Bidirectional DC converter IGBT switches
  • D1, D2,—Bidirectional DC converter diodes
  • VPV—Solar PV voltage
  • IPV—Solar PV current
  • PPV—Solar PV power
  • VBT—Battery voltage
  • IBC—Battery current
  • PBC—Battery power
  • Idcl—DC load current
  • Pdcl—DC load power
  • Vdc—DC link voltage
  • Vdc*—Reference DC link voltage
  • Su—Utility grid voltage
  • LA—AC side filter inductor
  • CA—AC side filter capacitor
  • Lf—DC link filter inductor
  • Cf—DC link filter capacitor
  • Less—Battery side filter inductor
  • Cess—Battery side filter capacitor
  • BESS—Battery energy storage system
The controller comprises four modules, as follows:
Module 1: A controller for MPP boost converter control. The Perturb and Observe algorithm is used for MPP of the solar PV system. The solar panel current IPV and voltage VPV values are fed into the controller and switching gate pulses are generated to operate the DC–DC boost converter.
Module 2: Comprises the controller for managing the auxiliary battery charges. The control signal is generated by comparing the reference DC bus voltage with the actual bus voltage. The bidirectional battery side converter is switched on and off depending on the optimal time of use required by the genetic algorithm.
During battery charging mode, the converter acts as a buck converter. The S1 and D2 conduct until the battery charges to its specified voltage. The duty cycle of the switch S1 is obtained using the following expression.
δ = V B T V D C
where
  • δ = Duty cycle
  • VBT = Battery voltage
  • VDC = Microgrid DC bus voltage
During discharging mode, S2 and D1 conduct and the duty cycle of the switch S2 is obtained using the expression
δ=VBTVDC VBT
Module 3: Consists of a controller for bidirectional interlinking converter control. It is operated with the power available at the DC side voltage profile, based on the requirement of the interlinking converter operated either as a rectifier or as an inverter. The inverter is committed to functioning based on the utility side switch SU operation.
The bidirectional converter output voltage is controlled using the modulation index and it is expressed as follows.
ma=VcontrolVtriangle
where
  • ma = Modulation index
  • Vcontrol = Voltage obtained from controller
  • Vtriangle = Triangular carrier wave voltage
The converter output is injected into the utility grid at an appropriate angle, which is obtained using the expression
φ=sin1(ω1 LA IAC VAC)
where
  • ϕ = Angle at which voltage is injected into utility grid
  • LA = AC side smoothing inductor
  • VAC = AC voltage at inverter terminal
The power injected to the utility grid is expressed as
PAC=VAC Vug sinφω1 LA
where:
  • Vug = Utility grid voltage
  • Sin ϕ = Sine of angle between inverter voltage and utility grid voltage
Module 4: The utility side switch Su is operated with an intelligent control. The interlinking converter works only if the utility switch SU is on. The switching pattern is obtained using the genetic algorithm.

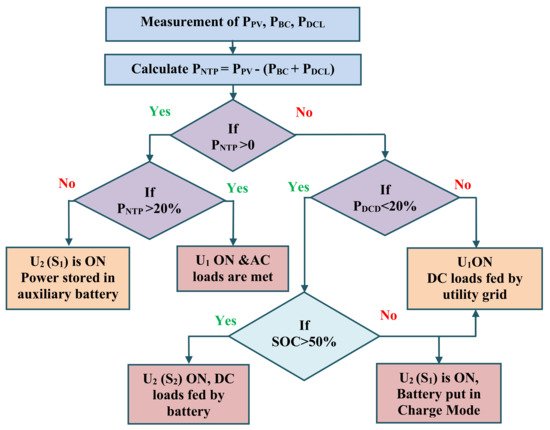
3. Design Procedure of the IPCEA Based Microgrid EMS

The IPCEA algorithm is based on a lower threshold limit for power transfer to avoid inefficient power transfer. The limit is set as 20% of the converter rating since the transformer connected in the circuit exhibit low efficiency when supplied less than 20% of its rating [1][2][3]. The converter performance is reduced by up to 52.3% when it is loaded below than this threshold. It attains a considerable level only when it is loaded more than 20% (tested experimentally and inferred in Section 2). A logical block diagram representation of the IPCEA algorithm is shown in Figure 3.
Figure 3. Logical block diagram representation of the IPCEA algorithm.
The solar PV power generation, load demand, and battery SoC are given as the input. The PNTP, Net Transferable Power (NTP) at DC bus after feeding DC loads, and the BESS demand are obtained, and the expression is shown below.
 PNTP=Ppv(PBC+PDCL)
where
  • PNTP—Net transferable power at DC side
  • PPV—Power from PV array
  • PBC—Battery Charging Power
  • PDCL—DC power load demand
If PNTP is positive and greater than 20%, then the U1 is switched ON and the solar power from the DC side is fed into the AC bus to meet the AC load demand. The import or export of power within the utility grid is performed based on the load requirement and PNTP availability. If PNTP is not sufficient, then U2 (T1) is turned ON. Here, the Power (known to be inefficient) is fed into an auxiliary battery for storage. PNTP is checked if is less than zero; if this is valid, we check whether the power required by the DC side is less than 20% of the converter rating (meager requirement). If this is the case, then the DC loads are fed from the battery storage if the SoC is above 50%. A level of 50% SoC is considered safe enough to avoid deep discharge [4][5]. Hence, if the SoC is found to be less than 50%, then the utility power is drawn to meet the DC-side load demand. If the DC side demands more than 50%, power is driven from the utility grid by switching ON the switch U1. In this case, the converter works as a rectifier in this operation mode.

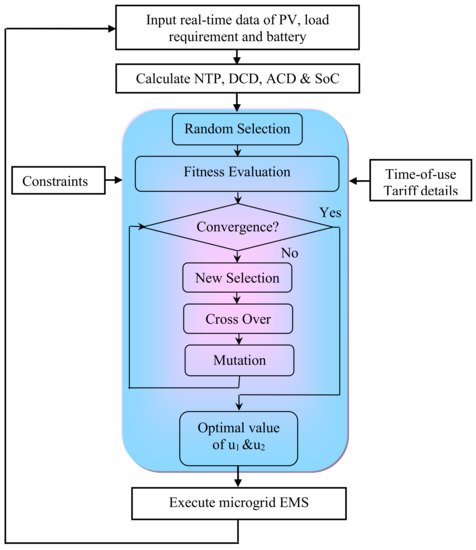
4. Genetic Algorithm for Cost Minimization

The IPCEA can minimize the conversion losses effectively, but to reduce energy costs in the region with a time-of-use tariff system requires the optimization of energy distribution. In this study, a Genetic Algorithm (GA)-based optimization technique was used for cost reduction. This was achieved in four steps.
  • Step 1: The input parameters include instantaneous solar PV power, AC- and DC-side load demand, and the battery’s state of charge.
  • Step 2: Calculation of NTP using Equation (10) and load demands using real-time data.
  • Step 3: Execution of the genetic algorithm.
The objective function of the system for cost minimization is defined as
MinJ=t=0TPGS(t)*CGS(t)
PGS(t)=PACD(t)+PConvu1+PDCD(t)+PBL(t)u2PPV(t)
where
  • PGS—Grid-side power
  • CGS—Cost of the grid power
  • PACD—AC-side power demand
  • PConv—Power loss across converter
  • PDCD—DC-side power demand
  • PBL—Power loss across battery
  • PPV—Power from PV array
where u1 is the switching command to operate the switch SU to connect the AC and DC buses for power transfer. Its value is
u1={1 0 
 
u2 is the switching command to connect the battery with the DC bus, which takes the value
u2=⎧⎩⎨⎪⎪1 Chargingmode  0 Float mode 1 Dischargingmode
 
The modes are operated in the following format:
Charging Mode: The battery is placed in charging operation mode where S1 and D2 conducts; the battery charges to the required level.
Float Mode: In this mode, the battery does not exchange power with the network. It merely stays connected in the line. Further, it receives a minimum current to maintain the charge in its state.
Discharging Mode: In this mode, S2 and D1 conduct and the battery power is utilized to meet the load demand. The S2 modes are enabled concerning the SoC of the battery.
The constraints used for achieving cost minimization and inefficient power conversion reductions are as follows:
  • SOC limits: 90%>SoC(t)>50%
  • Power transfer switch u1 enabled if PNTP&PDCD>20% of PCR
  • When PNTP<20% and PDCD<20%, switch u2 is enabled to access the battery power.
The flow diagram of the genetic algorithm used for the realization of IPCEA is shown in Figure 4. GA is used to optimize the power distribution in the microgrid such that the electricity cost is minimized.
Figure 4. Flow chart of the GA-based microgrid energy management system.
The GA execution is as follows:
  • Selection of population (random, size = 50).
  • Fitness evaluation (Individual).
  • Check for criterion satisfaction.
  • If the condition is not satisfied, another new population set is selected (roulette wheel selection).
  • Go for cross-over (single cross-over).
  • The mutation rate is fixed as 0.2.
  • Check for convergence.
  • Step 4: Execution of microgrid energy management.
The developed control algorithm generates a reference signal based on the threshold limits and the actual power availability for microgrid energy management. It produces control signals to actuate the converter operation during power transfer. Further, it delivers power transfer with the utility grid.

This entry is adapted from the peer-reviewed paper 10.3390/su132413882

References

  1. How to Determine Transformer Efficiency? Electrical Engineering. Available online: https://www.engineeringenotes.com/electrical-engineering/transformer/how-to-determine-transformer-efficiency-electrical-engineering/27945 (accessed on 23 March 2021).
  2. What Is the Effect of under Load Transformer for Energy Losses? Electrical Engineering. Available online: https://www.researchgate.net/post/what_is_the_effect_of_underload_transformer_for_energy_losses (accessed on 16 June 2021).
  3. Suresh, K.; Devishree, J. Evaluation of transformer loading and energy loss for increasing energy efficiency in distribution system. In Proceedings of the 12th International Conference on Electrical Engineering/Electronics, Computer, Telecommunications and Information Technology (ECTI-CON), Hua Hin, Thailand, 24–27 June 2015.
  4. Zeh, A.; Müller, M.; Naumann, M.; Hesse, H.; Jossen, A.; Witzmann, R. Fundamentals of Using Battery Energy Storage Systems to Provide Primary Control Reserves in Germany. Batteries 2016, 2, 29.
  5. Hesse, H.C.; Schimpe, M.; Kucevic, D.; Jossen, A. Lithium-Ion Battery Storage for the Grid—A Review of Stationary Battery Storage System Design Tailored for Applications in Modern Power Grids. Energies 2017, 10, 2107.
More
This entry is offline, you can click here to edit this entry!
Video Production Service