Green hydrogen was first found in the UK by Robert Boyle in 1671 when he described ‘flammable air’. In 2022 Green hydrogen was prioritised by UK Government to replace fossil hydrogen and other carbon intensive fuels. Fossil hydrogen UK production then exceeded 1Mte/a, but this should fall significantly by 2030, overtaken by green hydrogen. The University of Birmingham revealed the first UK green hydrogen refueller in 2008 filling five hydrogen-fuel-cell-battery-electric-vehicles (HFCBEVs) for study and development by 50 PhD students in Chemical Engineering. This supplied 10 kg/day, much smaller than the 2021 ITM station now to deliver almost 600 kg/day at Tyseley.
- green hydrogen
- hydrogen energy
- hydrogen fuel cell battery electric vehicles (HFCBEVs)
- zero emission
- energy consumption versus weight
- clean air zone (CAZ)
- climate emergency
1. Introduction
Green hydrogen [1] was seen first by Paracelsus [2]. Simple experiments, dissolving metals like zinc in acid, produced bubbles of gas which differed from air. This gas was green because fossil fuel had not been involved in metal manufacture at that time. Instead, renewable charcoal was used. Then In 1671, Robert Boyle [3] observed the same gas when stirring iron filings in dilute acid, before Henry Cavendish [4] described the green hydrogen properties in detail in three 1766 papers. He showed that water could be made by burning this ‘factitious air’ ie man-made gas, but he did not have the correct theory, later announced by Lavoisier in 1783. Soon after, Nicholson and Carlisle showed that passing electricity through water split it into hydrogen and oxygen, but this was probably ‘grey hydrogen’ (fossil hydrogen) because the metal plates in the voltaic battery were probably made using coal, which is not green. Metal production was changing fast since Abraham Derby in 1709 first showed how charcoal could be replaced by coke. This was the start of our ‘Global Warming Experiment’ based on carbon containing fossil fuels which we are now trying to remove, as shown in Figure 1.
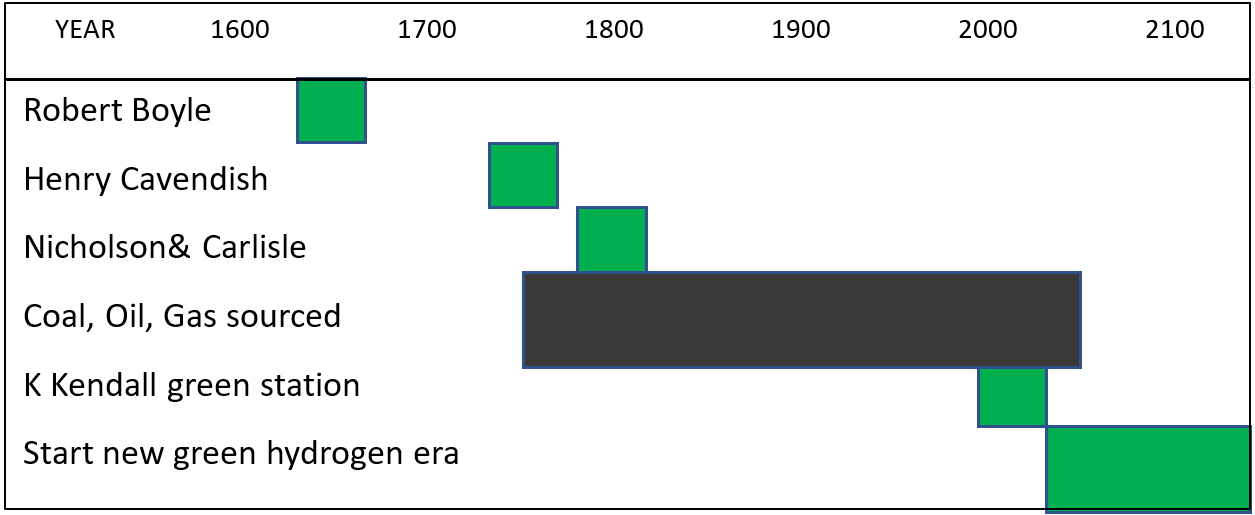
Figure 1. Chart showing the progress of green and grey hydrogen with time.
Figure 1 shows that grey hydrogen is a 300year blip which can be overcome by switching to green hydrogen as a major energy source in this century. Global coal should peak soon at 8Gte/a while oil and gas-based fuels should also peak near 5Gte/a, with solar, wind, hydro and green hydrogen then supplying our energy needs. Last century, oil and gas replaced coal as the main source of UK hydrogen, because steam reforming developed by BASF in 1913 began to operate in Billingham in 1936 [5]. Now, after the 2021 decision [6] by the UK government to move towards green hydrogen to allay the Climate Crisis, putting it above nuclear but behind wind in the strategy, individual cities like Birmingham are planning to grow green hydrogen before 2030. The next sections describe this movement, which involves replacing diesel and other fossil fuels that dominate every aspect of our lives at present.
2. Green Hydrogen Defined
Green hydrogen is not simple, as you can discover by considering a trip to the pub to drink beer. On exit, a police constable may deploy his breathalyser [7], one of the earliest commercial fuel-cell products made by Lion Laboratories during the 1980s, to measure your blood alcohol level. Your breath flows over a proton conducting membrane coated with platinum catalyst, while air is on the other side of the catalytic membrane. The alcohol reacts to form ethanoic acid, releasing electrons to a circuit that measures the electric current to read blood alcohol concentration. At the same time, a proton travels through the membrane to react with oxygen on the other side, forming water. The question is ‘How green is your breath alcohol?’
You may believe that this ethanol is green because there is no fossil fuel involvement. But if we consider the barley used to make the beer, we find that one hectare of farm-field gives 5 te of product, equivalent to 50 GJ of energy. Ploughing, seeding, weeding, spraying and harvesting the field using tractors demands much fossil diesel, requiring approximately 25 GJ of energy. 5MJ more are needed to process the beer, ship it and heat the pub. It is a revelation to find that the alcohol in your breath is more than 50% fossil. This all began before 1900 when tractors were demonstrated by Hornsby using new combustion engine patents before Diesel made his invention [8]. By 1918, many such machines had replaced horses and Britain adopted fossil-driven agriculture. Less than 1% of the UK population now work on the land, releasing human resources to create innovation.
Agriculture is a relatively small 8% contributor to fossil CO2 in the UK, so four larger CO2-emitting sectors must be prioritised. Industry and waste account for almost double the agriculture emissions. Next comes the electrical grid at 18% of UK carbon but that has significantly improved since wind turbines have multiplied, with England generally being about 50% green in 2021, but fluctuating as renewables, such as wind and solar, vary with time. Green hydrogen produced from the grid is beneficial because it can cut the peaks and store excess wind energy to stabilise the system. Scotland is much better at around 98% green grid. A major problem sector is the heating of buildings, demanding 25% UK fossil carbon, where natural gas has dominated since 1968, so it is difficult to change. Yet, in 2020, Keele University showed that 20% green hydrogen could be injected into their private gas-pipe system to reduce fossil fuel usage through the HyDeploy project [9]. Most important, the overriding 35% fossil CO2 problem in the UK is transport, which increases every year and mainly uses fossil oil and gas to propel cars, buses and trucks. This is the sector that can rapidly be improved through concerted action using green hydrogen in city centres first, then spreading outside the Clean Air Zones (CAZs). It is important here to ignore 10% fossil carbon in imports, and also to avoid the distraction of UK Government exercises to define Net-Zero Hydrogen (NZH), which is ‘Hydrogen that releases 20 g of fossil CO2 for every MJ of hydrogen product’ [10]. It appears that, at first sight, this hydrogen is nowhere near green.
3. Birmingham Clean Air Zone
The UK has had coal pollution in city atmospheres for millenia. As early as the 13th century, London imposed smoke sanctions because coal fires were ‘prejudicial to health’. The UK Clean Air Acts of 1853, 1856, 1956 and 1968 had an effect on carbon particles and sulphurous smogs, but failed to consider the less visible toxic emissions, like CO, CO2 and NOx. Los Angeles whose smog originated largely from vehicle fuel pollution, so bad in the 1940s that legislation was imposed, defined more carefully the noxious gases and fine particles. CARB (California Air Resources Board) was formed in 1967 to study and cut emissions, recognising that combustion had baleful effects, ultimately mandating catalytic clean-up of gasoline vehicle exhausts in the 1970s, twentyfive years ahead of the UK.
Now in 2020, UK has stated combustion engines must be replaced by electric drive, banning new combustion vehicle sales in 2030. A key incentivisation step for green hydrogen has been the Clean Air Zone (CAZ) starting in Birmingham in 2021, coinciding with the delivery of 20 hydrogen fuel cell battery electric vehicle (HFCBEV) buses to replace the standard diesel double-deckers. This design extends the original Ballard bus invented in Vancouver during 1993, powered by a hydrogen fuel cell, akin to the breathalyser in its operating principles. Penalties are issued to drivers of cars (GBP 8/day) and trucks (GBP 50/day) that are defined as polluting. The problem is that polluting emissions from vehicles are not measured in the CAZ. Only vehicle age is deemed important.

Figure 2. left: First hydrogen bus arriving in Birmingham in July 2021; right: Birmingham Clean Air Zone (CAZ).
Figure 2 shows the first of these Zero-Emission Vehicles (ZEV buses) arriving in the CAZ, with 124 more being expected soon. By removing diesel exhaust fumes from the CAZ, air quality must increase. However, the logic of the CAZ legislation is faulty. There is no doubt that heavier vehicles produce more emissions, and this is embodied in the six-times-higher penalties for heavy-goods vehicles and buses. However, Birmingham has adopted the ludicrous EU policy that emissions depend on the age of the vehicle. Volkswagen proved that idea wrong by selling many new vehicles with emissions 40 times higher than the regulations. In all the CAZ reports since the start of June 2021, emissions are neither mentioned nor measured. It turns out that the CAZ is a dilution zone that moves dirty vehicles onto the ring road. It does little to encourage zero emissions and does not mention the great need for electric vehicles. It has been clear since the King Review in 2007 [11] that the electric vehicle, whether battery electric (BEV) or hydrogen fuel cell (HFCBEV), can eliminate both toxic emissions and fossil CO2. If the CAZ regulations inserted CO2 as a toxic emission with penalties, similar to NOx, SOx, CO, VOCs and particulates, then the integration of CAZ and low carbon could be completed. It is essential in the future that the CAZ incentivises electric drive rather than penalising old vehicles. Total electric vehicle registrations in the UK approached 1% of the total vehicle population in 2021, so this needs to improve by two orders of magnitude by 2030 to satisfy UK government targets.
Unfortunately, Birmingham has followed the London zone model, which started in 2003, failing to eliminate either carbon dioxide or toxic air in its 19-year existence. GBP250M of penalties were collected in 2020, but many citizens are still dying on the London streets because of bad policy [12], which fails to address emissions in a rational way. Fossil fuels, such as diesel, are so embedded in UK civilization that enormous amounts of green hydrogen will be required in the future to eradicate the CO2 problem and climate emergency. 2.2 Mte of diesel fuel were used in the UK in 2017 [13]. Hydrogen required to fully replace this is a factor 6 less for two reasons: Firstly, HFCBEVs travel twice as far at the same weight (see Figure 4) so only half the energy is needed for these new vehicles; secondly, hydrogen has three times more energy than diesel per kg of mass. Consequently, the UK needs about 400,000 te/a of green hydrogen to solve the diesel problem for heavy transport. Taking into account the energy losses in a typical large electrolyser, this is only 4 GW of electrical power, so by 2030, when the UK government has targeted 5 GW of green hydrogen from wind, the diesel emission problem could be eliminated. Much more green hydrogen will be required to replace petrol, natural gas and other fossil fuels that are used in larger quantities than diesel, giving a longer-term UK target for green hydrogen production rate around 50 GW.
4. Green Hydrogen Demo in Birmingham
The first UK green hydrogen station was revealed in Chemical Engineering at the University of Birmingham in 2008. It was used to refuel five hydrogen fuel cell battery electric vehicles (HFCBEVs) shown in Figure 3. During 2007, Professor Kendall sought quotes for green hydrogen from gas companies, such as Shell, BOC and Air Products. The reaction was negative: ‘There is no market for green hydrogen; we cannot supply’. Consequently, a biomass company was contacted and agreed to generate electricity from biogas, then electrolyse water to produce hydrogen that was shipped to Birmingham in steel cylinders. The gas was compressed to 400 bar to refuel the Microcab vehicles through the Air Products dispenser (Figure 3). Although the green hydrogen cost was high, around GBP 30/kg, the project objective was to propel the cars without recourse to fossil fuel, preventing further energy loss caused by converting fossil molecules to hydrogen. Then, the improved performance of the HFCBEVs, compared to fossil-fuel cars, could be proved by 50 PhD students recruited in 2009 on an EPSRC Doctoral Training Centre programme.
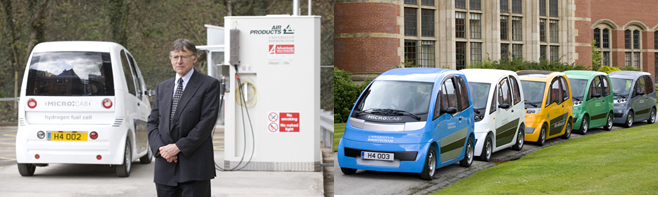
Figure 3. left: Prof Kendall opening the 2008 first green hydrogen station in UK; right: Five Microcab HFCBEVs for research studies on University of Birmingham campus.
To demonstrate the improved energy performance of the five Microcabs [14], compared to conventional petrol cars, standard-drive cycles were performed and the energy consumption per km was measured in MJ, as shown in Figure 4, to contrast with 3800 different types of petrol cars used in China from 2000 to 2010. The surprising result was that the energy consumption was linearly dependent on the vehicle weight, despite substantial scatter of the 3800 data points. For many years, it has been known that heavier vehicles demand more energy per kilometre driven, but the explanation had not been discovered. Additionally, electric vehicles were known to travel further per MJ than combustion vehicles, but this had previously been analysed in terms of ‘vehicle efficiency’, which turns out to be a false idea. It is very misleading to claim that a battery car is 90% efficient, as is often stated. The battery itself may be tested under certain conditions to show that its electrical energy is cycled with 90% efficiency, but the whole vehicle presents a very different picture of energy losses by numerous mechanisms.
When properly analysed [15], vehicle efficiency is zero in the fuel consumption standard test measuring litre/100 km (or MJ/km in this research). All the energy injected into the motion of a vehicle during a drive cycle is lost because the vehicle is stationary at the start and finish. Thus, the common statement that an electric car is more efficient than a petrol car is incorrect because each vehicle has zero efficiency in the fuel-consumption drive cycle. The differences in fuel consumption for heavier combustion vehicles must be explained in terms of numerous energy dissipation mechanisms, for example, energy lost in heating the cabin, friction loss in the tires, viscous loss in air flowing around the vehicle etc. Many of these mechanisms are identical for both combustion and electric vehicles, and so produce similar losses, whatever the drive train.
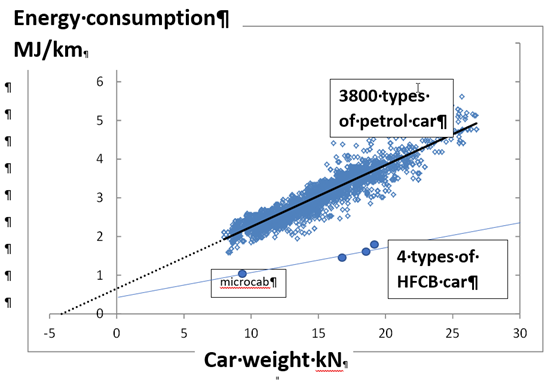
Figure 4. Energy consumption for each km travelled plotted for thousands of different vehicles, showing that energy losses depend linearly on weight, with hydrogen fuel cell battery vehicles (HFCBEVs) wasting only half the combustion car energy in the standard drive cycle.
The striking feature of the results in Figure 4 is the straight lines fitting the results, reminiscent of Coulomb’s friction law [15], with energy losses linear in weight. There are many frictional losses in a complex vehicle, including brake loss, tire loss and bearing losses. However, losses in cabin heating are almost independent of vehicle weight, tire friction is proportional to weight while air resistance is non-linear in weight. By identifying ten separate energy-loss mechanisms and adding them together, it was found that the resultant sum was linear and fitted the results of Figure 4. This allowed the losses of combustion vehicles to be rationally compared with losses in four kinds of pre-production hydrogen fuel cell battery electric vehicles (HFCBEVs) shown in the lower line of Figure 4. It was interesting to demonstrate that HFCBEVs had around half the energy losses of the combustion vehicles in this standard drive cycle test. Pure battery electric vehicles (BEVs) fell approximately on this same line, showing that there was little advantage in energy losses for BEVs compared to HFCBEVs. Elon Musk sells lithium battery cars and has said that hydrogen vehicles are ‘mind bogglingly stupid’ but he is wrong because both BEVs and HFCBEVs, both superior to combustion engines, follow the same electrochemical laws [1].
The competition between the pure battery electric vehicle (BEV) and the fuel cell (HFCBEV) remains unresolved, but the BEV is marginally better because the line plotted for a number of BEVs falls a few percent below the HFCB line in Figure 4. This can be attributed to the differences between lithium and fuel cell electrode catalysts. However, while BEVs have improved since 2010, the lithium batteries carry 50 times less energy per kg than gasoline. Range is therefore limited and charging times remain high, even when expensive high-power chargers are installed. The main advantage in hydrogen fuel cell battery electric vehicles (HFCBEVs) is that range can be increased by inserting more cylinders, with rapid refuelling in 5 to 10 min, lighter in weight and more economic than lithium batteries. Only HFCBEV buses can compete with existing diesel buses at the present time, since BEV buses have typically one third of the range due to 70% less energy stored in lithium batteries than in same-weight hydrogen cylinders. A confusing issue is that BEV buses with 324 kWh storage (e.g., BYD K9) are said to be equivalent to HFCBEV buses with 900 kWh storage (e.g., Wrightbus in Figure 2, clearly untrue.
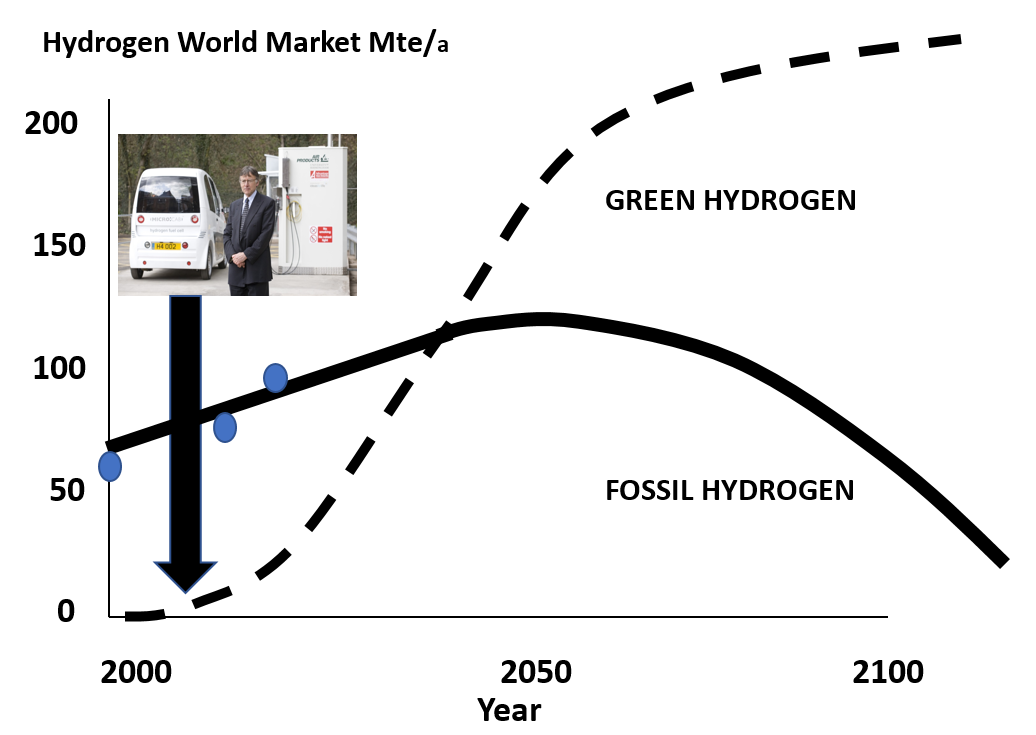
Figure 5. Schematic picture of global hydrogen production from 2000 onwards. The accepted numbers [17] for 2022 are shown as circular points, approximately fitting the line showing fossil hydrogen still increasing from 70 Mte/a to 100 Mte/a by 2050, followed by a gradual decline as green hydrogen overtakes it to magnify the whole hydrogen market by a large factor as new applications appear, ultimately reaching hundreds of Mte/a (estimated from UK government predictions).
5. Forward Plan
At present, there are four UK locations focusing on the rapid expansion of green hydrogen production, delivery and downstream applications. These regions are Birmingham CAZ, Aberdeen, Tees-Valley and Liverpool–Manchester. The objective is to build green hydrogen projects at an increasing scale. This demands the matching of supply and consumer demand that includes buses, trucks, vans, taxis and other highly utilised vehicles. In 2021, most UK green hydrogen was generated on-site by grid-electrolysis in stations developed by companies such as ITM Power in Rotherham, Birmingham, Beaconsfield and similar sites. Such installations are expensive to install and run, but have been important in stimulating early action, despite being unreliable and stranded without sufficient vehicle demand. Figure 5 shows how this green hydrogen production has been increasing globally, compared to the much larger amount of fossil hydrogen produced on petrochemical refinery sites. Large companies, such as Air Liquide, have claimed they will move to green hydrogen by 2050, with larger electrolysers 200 MW in scale [16]. ITM Power is on a parallel track in the UK, having recently completed its mega-factory with a claimed annual capacity of 1 GW, about 200,000 te/a of hydrogen production. The challenge here is that the oxygen is vented, wasting half the product and causing high prices, which cannot easily compete with other green hydrogen sources, such as biorefining, which produces a number of valuable by-products that can be economically utilised as well [17].
The difficulty is planning the hydrogen vehicle markets to expand at the same rate that green hydrogen is produced. One Chinese city, Foshan, achieved this by manufacturing 1000 hydrogen buses to match the installation of 10 city stations [18]. This is the path adopted in Birmingham, UK, where hundreds of buses (Figure 2) are being ordered to justify the installation of six hydrogen stations around the ring road. Building infrastructures prematurely, as both Japan and Germany have done to obtain hundreds of stations across their countries, leads to stranded assets that fail economically. Private vehicles, such as taxis, vans and trucks, are also needed, but are less predictable, so can be allowed to increase organically as the bus backbone is expanded. One novel HFCBEV manufactured in Birmingham is the Microcab taxi/van (Figures 3, 5 and 6) that was created by Jon Jostins in 2004, then further developed and improved since 2012, when the EU SWARM project was initiated with a plan to build a hydrogen highway from Birmingham to Germany. Although that infrastructure concept was premature, the Microcab idea has been proved over ten years and will be an important contribution to green hydrogen demand in the Birmingham CAZ.
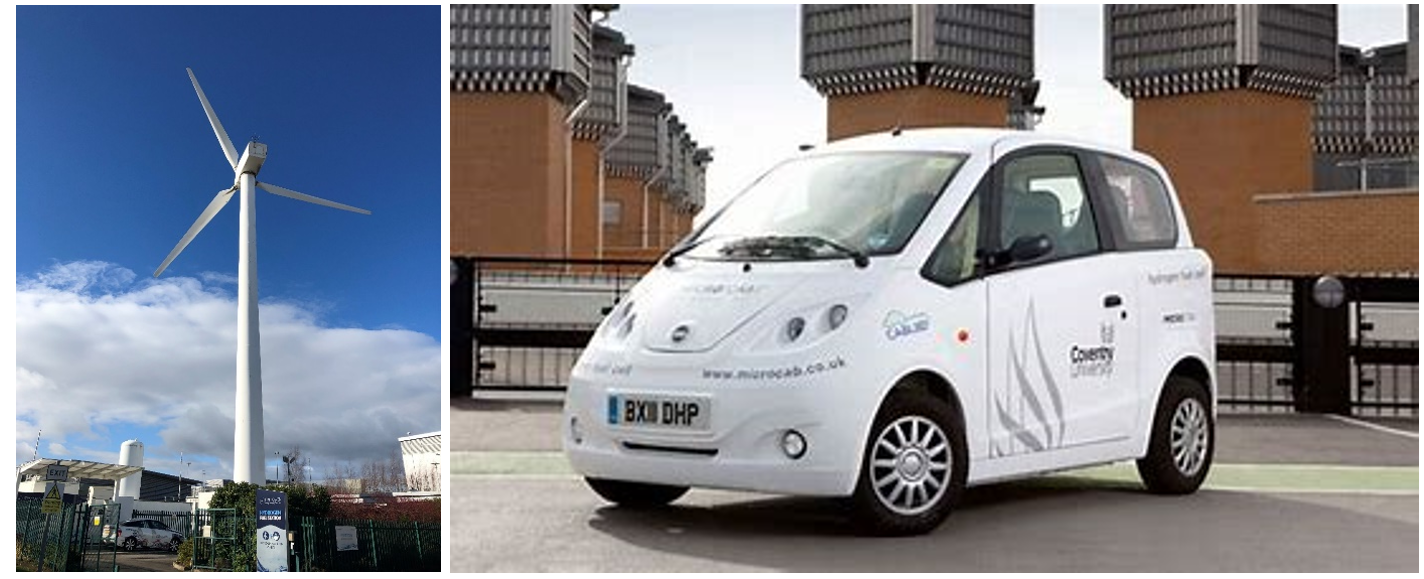
Figure 6. left: Rotherham hydrogen station based on wind turbine electrolysis; right: Microcab for taxi fleet to utilise the hydrogen asset.
Driving an HFCBEV, it is important to check whether the stations are working; for example, you can call Rotherham and receive access [19]. Because these stations were built without a proper vehicle plan to use the hydrogen, money has been lost, stations idle, and opportunity wasted. Remember, Tesla had to build its own battery charging infrastructure because UK Grid was inept. The present UK objective is to position several new profitable green hydrogen stations around Birmingham city CAZ by 2025. Repeating this plan over 80 UK conurbations could then provide connected economic hydrogen infrastructures across the country by 2030. Without profit, this exponential growth cannot occur. This is illustrated by Germany where political funding allowed 93 stations to start. But they have partly stalled because they lose money and are underutilised. Most importantly, the future stations must be green hydrogen, which is not usual in Germany (about 30% green), and a problem in England because electrolysers operating on grid electricity are only about 50% green at the present time, while also proving to be expensive.
The solution is illustrated in Figure 6 which shows a wind turbine hydrogen station built by ITM in Rotherham, together with a HFCBEV fleet possibility using Microcabs that have never yet been ordered. A wind turbine at Rotherham produces green electricity to electrolyse water, making green hydrogen that is stored on site when excess wind is blowing. By contrast, the Birmingham station currently obtains its power from the electrical grid and claims it is green, which is not easily confirmed because the English grid is half fossil.
Another snag is that many of the station components are made using fossil fuel that should be taken into account to present the full picture of green energy in the cradle-to-grave assessment. As green hydrogen becomes a dominant energy source for manufacturing steel, cement, carbon fibre and other components, this snag will be reduced, but that could take decades of further effort.
6. Conclusions
The priority issue in the UK is green hydrogen to replace more than 1 Mte/a of fossil hydrogen currently produced in petrochemical plants. Solving this problem will have a major influence on fossil-fuel transport that is currently causing unhealthy air pollution plus carbon emissions/climate change [20].
Heavy-duty vehicles, such as buses, trucks, vans and taxis, should be changed to hydrogen fuel cell battery electric vehicles (HFCBEVs). Replacing all such combustion vehicles could prevent many deaths and illnesses in cities, while removing up to 35% of UK fossil CO2 emissions. To date, UK battery electric vehicle (BEV) registrations reached almost 1% penetration in 2021, but hydrogen fuel cell battery electric vehicle (HFCBEV) numbers are still 1000 times lower. Heavier vehicles, such as buses and trucks that are highly utilised, need hydrogen because battery storage is too heavy, expensive and slow to recharge. By 2030, it is expected that BEVs and green hydrogen vehicle populations will have increased to 100,000 in Birmingham, substantially reducing CO2 and other emissions. Fifty other UK cities should then follow this leading location because profits and citizens will be incentivised.
Clean Air Zones (CAZs) are vital because they can encourage the change to green hydrogen, and prove to citizens that this new fuel, with electrified drive train, will improve quality of life throughout Britain. Around 1Mte/a of UK green hydrogen (4 GW continuous production) is needed to make this radical change, starting from near zero in 2020.
Until 2022, the UK has lagged behind the USA, Germany, Japan and China, but the integrated and educated democratic population in the UK can readily surge past its competitors, having now recognised the major benefits of using profitable green hydrogen, replacing fossil fuels in transport, to produce zero carbon transport together with clean air.
This entry is adapted from the peer-reviewed paper 10.3390/cleantechnol4020020
References
- Kendall, M.; Kendall, K.; Lound, A.P.B. Hystory: The Story of Hydrogen; Adelan: Birmingham, UK, 2021.
- Rigden, J.S. Hydrogen: The Essential Element; Harvard University Press: Cambridge, MA, USA, 2003; p. 10.
- Boyle, R. Tracts Written by the Honourable Robert Boyle Containing New Experiments, Touching the Relation Betwixt Flame and Air . . . ; Davis Publications: London, UK, 1672.
- Cavendish, H. Three Papers Containing Experiments on Factitious Air; Philosophical Transactions of the Royal Society the University Press: London, UK, 1766; Volume 56, pp. 141–184.
- Brightling, J. A Long History in Steam Reforming at Billingham. Nitrogen+ Syngas 2014, 327, 46.
- UK Hydrogen Strategy, Department for Business, Energy & Industrial Strategy. 2021; p. 121. ISBN 978-1-5286-2670-5. Available online: https://assets.publishing.service.gov.uk/government/uploads/system/uploads/attachment_data/file/1011283/UKHydrogen-Strategy_web.pdf (accessed on 20 February 2022).
- Breathalyser. Wikipedia. Available online: https://en.wikipedia.org/wiki/Breathalyzer (accessed on 20 February 2022).
- Stuart, H.A.; Binney, C.R. Improvements in Engines Operated by the Explosion of Mixtures of Combustible Vapour or Gas and Air. Patent No 7146, May 1890. Available online: https://www.wikiwand.com/en/Herbert_Akroyd_Stuart (accessed on 20 February 2022).
- Hawke, D. Gas Network Innovation Competition. In Cadent Fourth Project Progress Report (PPR); HyDeploy, Keele University: Newcastle Under Lyme, UK, 2020.
- BEIS Consultation on UK Low Carbon Hydrogen Standard 1921, Designing a UK Low Carbon Hydrogen Standard-GOV.UK. Available online: http://www.gov.uk (accessed on 20 February 2022).
- King, J. The King Review of Low Carbon Cars; Part I /Part II; HM Treasury: London, UK, 2007.
- Khan, S. Mayor of London, Central London Ultra Low Emission Zone 2020 Report; Greater London Authority: London, UK, 2021.
- Available online: https://www.statista.com/statistics/616220/diesel-fuel-stock-uk/#:~:text=Diesel%20vehicle%20fuel%20 stock%20in%20the%20United%20Kingdom,figures%20increased%20by%20roughly%201.4%20million%20metric%20tons (accessed on 20 February 2022).
- Kendall, K.; Pollet, B.G.; Dhir, A.; Staffell, I.; Millington, B.; Jostins, J. Hydrogen fuel cell hybrid vehicles for Birmingham campus. J. Power Sources 2011, 196, 325–330.
- Kendall, K.; Shang, N.J.; Staffell, I. Application of Coulomb’s friction law to define energy consumption of new drive-trains. In Proceedings of the IET Hybrid and Electric Vehicles Conference 2013 (HEVC 2013), London, UK, 6–7 November 2013.
- Available online: https://www.h2-view.com/story/air-liquide-to-lead-200mw-flagship-green-hydrogen (accessed on 20 February 2022).
- Available online: https://www.iea.org/reports/global-hydrogen-review-2021 (accessed on 20 February 2022).
- Liu, Z.; Kendall, K.; Yan, X. China progress on renewable energy vehicles: Fuel cells, hydrogen and battery hybrid vehicles. Energies 2019, 12, 54.
- H2.LIVE: Hydrogen Stations in Germany & Europe. Available online: https://h2.live/en (accessed on 20 February 2022).
- 21 Kendall, K., Green Hydrogen in the UK: Progress and Prospects, Clean Technologies, 2022, 4, 345-355.