Human milk (HM) is considered the gold standard for infant nutrition. HM contains macro- and micronutrients, as well as a range of bioactive compounds (hormones, growth factors, cell debris, etc.). The analysis of the complex and dynamic composition of HM has been a permanent challenge for researchers. The use of novel, cutting-edge techniques involving different metabolomics platforms has permitted to expand knowledge on the variable composition of HM. Here, the state-of-the-art in untargeted metabolomic studies of HM, with emphasis on sampling, extraction and analysis steps is presented.
- human milk
- metabolome
- sampling
- extraction
- liquid chromatography–mass spectrometry
1. Introduction
2. Metabolite Extraction from HM
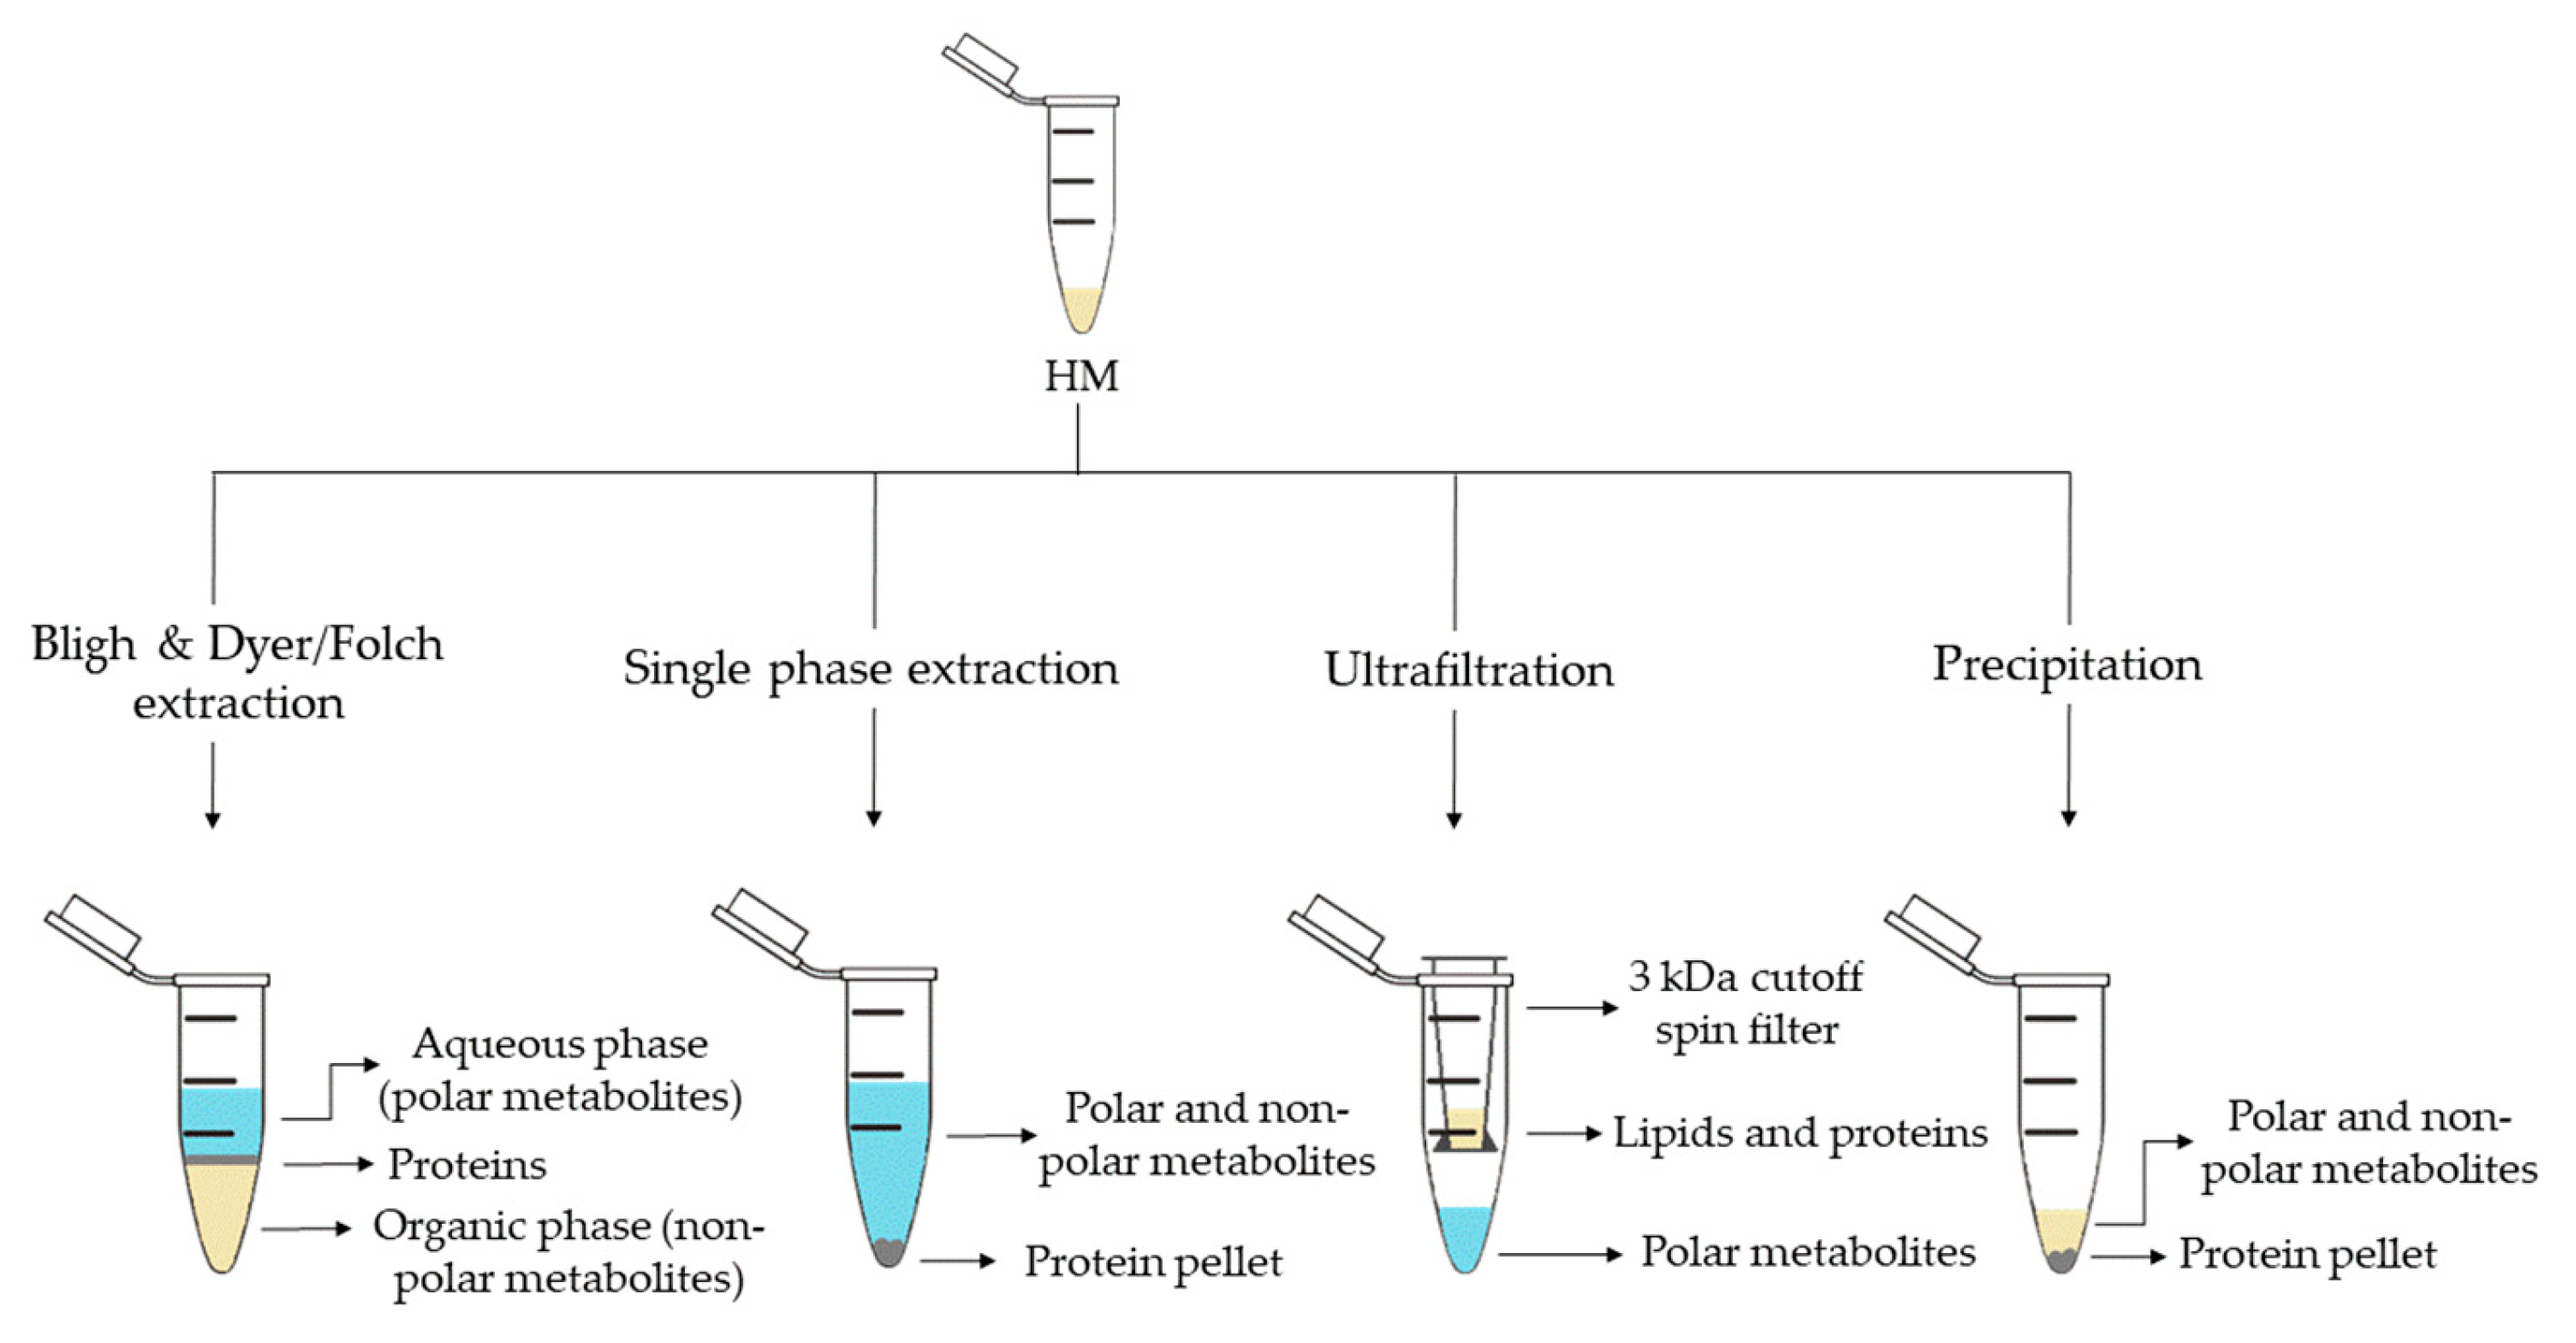
| Sample Preparation (1st. step) | Sample Preparation (2nd. step) | Compound Class | Platform | Column/Capillary | References |
|---|---|---|---|---|---|
| Bligh & Dyer extraction | Deuterated solvent addition to aqueous phase | Polar metabolites | 1H-NMR | - | [13][16][29][32] |
| Derivatization of aqueous phase: methoximation and silylation | Polar metabolites and FAs | GC-MS | DB-5ms | [17][18][19] | |
| Derivatization of organic phase: methylation | FAs | GC-MS | DB-5ms | [13] | |
| Direct injection of aqueous phase | Polar metabolites | LC-QTOF-MS (+) | HILIC | [35] | |
| Redissolution of aqueous phase in H2O:ACN (95:5) | Polar metabolites | LC-Orbitrap-MS (+, −) | C18 | [24] | |
| Redissolution of organic phase in (ACN:IPA:H2O (65:30:5) |
Lipidic metabolites | LC-Orbitrap-MS (+,−) | C18 | [25] | |
| Folch extraction | Deuterated solvent addition to aqueous and organic phases | Hydrophobic and polar metabolites | 1H-NMR | - | [28] |
| Redissolution of aqueous phase in formic acid and centrifugation | Polar metabolites (amino acids) | CE-TOF-MS (+) | 60 m × 50 µm I.D. | ||
| Redissolution of organic phase in IPA:H2O:ACN (2:1:1) and centrifugation | Lipidic metabolites | UPLC-QTOF-MS (+,−) | C18 | ||
| Single phase extraction | Derivatization: methoximation and silylation | Polar metabolites and FAs | GC-MS | DB-5ms | [27][28] |
| Direct injection | Lipidic (and polar) metabolites | LC-QTOF-MS (+,−) | C8 | [27][28] | |
| UPLC-QTOF-MS (+) | C18 | [15] | |||
| Fat extraction with n-hexane/IPA | Deuterated solvent addition | TGs | 13C-NMR; 1H-NMR | - | [20] |
| Filtration 3 kDa cutoff spin filter | Deuterated solvent addition | Polar metabolites | 1H-NMR | - | [14][21][22][29][33] |
| Protein precipitation | Derivatization: methoximation and silylation | Polar metabolites | GC-MS | DB-5ms | [36] |
| Hybrid SPE-Phospholipid extraction and redissolution in diluted organic phase of Bligh & Dyer extraction | Lipidic metabolites | LC-QTOF-MS (+) | C8 | [35] | |
| Fat removal with CH2Cl2 and dansylation of aqueous phase | Polar metabolites (amine/phenol submetabolome) | Chemical isotope labelling LC-QTOF-MS (+) | C18 | [39][40] | |
| Direct injection | Polar metabolites and FAs | UPLC-QTOF-MS (+,−) | C18 | [18] | |
| Fat removal by centrifugation | Two additional centrifugations and deuterated solvent addition | Polar metabolites | 1H-NMR | - | [34] |
| Filtration 10 kDa cutoff spin filter and deuterated solvent addition | Polar metabolites | 1H-NMR | - | [23][26] | |
| Homogenization | Deuterated solvent addition | Polar metabolites | 1H-NMR | - | [31] |
| H2O-dilution | NaBH4-reduction and PGC cartridge | Oligosaccharides | UPLC-TQD-MS (+) | Hypercarb® | [24] |
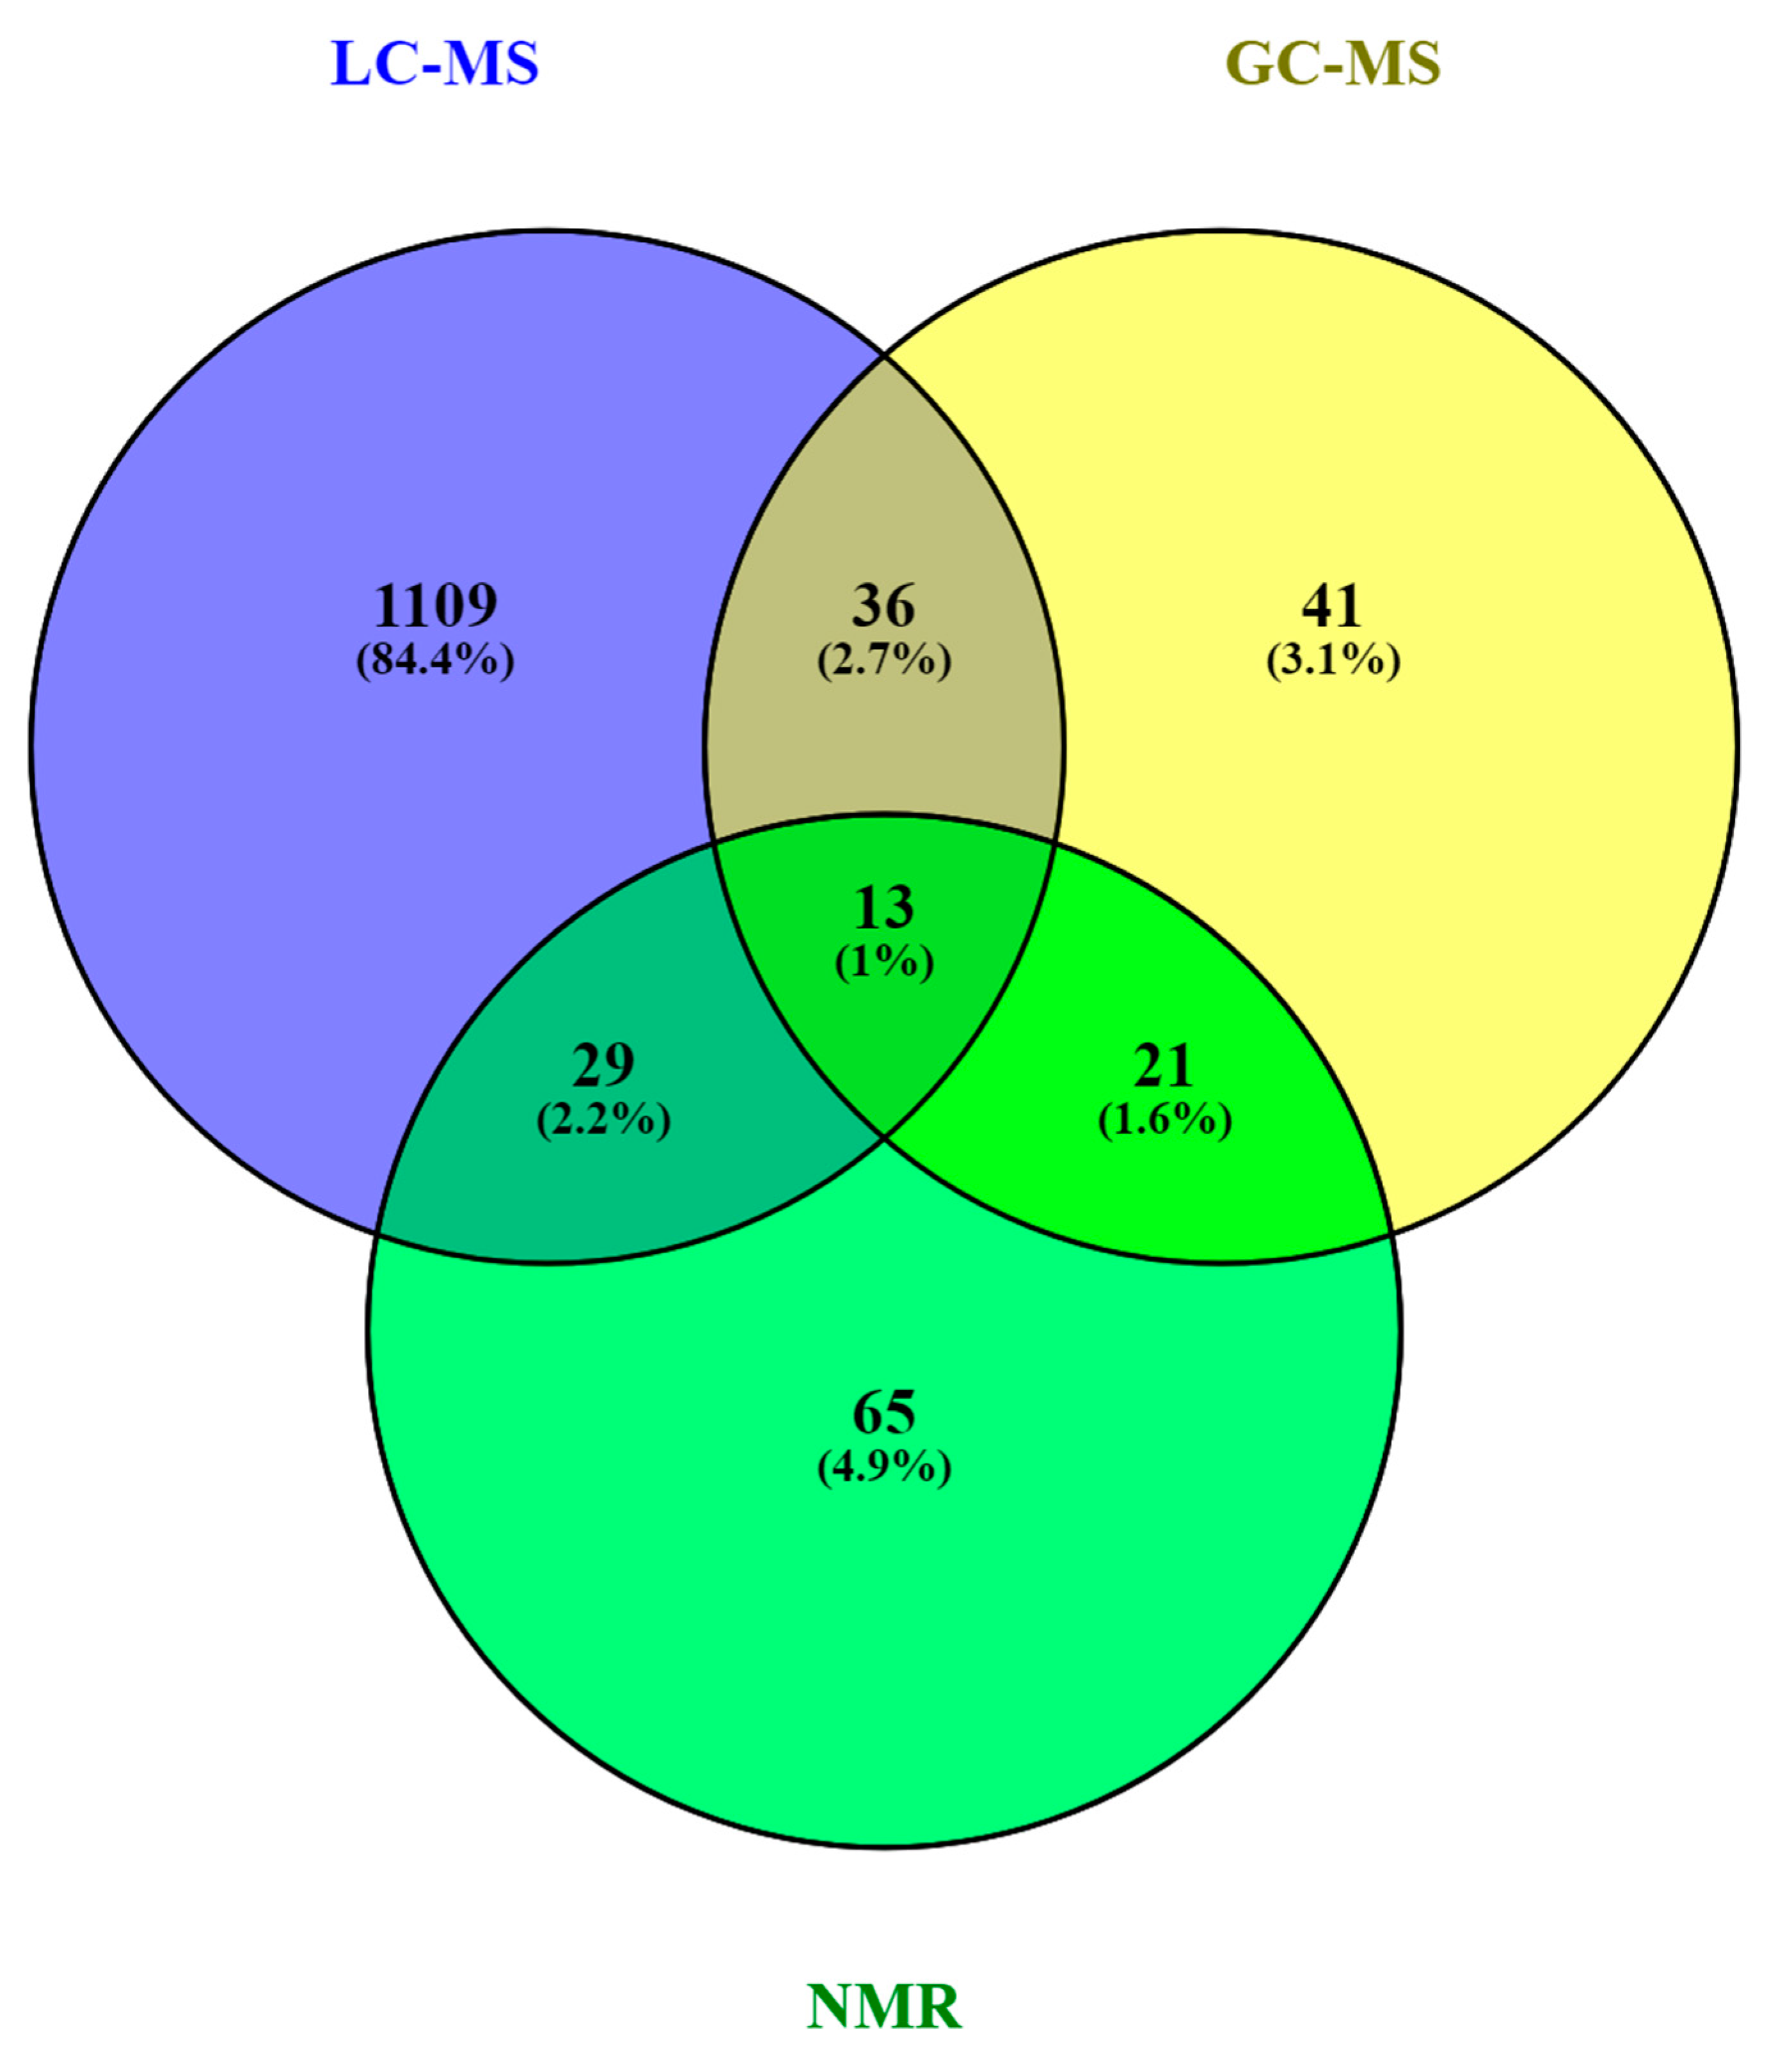
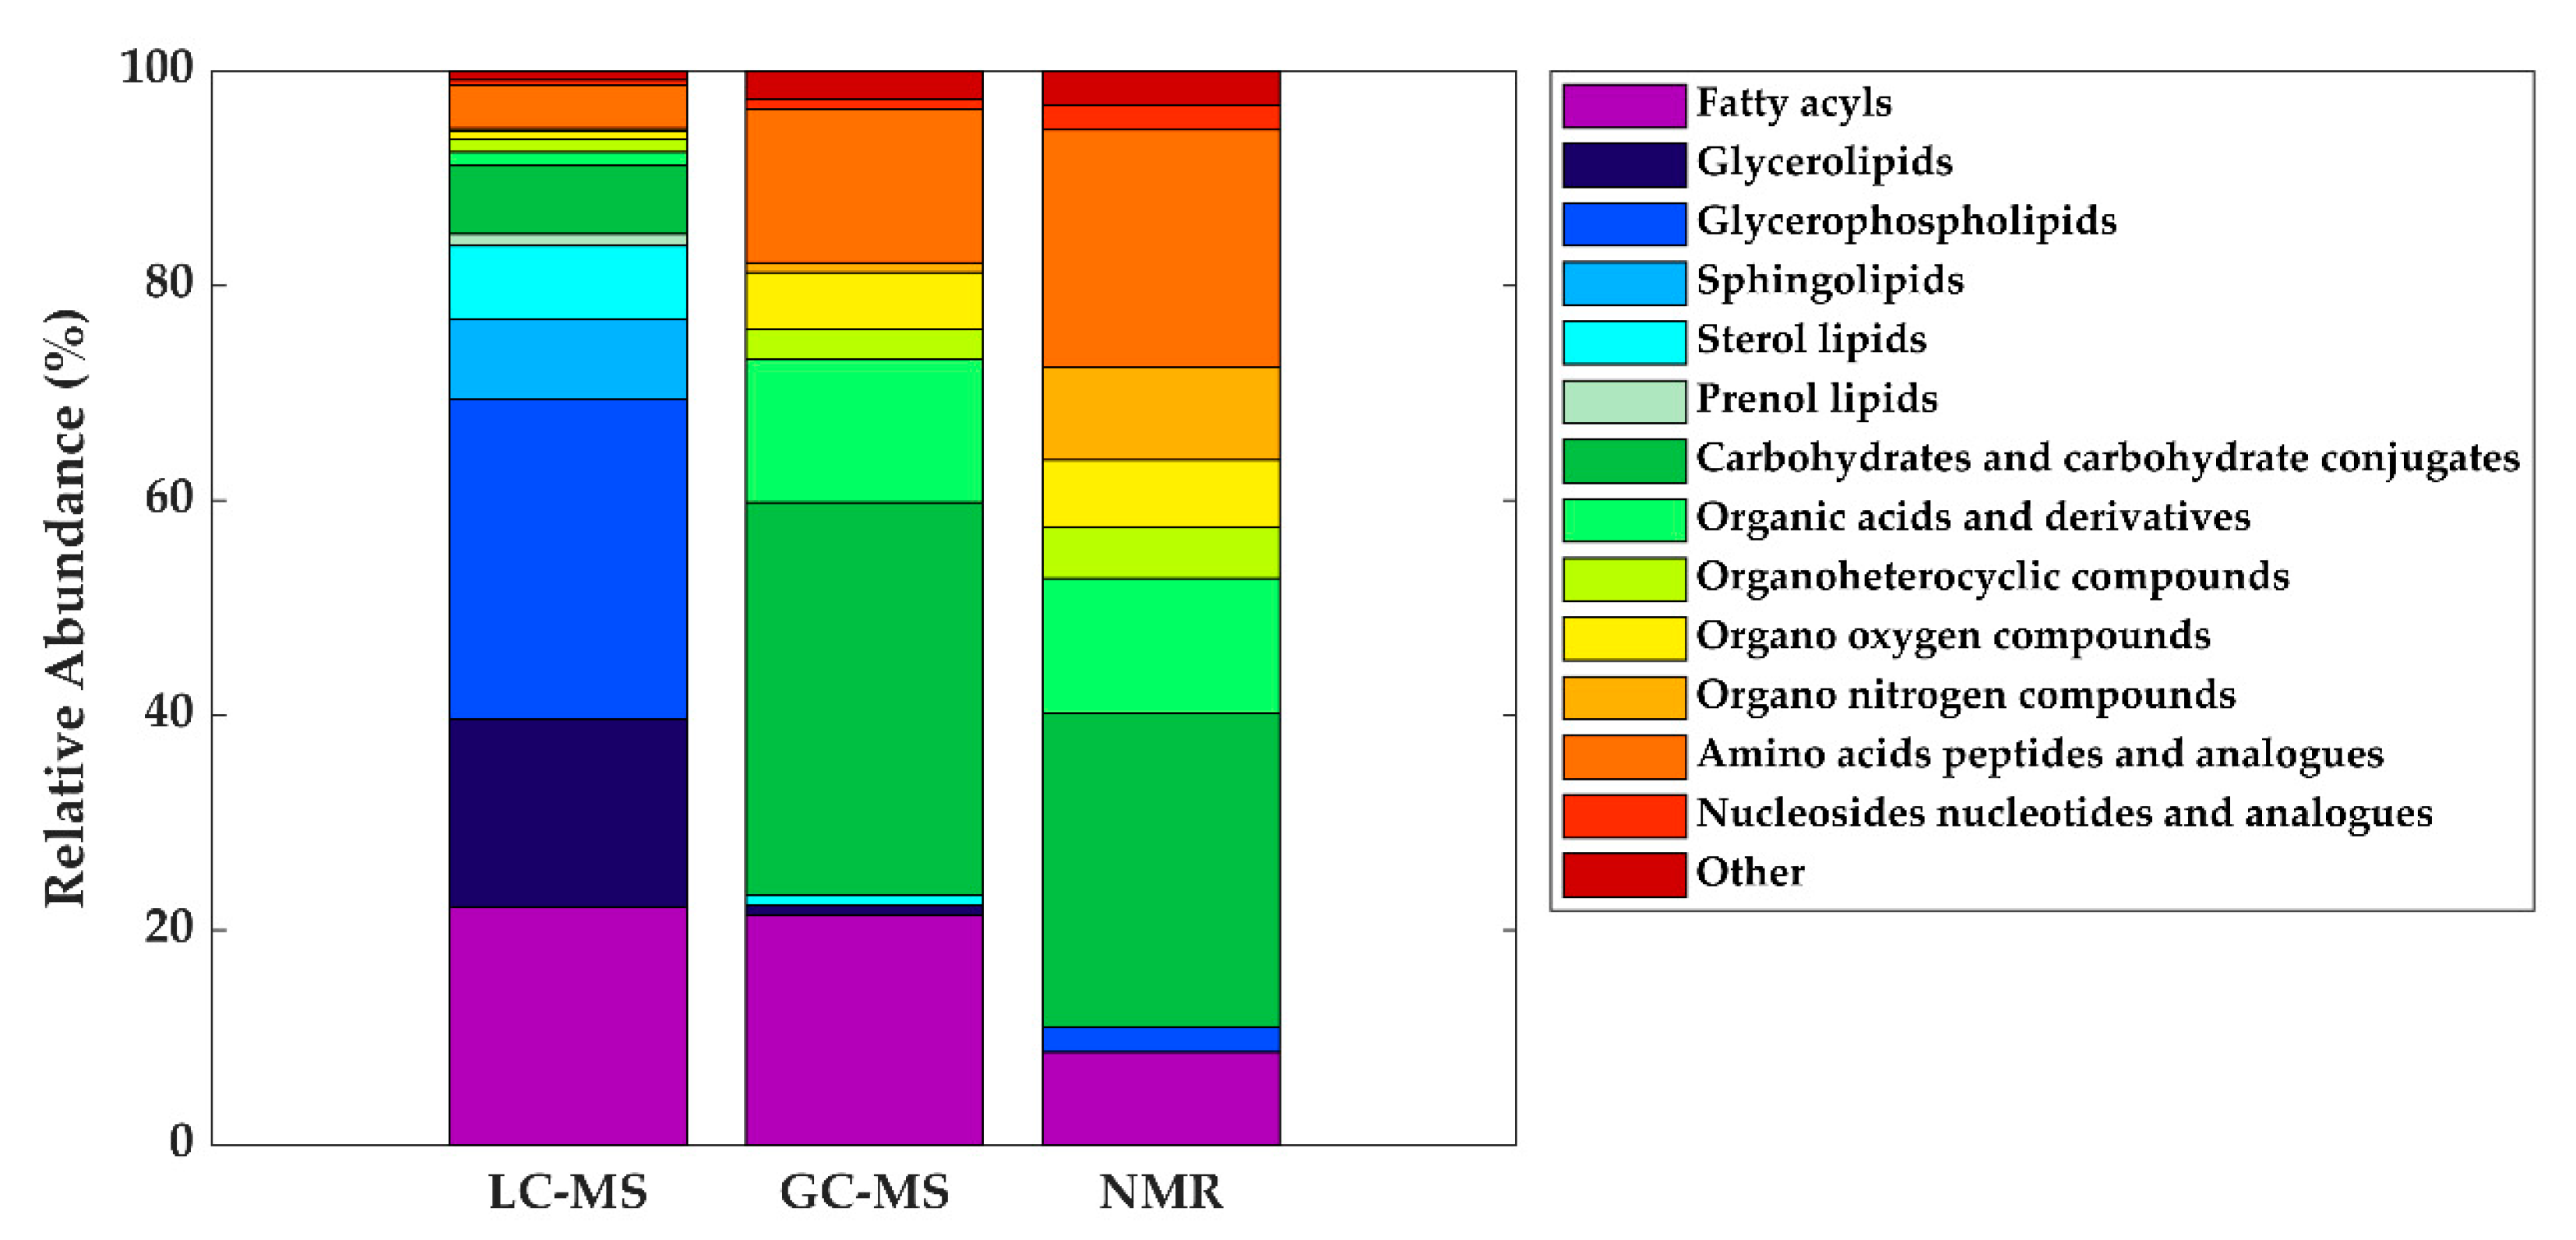
3. The HM Metabolome: Compound Annotation and Coverage
| Metabolite class | LC-MS | GC-MS | NMR |
|---|---|---|---|
| Fatty acyls | Linoleic acid (C18:2) | Oleic acid (C18:1) | - |
| Oleic acid (C18:1) | Palmitic acid (C16:0) | ||
| Palmitoleic acid (C16:1) | Stearic acid (C18:0) | ||
| Glycerolipids | DG (36:1) | - | - |
| Glycerophospholipids | LysoPC (16:0) | - | - |
| Carbohydrates and carbohydrate conjugates | - | Fructose | Lactose |
| Fucose | |||
| Ribose | |||
| Organic acids and derivatives | - | Malic acid Urea |
Acetate |
| Citrate | |||
| Lactate | |||
| Organo nitrogen compounds | - | - | Choline |
| Amino acids, peptides, and analogues | - | Alanine Glutamate Glycine Pyroglutamic acid Serine Valine |
Alanine Creatine Glutamate Glutamine Isoleucine Leucine Tyrosine Valine |
4. Conclusions and Future Perspectives
In less than a decade, 26 research papers have been published trying to shed light on the complex and dynamic composition of HM and the feasibility of different options for sample extraction and metabolite detection has been demonstrated. Due to the many factors that influence HM composition, a thorough study design including SOPs for milk extraction, collection, and storage is indispensable for obtaining biologically meaningful results. Multi-platform approaches are encouraged for providing adequate metabolome coverage, as the diversity of compounds contained in HM will not be properly reflected using one single assay. In line with metabolomics workflows tailored to other sample types, the reproducibility of HM metabolomics studies will benefit from the implementation of QA/QC procedures. Automated metabolite annotation and identification with pure chemical standards is warranted and the authors encourage the use of publicly accessible platforms for enabling the exchange of raw data for comparison between studies.
This entry is adapted from the peer-reviewed paper 10.3390/metabo10020043
References
- World Health Organization Breastfeeding. Available online: https://www.who.int/topics/breastfeeding/en/ (accessed on 2 July 2019).
- Geddes, D.; Perrella, S. Breastfeeding and human lactation. Nutrients 2019, 11, 802–806.
- Owen, C.G.; Martin, R.M.; Whincup, P.H.; Davey Smith, G.; Cook, D.G. Does breastfeeding influence risk of type 2 diabetes in later life? A quantitative analysis of published evidence. Am. J. Clin. Nutr. 2006, 84, 1043–1054.
- Der, G.; Batty, G.D.; Deary, I.J. Effect of breast feeding on intelligence in children: Prospective study, sibling pairs analysis, and meta-analysis. Br. Med. J. 2006, 333, 945–948.
- Rozé, J.C.; Darmaun, D.; Boquien, C.Y.; Flamant, C.; Picaud, J.C.; Savagner, C.; Claris, O.; Lapillonne, A.; Mitanchez, D.; Branger, B.; et al. The apparent breastfeeding paradox in very preterm infants: Relationship between breast feeding, early weight gain and neurodevelopment based on results from two cohorts, EPIPAGE and LIFT. BMJ Open 2012, 2, 1–9.
- Horta, B.L.; Loret De Mola, C.; Victora, C.G. Breastfeeding and intelligence: A systematic review and meta-analysis. Acta Paediatr. Int. J. Paediatr. 2015, 104, 14–19.
- Lönnerdal, B. Bioactive proteins in human milk: Mechanisms of action. J. Pediatr. 2010, 156, S26–S30.
- Musilova, S.; Rada, V.; Vlkova, E.; Bunesova, V. Beneficial effects of human milk oligosaccharides on gut microbiota. Benef. Microbes 2014, 5, 273–283.
- Ballard, O.; Morrow, A.L. Human milk composition: Nutrients and bioactive factors. Pediatr. Clin. N. Am. 2013, 60, 49–74.
- Alsaweed, M.; Hartmann, P.E.; Geddes, D.T.; Kakulas, F. MicroRNAs in Breastmilk and the Lactating Breast: Potential Immunoprotectors and Developmental Regulators for the Infant and the Mother. Int. J. Environ. Res. Public Health 2015, 12, 13981–14020.
- Van den Berg, M.; Kypke, K.; Kotz, A.; Tritscher, A.; Lee, S.Y.; Magulova, K.; Fiedler, H.; Malisch, R. WHO/UNEP global surveys of PCDDs, PCDFs, PCBs and DDTs in human milk and benefit–risk evaluation of breastfeeding. Arch. Toxicol. 2017, 91, 83–96.
- Garwolińska, D.; Namieśnik, J.; Kot-Wasik, A.; Hewelt-Belka, W. State of the art in sample preparation for human breast milk metabolomics—Merits and limitations. TrAC Trends Anal. Chem. 2019, 114, 1–10.
- Marincola, F.C.; Noto, A.; Caboni, P.; Reali, A.; Barberini, L.; Lussu, M.; Murgia, F.; Santoru, M.L.; Atzori, L.; Fanos, V. A metabolomic study of preterm human and formula milk by high resolution NMR and GC/MS analysis: Preliminary results. J. Matern.-Fetal Neonatal Med. 2012, 25, 62–67.
- Smilowitz, J.T.; Sullivan, A.O.Õ.; Barile, D.; German, J.B.; Lo, B. The human milk metabolome reveals diverse oligosaccharide profiles. J. Nutr. 2013, 143, 1709–1718.
- Li, K.; Jiang, J.; Xiao, H.; Wu, K.; Qi, C.; Sund, J.; Li, D. Changes in metabolites profile of breast milk over lactation stages and their relationship with dietary intake in Chinese: HPLC-QTOFMS based metabolomic analysis. Food Funct. 2018, 9, 5189–5197.
- Longini, M.; Tataranno, M.L.; Proietti, F.; Tortoriello, M.; Belvisi, E.; Vivi, A.; Tassini, M.; Perrone, S.; Buonocore, G. A metabolomic study of preterm and term human and formula milk by proton MRS analysis: Preliminary results. J. Matern.-Fetal Neonatal Med. 2014, 7058, 27–33.
- Murgia, A.; Scano, P.; Contu, M.; Ibba, I.; Altea, M.; Demuru, M.; Porcu, A.; Caboni, P. Characterization of donkey milk and metabolite profile comparison with human milk and formula milk. LWT 2016, 74, 427–433.
- Qian, L.; Zhao, A.; Zhang, Y.; Chen, T.; Zeisel, S.H.; Jia, W.; Cai, W. Metabolomic approaches to explore chemical diversity of human breast-milk, formula milk and bovine milk. Int. J. Mol. Sci. 2016, 17, 2128–2143.
- Scano, P.; Murgia, A.; Demuru, M.; Consonni, R.; Caboni, P. Metabolite profiles of formula milk compared to breast milk. Food Res. Int. 2016, 87, 76–82.
- Lopes, T.I.B.; Cañedo, M.C.; Oliveira, F.M.P.; Ancantara, G.B. Toward precision nutrition: Commercial infant formulas and human milk compared for stereospecific distribution of fatty acids using metabolomics. Omics J. Integr. Biol. 2018, 22, 484–492.
- O’Sullivan, A.; He, X.; McNiven, E.M.S.; Hinde, K.; Haggarty, N.W.; Lönnerdal, B.; Slupsky, C.M. Metabolomic phenotyping validates the infant rhesus monkey as a model of human infant metabolism. J. Pediatr. Gastroenterol. Nutr. 2013, 56, 355–363.
- Spevacek, A.R.; Smilowitz, J.T.; Chin, E.L.; Underwood, M.A.; German, J.B.; Slupsky, C.M. Infant maturity at birth reveals minor differences in the maternal milk metabolome in the first month of lactation. J. Nutr. 2015, 145, 1698–1708.
- Sundekilde, U.K.; Downey, E.; Mahony, J.A.O.; Shea, C.O.; Ryan, C.A.; Kelly, A.L.; Bertram, H.C. The effect of gestational and lactational age on the human milk metabolome. Nutrients 2016, 8, 304–318.
- Alexandre-Gouabau, M.-C.; Moyon, T.; David-Sochard, A.; Fenaille, F.; Cholet, S.; Royer, A.-L.; Guitton, Y.; Billard, H.; Darmaun, D.; Rozé, J.-C.; et al. Comprehensive preterm breast milk metabotype associated with optimal infant early growth pattern. Nutrients 2019, 11, 528–553.
- Alexandre-Gouabau, M.C.; Moyon, T.; Cariou, V.; Antignac, J.P.; Qannari, E.M.; Croyal, M.; Soumah, M.; Guitton, Y.; David-Sochard, A.; Billard, H.; et al. Breast milk lipidome is associated with early growth trajectory in preterm infants. Nutrients 2018, 10, 164–192.
- Dessì, A.; Briana, D.; Corbu, S.; Gavrili, S.; Marincola, F.C.; Georgantzi, S.; Pintus, R.; Fanos, V.; Malamitsi-Puchner, A. Metabolomics of breast milk: The importance of phenotypes. Metabolites 2018, 8, 79–88.
- Villaseñor, A.; Garcia-Perez, I.; Garcia, A.; Posma, J.M.; Fernández-Lópes, M.; Nicholas, A.J.; Modi, N.; Holmes, E.; Barbas, C. Breast milk metabolome characterization in a single-phase extraction, multiplatform analytical approach. Anal. Chem. 2014, 86, 8245–8252.
- Andreas, N.J.; Hyde, M.J.; Gomez-romero, M.; Lopez-Gonzalvez, M.A.; Villaseñor, A.; Wijeyesekera, A.; Barbas, C.; Modi, N.; Holmes, E.; Garcia-Perez, I. Multiplatform characterization of dynamic changes in breast milk during lactation. Electrophoresis 2015, 36, 2269–2285.
- Wu, J.; Domellöf, M.; Zivkovic, A.M.; Larsson, G.; Öhman, A.; Nording, M.L. NMR-based metabolite profiling of human milk: A pilot study of methods for investigating compositional changes during lactation. Biochem. Biophys. Res. Commun. 2016, 469, 626–632.
- Isganaitis, E.; Venditti, S.; Matthews, T.J.; Lerin, C.; Demerath, E.W.; Fields, D.A. Maternal obesity and the human milk metabolome: Associations with infant body composition and postnatal weight gain. Am. J. Clin. Nutr. 2019, 110, 111–120.
- Dangat, K.; Upadhyay, D.; Kilari, A.; Sharma, U.; Kemse, N.; Mehendale, S.; Lalwani, S.; Wagh, G.; Joshi, S.; Jagannathan, N.R. Altered breast milk components in preeclampsia; An in-vitro proton NMR spectroscopy study. Clin. Chim. Acta 2016, 463, 75–83.
- Praticò, G.; Capuani, G.; Tomassini, A.; Baldassarre, E.; Delfini, M.; Miccheli, A. Exploring human breast milk composition by NMR-based metabolomics. Nat. Prod. Res. 2013, 28, 95–101.
- Gay, M.C.L.; Koleva, P.T.; Slupsky, C.M.; Toit, E.; Eggesbo, M.; Johnson, C.C.; Wegienka, G.; Shimojo, N. Worldwide variation in human milk metabolome: Indicators of breast physiology and maternal lifestyle? Nutrients 2018, 10, 1151–1162.
- Gómez-Gallego, C.; Morales, J.M.; Monleón, D.; du Toit, E.; Kumar, H.; Linderborg, K.M.; Zhang, Y.; Yang, B.; Isolauri, E.; Salminen, S.; et al. Human breast milk NMR metabolomic profile across specific geographical locations and its association with the milk microbiota. Nutrients 2018, 10, 1355–1375.
- Hewelt-Belka, W.; Garwolińska, D.; Belka, M.; Bączek, T.; Namieśnik, J.; Kot-Wasik, A. A new dilution-enrichment sample preparation strategy for expanded metabolome monitoring of human breast milk that overcomes the simultaneous presence of low- and high-abundance lipid species. Food Chem. 2019, 288, 154–161.
- Urbaniak, C.; Mcmillan, A.; Angelini, M.; Gloor, G.B.; Sumarah, M.; Burton, J.P.; Reid, G. Effect of chemotherapy on the microbiota and metabolome of human milk, a case report. Microbiome 2014, 2, 24–35.
- Folch, J.; Lees, M.; Sloane Stantley, G.H. A simple method for the isolation and purification of total lipides from animal tissues. J. Biol. Chem. 1957, 266, 497–509.
- Bligh, E.G.; Dyer, W.J. A rapid method of total lipid extraction and purification. Can. J. Biochem. Physiol. 1959, 37, 911–917.
- Mung, D.; Li, L. Development of chemical isotope labeling LC-MS for milk metabolomics: Comprehensive and quantitative profiling of the amine/phenol submetabolome. Anal. Chem. 2017, 89, 4435–4443.
- Mung, D.; Li, L. Applying quantitative metabolomics based on chemical isotope labeling LC-MS for detecting potential milk adulterant in human milk. Anal. Chim. Acta 2018, 1001, 78–85.
- Sumner, L.W.; Samuel, T.; Noble, R.; Gmbh, S.D.; Barrett, D.; Beale, M.H.; Hardy, N. Proposed minimum reporting standards for chemical analysis Chemical Analysis Working Group (CAWG) Metabolomics Standards Initiative (MSI). Metabolomics 2007, 3, 211–221.
- Vinaixa, M.; Schymanski, E.L.; Neumann, S.; Navarro, M.; Salek, R.M.; Yanes, O. Mass spectral databases for LC/MS- and GC/MS-based metabolomics: State of the field and future prospects. TrAC Trends Anal. Chem. 2016, 78, 23–35.
- Fiehn, O.; Barupal, D.K.; Kind, T. Extending biochemical databases by metabolomic surveys. J. Biol. Chem. 2011, 286, 23637–23643.
- Wishart, D.S.; Feunang, Y.D.; Marcu, A.; Guo, A.C.; Liang, K.; Vázquez-Fresno, R.; Sajed, T.; Johnson, D.; Li, C.; Karu, N.; et al. HMDB 4.0: The human metabolome database for 2018. Nucleic Acids Res. 2018, 46, D608–D617.
- Smith, C.A.; O’Maille, G.; Want, E.J.; Qin, C.; Trauger, S.A.; Brandon, T.R.; Custodio, D.E.; Abagyan, R.; Siuzdak, G. METLIN: A metabolite mass spectral database. Ther. Drug Monit. 2005, 27, 747–751.
- Kind, T.; Wohlgemuth, G.; Lee, D.Y.; Lu, Y.; Palazoglu, M.; Shahbaz, S.; Fiehn, O. FiehnLib—Mass spectral and retention index libraries for metabolomics based on quadrupole and time-of-flight gas chromatography/mass spectrometry. Anal. Chem. 2009, 81, 10038–10048.
- Cardiff University; Babraham Institute; University of California, S.D. LIPID MAPS Lipidomics Gateway. Available online: http://www.lipidmaps.org/ (accessed on 8 November 2019).
- Foroutan, A.; Guo, A.C.; Vazquez-fresno, R.; Lipfert, M.; Zhang, L.; Zheng, J.; Badran, H.; Budinski, Z.; Mandal, R.; Ametaj, B.N.; et al. Chemical composition of commercial cow’s milk. J. Agric. Food Chem. 2019, 67, 4897–4914.
- Milk Composition Database. Available online: http://www.mcdb.ca/ (accessed on 5 November 2019).
- KEGG PATHWAY Database. Available online: https://www.kegg.jp/kegg/pathway.html (accessed on 8 November 2019).
- Li, L.; Li, R.; Zhou, J.; Zuniga, A.; Stanislaus, A.E.; Wu, Y.; Huan, T.; Zheng, J.; Shi, Y.; Wishart, D.S.; et al. MyCompoundID: Using an evidence-based metabolome library for metabolite identification. Anal. Chem. 2013, 85, 3401–3408.
- Gil de la Fuente, A.; Godzien, J.; Saugar, S.; Garcia-Carmona, R.; Badran, H.; Wishart, D.S.; Barbas, C.; Otero, A. CEU Mass Mediator 3.0: A Metabolite Annotation Tool. J. Proteome Res. 2019, 18, 797–802.
- CEU Mass Mediator. Available online: http://ceumass.eps.uspceu.es/mediator/ (accessed on 5 November 2019).
- Oliveros, J.C. Venny. An Interactive Tool for Comparing Lists with Venn’s Diagrams. Available online: http://bioinfogp.cnb.csic.es/tools/venny/index.html (accessed on 4 November 2019).