Your browser does not fully support modern features. Please upgrade for a smoother experience.
Please note this is an old version of this entry, which may differ significantly from the current revision.
Marine gas hydrate has accumulated special characteristics, such as greater water depth, non-diagenesis, and irregular and uneven distribution. These characteristics lead to great challenges in gas hydrate evaluation and exploitation. The free gas layer is often developed below the bottom boundary of the submarine hydrate stability zone.
- marine gas hydrate
- resistivity logging
- electrical property
- saturation
1. Introduction
During the natural gas migration from deep within the earth to the surface, the migrating gas can combine with water molecules under certain temperature and pressure conditions to form solid ice-like substances, which are usually called natural gas hydrates [1][2]. Geological survey results show that there is a significant amount of natural gas hydrate in the ocean with water depth of more than 300 m [3][4][5][6], and their main component is methane. It is estimated that the methane gas stored in global gas hydrate is about 1.8 × 10¹⁶~2.1 × 10¹⁶ m3, twice the organic carbon reserves and as much as the sum of coal, oil, and conventional natural gas globally [7][8][9]. Therefore, since the end of last century, an upsurge of gas hydrate resource exploration and development has swept the world. China, the United States, Japan, Canada, Germany, Russia, India, South Korea, and other countries have formulated marine gas hydrate exploration and development projects aimed at energy security, economic strategy, and environmental security [10][11][12][13][14].
As can be seen from Figure 1, there are over 230 areas with direct or indirect gas hydrate evidence in the world, 97% of them are distributed in oceanic areas, and only small areas are distributed on terrestrial permafrost [15]. The research hotspots for marine gas hydrate are concentrated in the South China Sea, Nankai Trough of Japan, Ulleung Basin of East Sea, the sea out of Oregon on the east and west sides of the Pacific Ocean, the Gulf of Mexico, and the Gulf of Oman in the Indian Ocean, and so on [16].
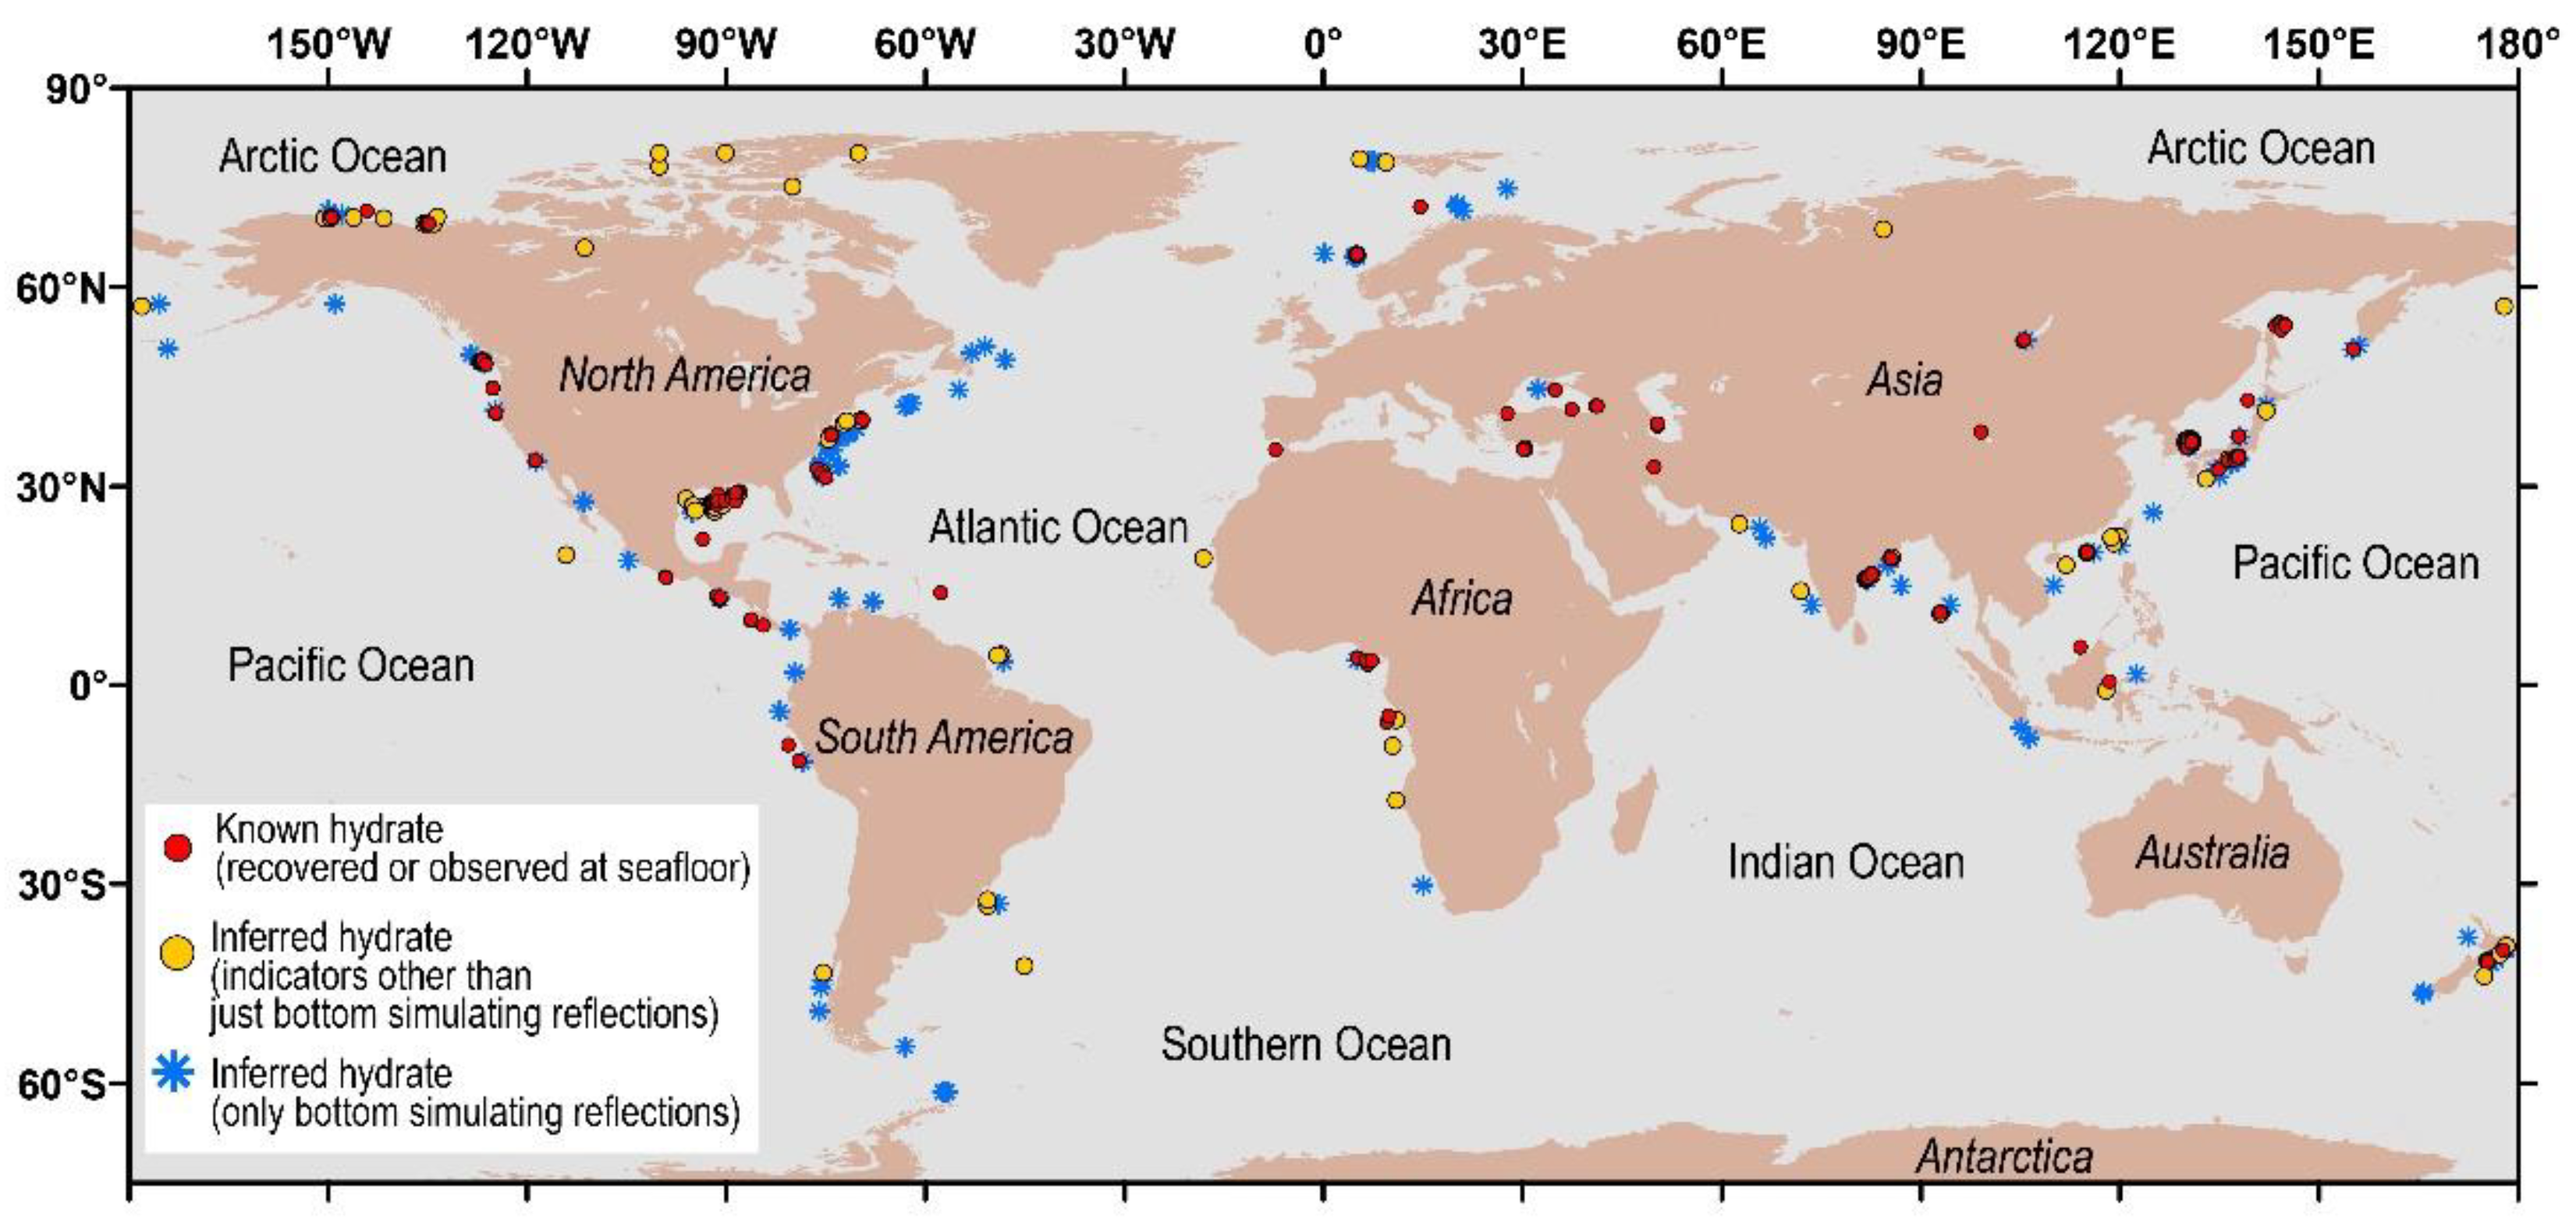
Figure 1. Distribution of main research areas of global natural gas hydrate [16].
Marine gas hydrate has accumulated special characteristics, such as greater water depth, non-diagenesis, and irregular and uneven distribution. These characteristics lead to great challenges in gas hydrate evaluation and exploitation [17][18][19]. The free gas layer is often developed below the bottom boundary of the submarine hydrate stability zone. Due to the velocity difference in sound waves at different media interfaces, an abnormal phenomenon of “bottom simulating reflection” (BSR) is produced in seismic images, which is an important sign for early gas hydrate identification. However, with the investigation degree deepening, a consensus has been reached that there is no strict mutual correspondence between BSR and hydrate reservoir, and it is also difficult to accurately characterize a gas hydrate reservoir only by BSR [20][21][22]. Methods such as well logging and core analysis are urgently needed to obtain full status data for the gas hydrate reservoir.
In the early 1970s, the deep-sea drilling program (DSDP) deployed a gas hydrate survey and exploration for the first time [23]. In the mid-1990s, gas hydrate prospect area explorations conducted by the United States, Russia, Japan, Canada, Germany, Netherlands, and other countries, covered most of the continental margins. As the gas hydrate energy potential was confirmed, Japan, China, India, and South Korea successively began their own gas hydrate exploration. Expeditions were carried out in the South China Sea, Nankai Trough, offshore Japan, the north of the South China Sea, the east coast of India, and in the Ulleung Basin of South Korea [24][25][26]. Figure 2 shows the timeline of the major gas hydrate drilling projects around the world. At present, there are more than 100 wells dedicated to gas hydrate research.
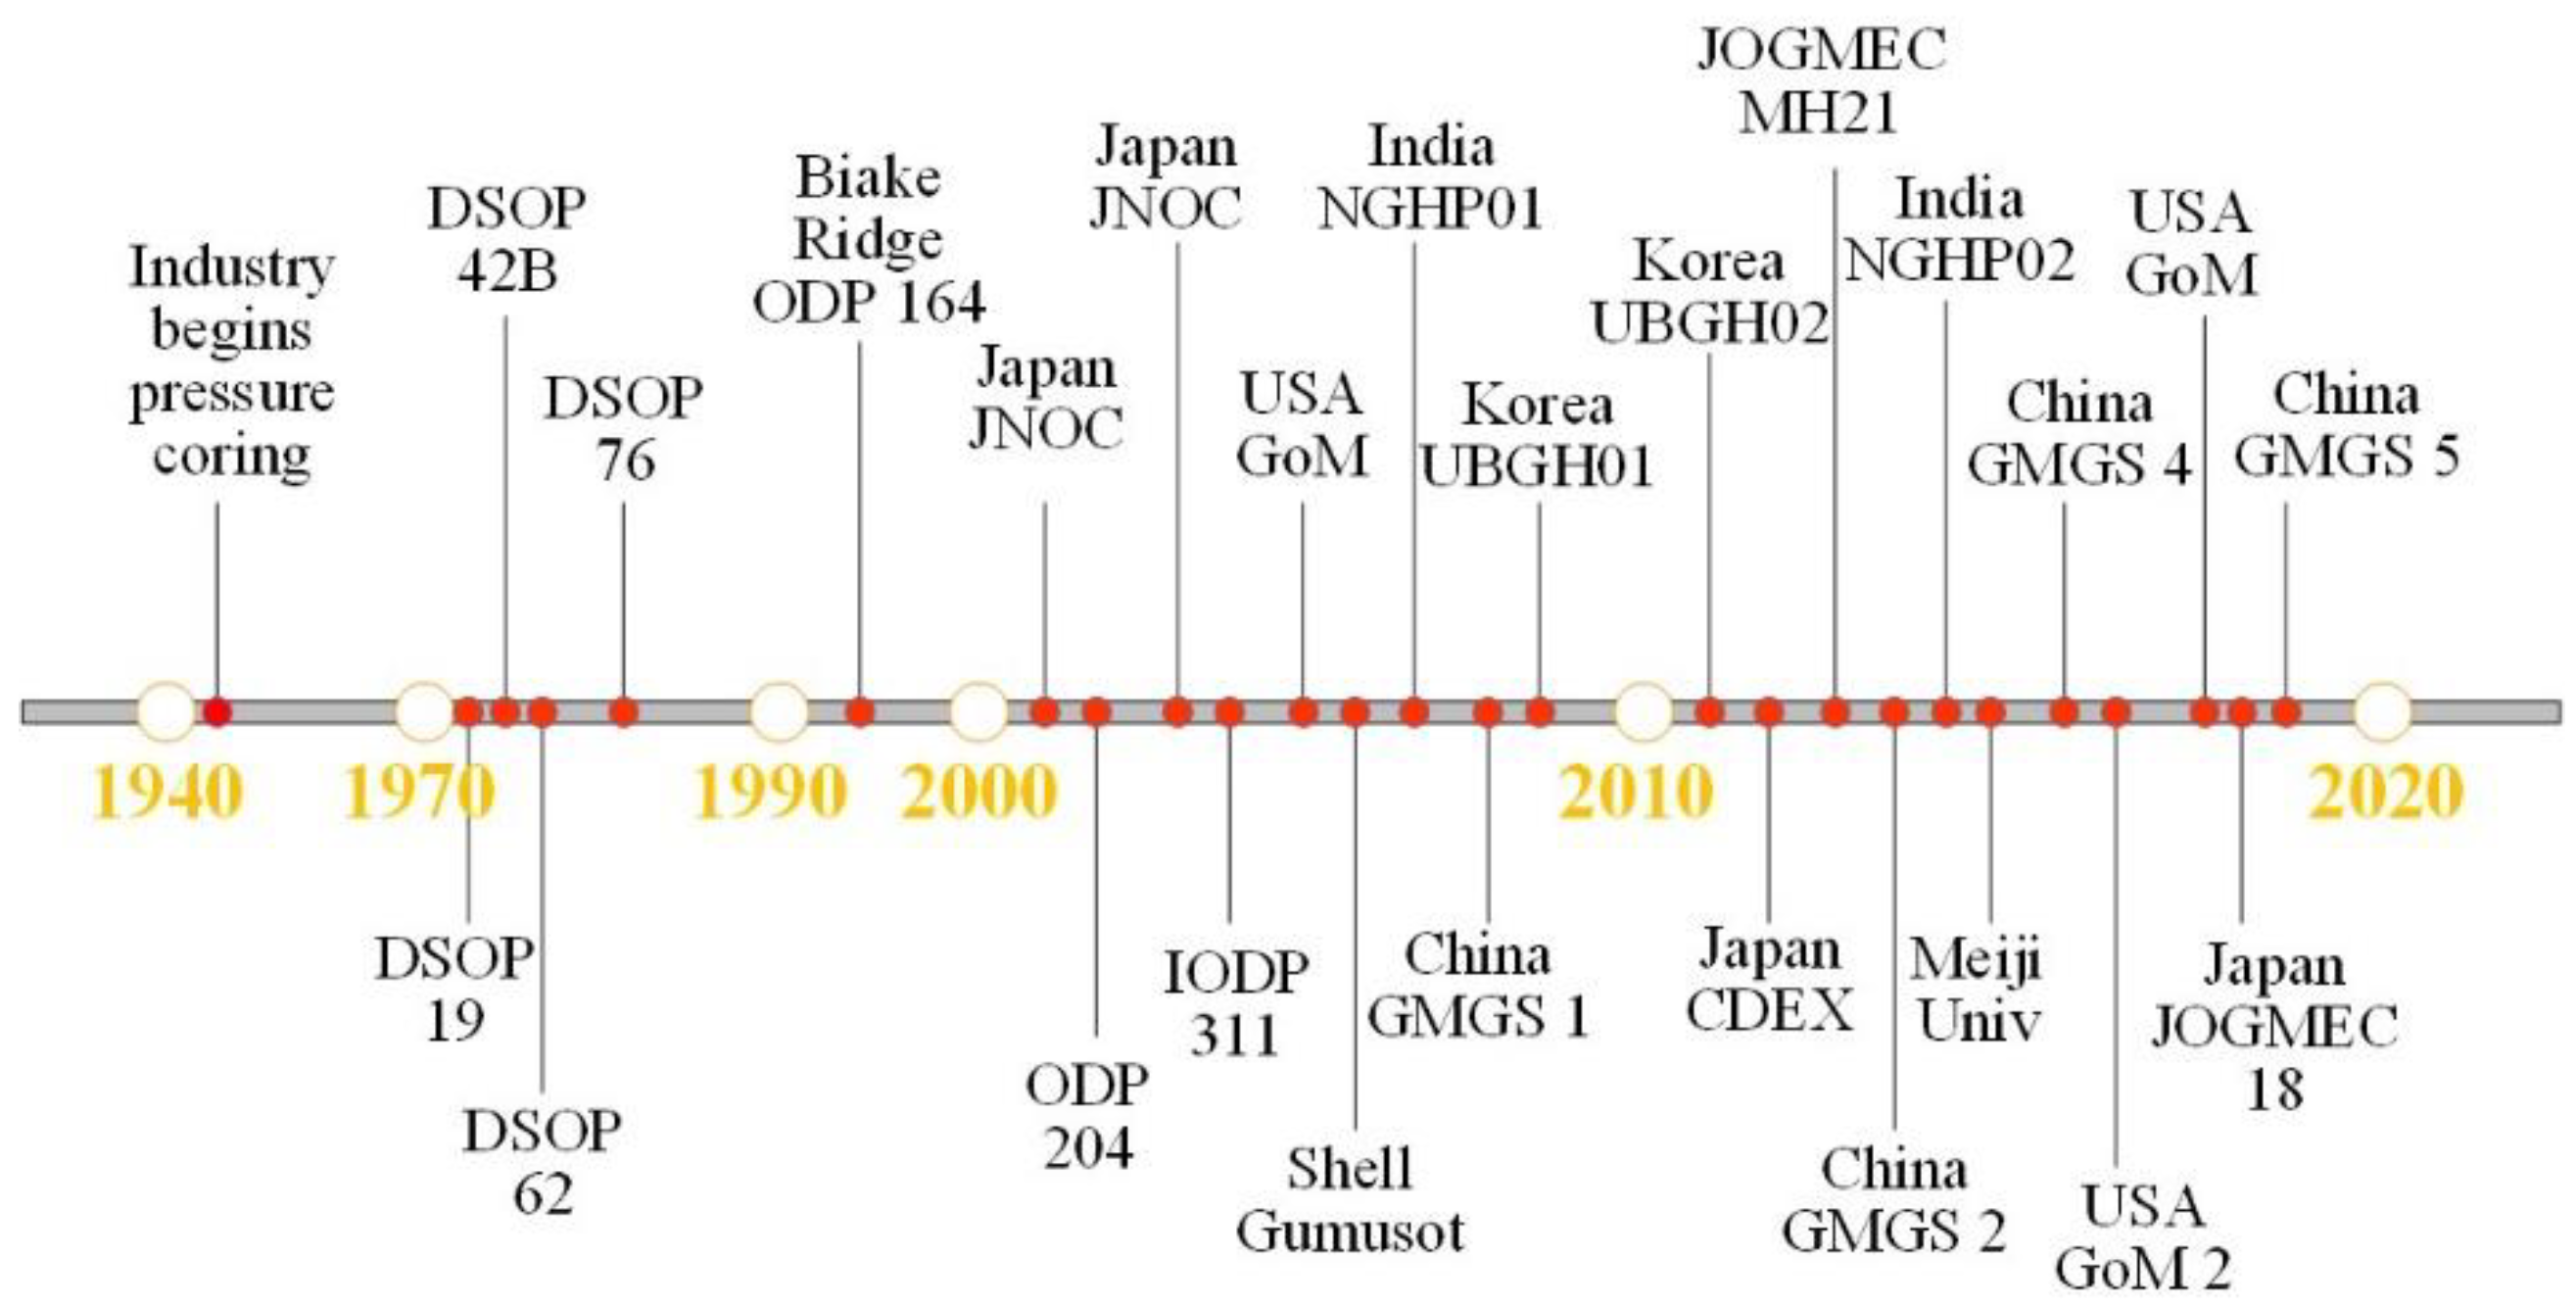
Figure 2. Gas hydrate drilling programs since the 1970s all over the world.
Electrical resistivity measurements are one of the most important parameters to identify gas hydrate, and it is widely used in gas hydrate reservoir logging [27][28][29]. Gas hydrate, a natural electrical insulator, can significantly impact the resistivity properties of hydrate-bearing sediments. In addition, hydrate also has a combined effect on the pore water content, ion concentration, and formation skeleton structure, which are critical factors for reservoir electrical properties [30][31][32]. However, the measured resistivity properties of different logging sites around the world vary greatly because of unique tectonic conditions, reservoir mineral composition, gas hydrate stability conditions, and the form of gas hydrate occurrence in sediments.
In order to solve the problems encountered in the logging data interpretation, and to reveal the geophysical properties of gas hydrate-bearing sediment, simulation experiments and numerical analysis have been widely carried out. Scientists have been endeavoring to discover the quantitative relationship between resistivity and gas hydrate saturation, reveal the complex resistivity response of hydrate crystal formation and dissociation processes, and establish a gas hydrate reservoir inversion technique based on resistivity imaging and so on [33][34][35][36]. However, it can be said that a significant amount of efforts is required to understand the resistivity properties of hydrate-bearing sediments. The dynamic accumulation and dispersion of gas hydrate in sediments involve the transformation of solid–liquid–gas multiphase materials and core reconstruction at the pore scale, so the electric response mode and control mechanism is complex, leaving many unsolved scientific problems.
Downhole resistivity logging technology is an important method for marine gas hydrate exploration and energy potential evaluation. Affected by the geological factors and the type of gas hydrate accumulation, the reservoirs’ resistivity logging results may vary, and the derived gas hydrate saturation estimates may not be accurate without a complete analysis of all the factors controlling the resistivity properties of the hydrate-bearing sediments. Simulation experiments and theoretical research are effective means to reveal the electrical response controls in different reservoirs. Therefore, this paper gives a summary of the progress related to the marine gas hydrate resistivity logging and experimental research, in order to provide additional insight into the electrical resistivity properties of gas hydrate-bearing sediments.
2. Resistivity Logging Progress of Marine Gas Hydrate
2.1. The South China Sea
The northern slope of the South China Sea has high-quality gas hydrate reservoir accumulations. China Geological Survey started marine gas hydrate investigations in 1999 [37]. In the past 20 years, exploration expeditions have been conducted from west to east in the South China Sea, including Qiongdongnan Basin, Xisha Trough, Shenhu area, and Dongsha area [38][39][40][41]. Different types of gas hydrate reservoirs were found in these areas (Figure 3).
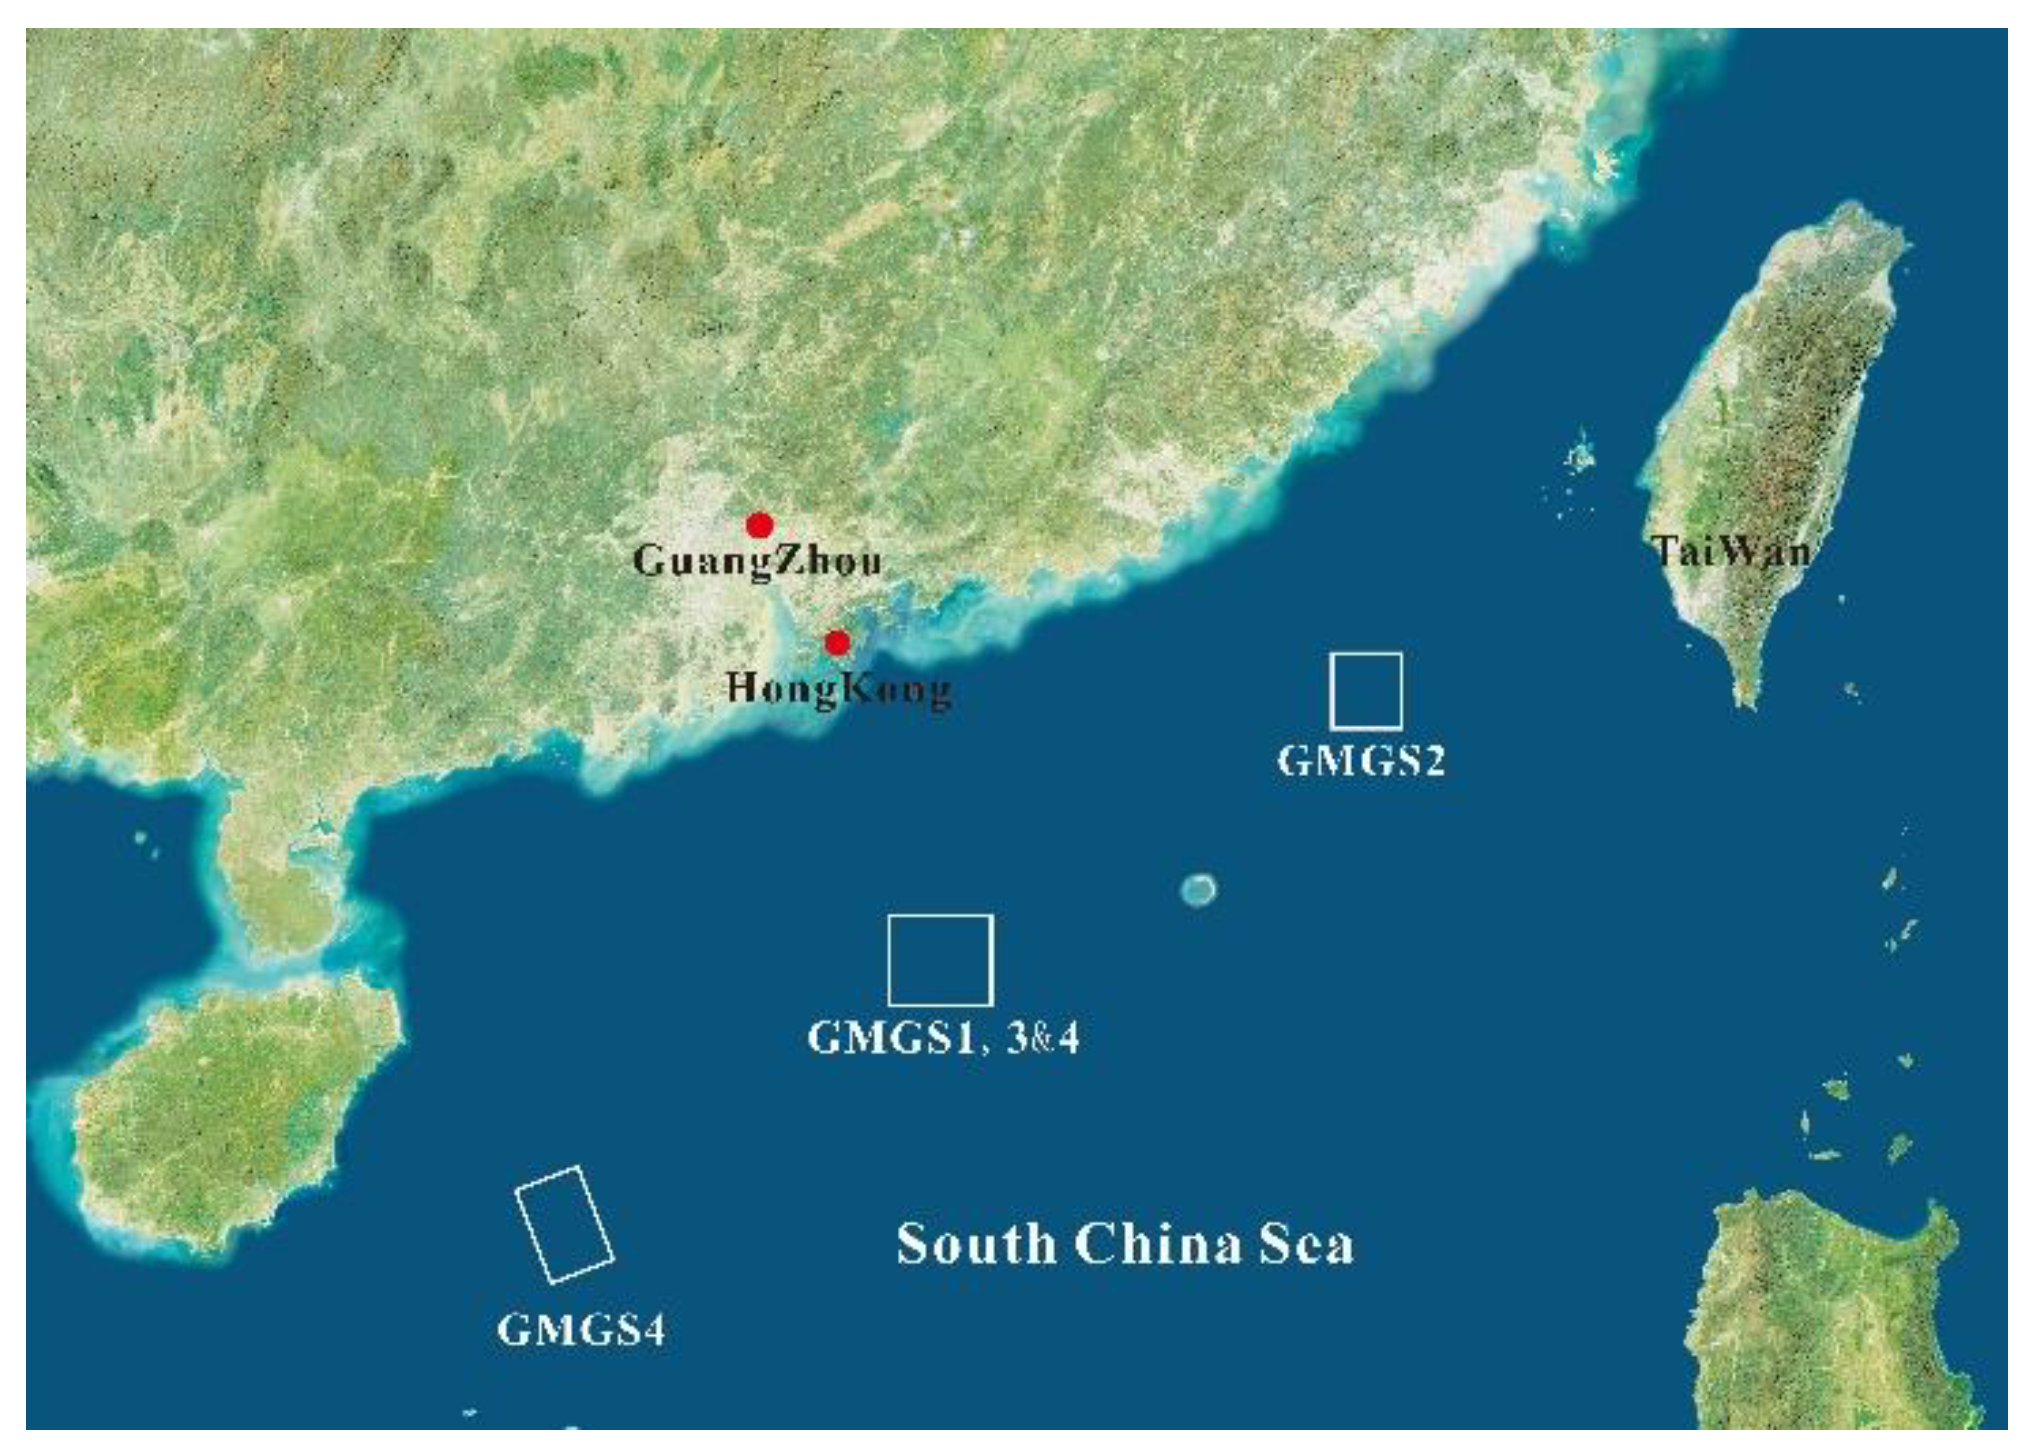
Figure 3. Schematic diagram of main gas hydrate research areas in the north of South China Sea.
Shenhu, one of the most focused areas, has been chosen to be the trial production location two times [11]. SH2 was drilled during GMGS1, the downhole logging operations were conducted from about 38 to 245 m below sea floor (mbsf). The resistivity log values increased slowly with the depth. There was a high resistivity anomaly in the depth interval from 189 to 219 mbsf, with the resistivity greater than 3 Ω·m [41]. The W19 gas hydrate research well was drilled during the GMGS3 expedition. The LWD curves of the pilot hole clearly showed the gas hydrate response characteristics, such as high resistivity, high acoustic velocity, and low natural gamma value. There was a 68 m thick resistivity anomaly section between 134~202 mbsf, and the highest resistivity log value was about 8 Ω·m [39]. In addition, the logging results near sites of the two gas hydrate production tests in the Shenhu area showed that the resistivity logging value increased from about 2.5 Ω·m at the top of the hydrate layer to the highest 7.5 Ω·m [42][43].
The above described relatively low resistivity anomaly range indicates the presence of pore filling gas hydrate. For the massive gas hydrate reservoir, the resistivity increase was much higher. GMGS2 focused on the continental slope of the northeast Pearl River Mouth Basin, and massive, layered, vein, and dispersed gas hydrates were found in five coring sites [37][40]. The downhole logging data from the W08 well and core samples from the same site confirmed the existence of massive gas hydrate (Figure 4), and the logging data at the depth of 66 to 98 mbsf indicated that the maximum value was more than 2000 Ω·m.
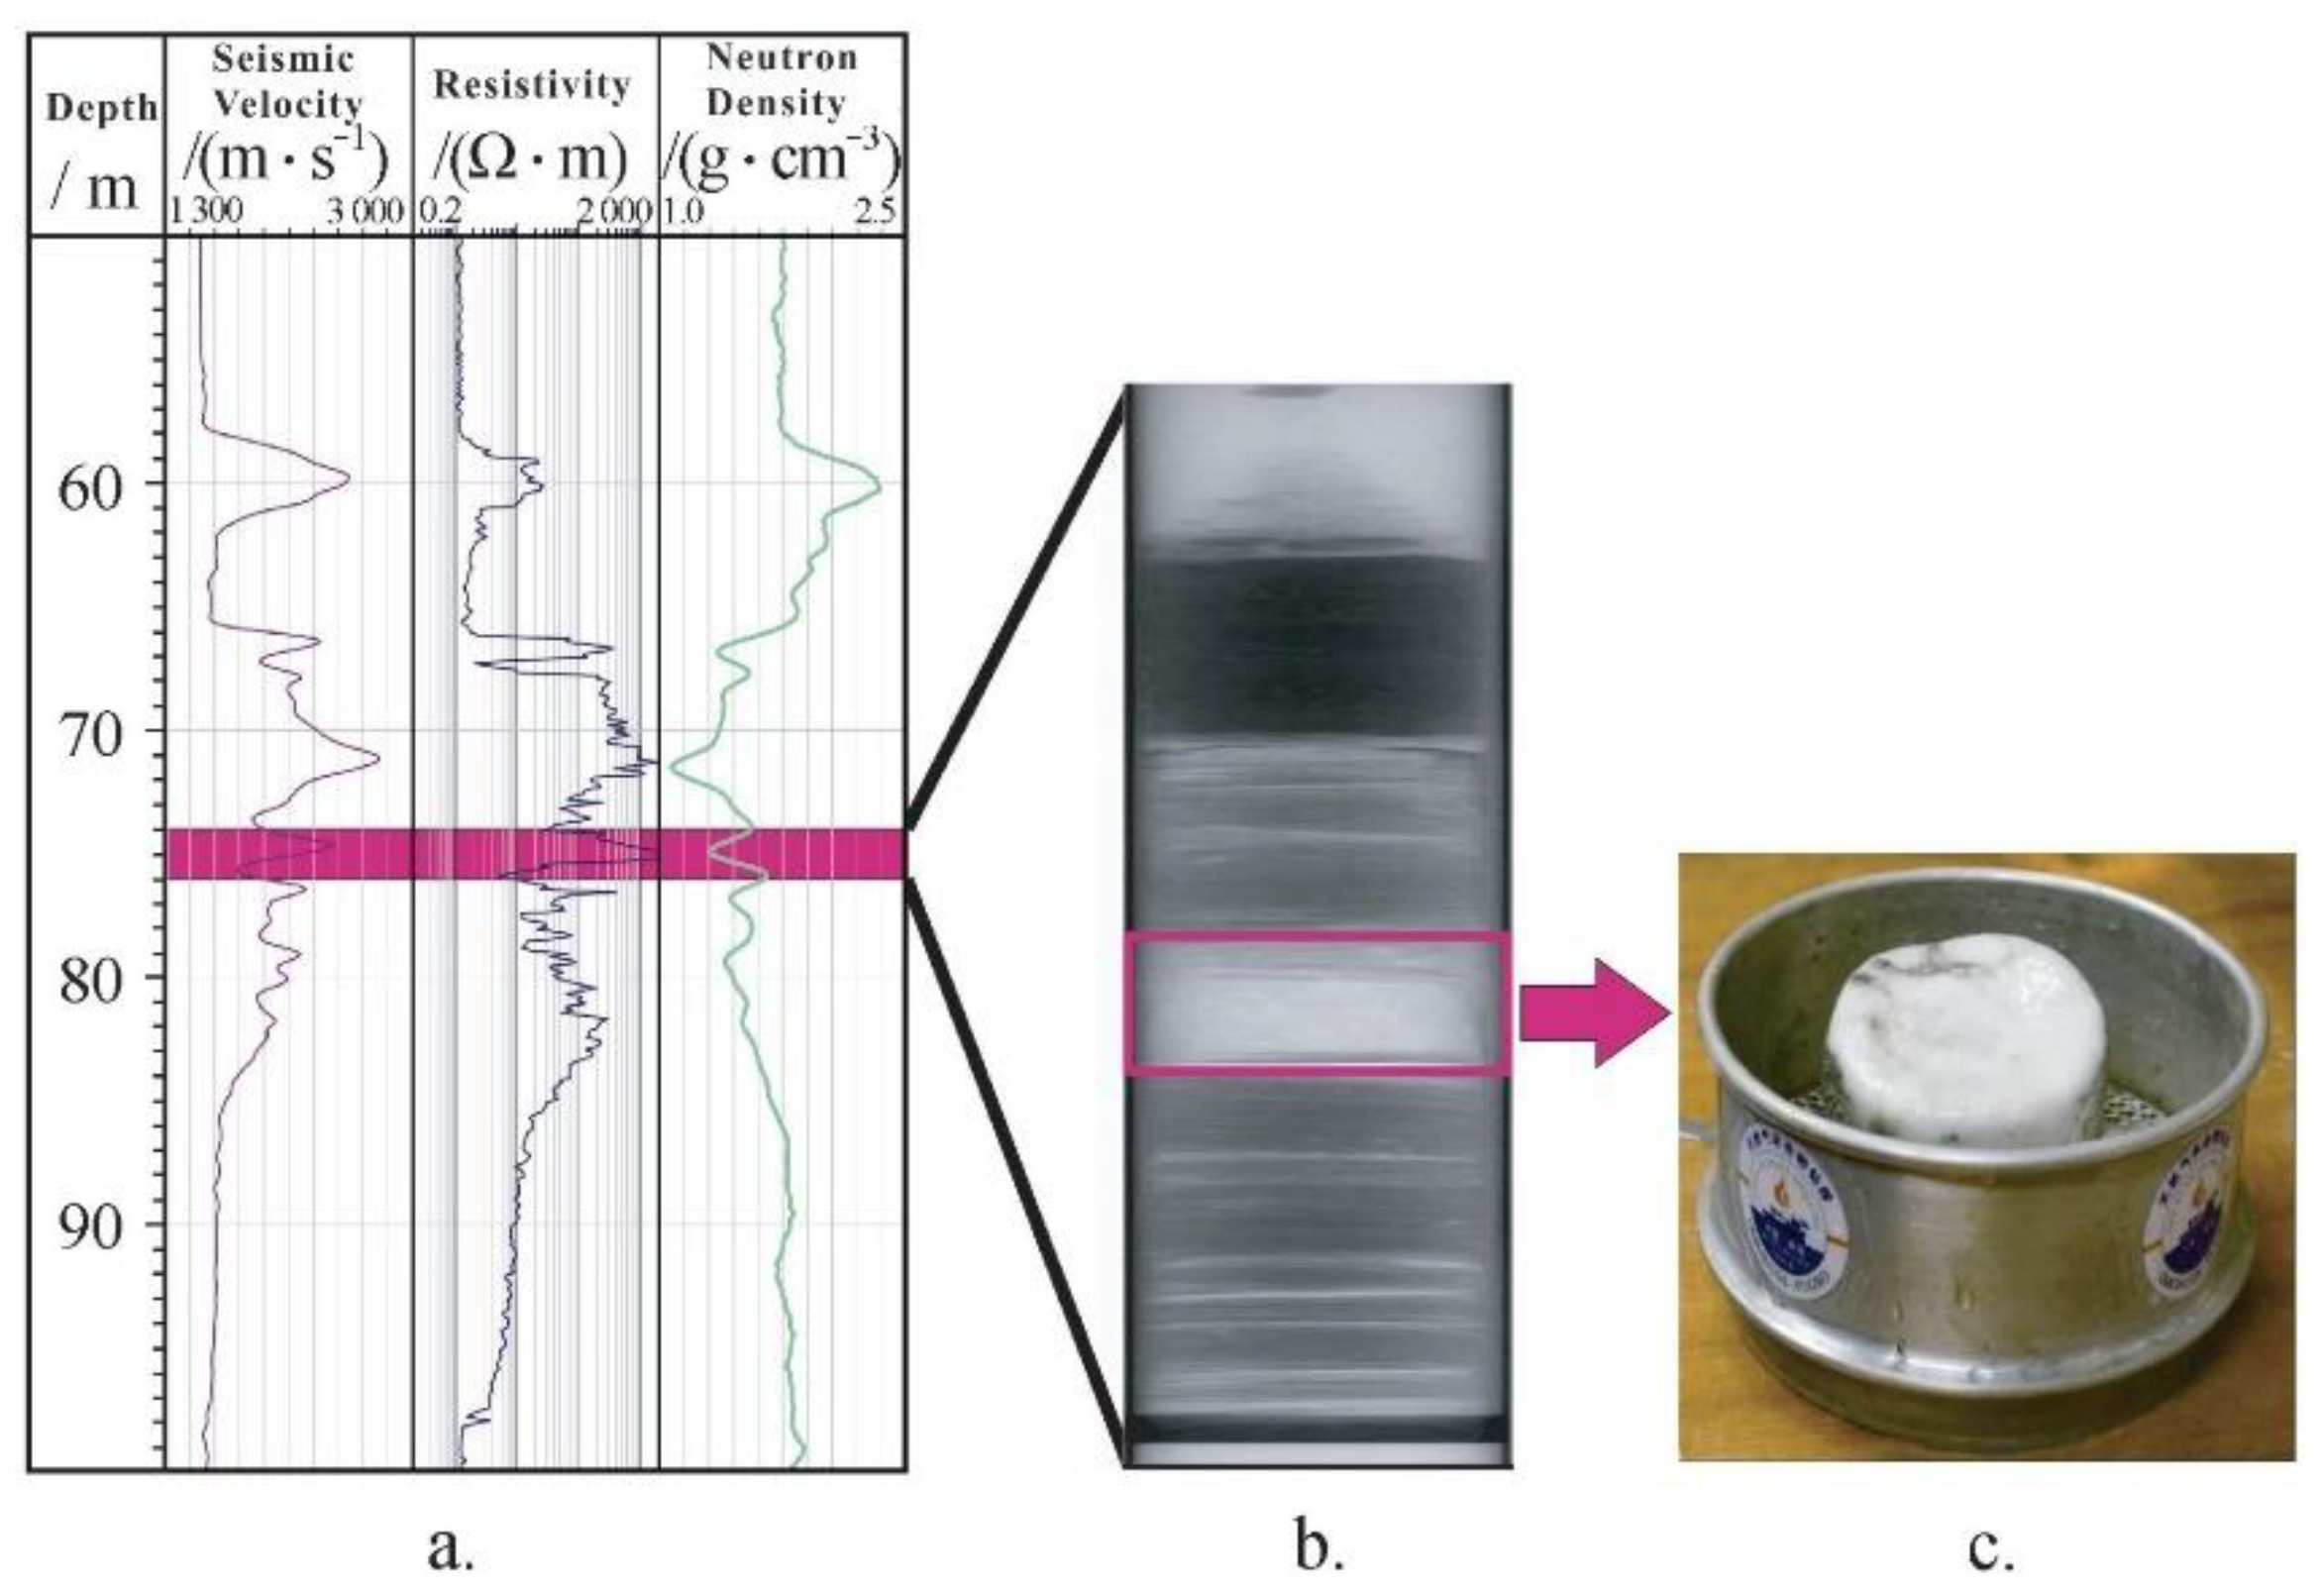
Figure 4. Massive gas hydrate core sample and logging data from the same interval [37] (a) data from the pressure cored section of the W08 well; (b) X-ray image of pressure core; (c) Massive hydrate samples as recovered in a pressure core.
Qiongdongnan Basin is rich in oil and gas resources. The near-seabed pressure and temperature conditions meet the requirements for the stability of gas hydrates [44]. With the aim to image the gas hydrates, a marine controlled-source electromagnetic survey was conducted along a 4.5 km profile, as shown in Figure 5. The inversion results showed that there are numerous laterally discontinuous high resistivity anomalies from 60 to 330 mbsf, and the resistivity in these anomalous intervals ranged from 2 to 10 Ω·m. There were also three additional high resistivity intervals (ranging from 2 to 4 Ω·m) in the W08 below 300 mbsf [45].
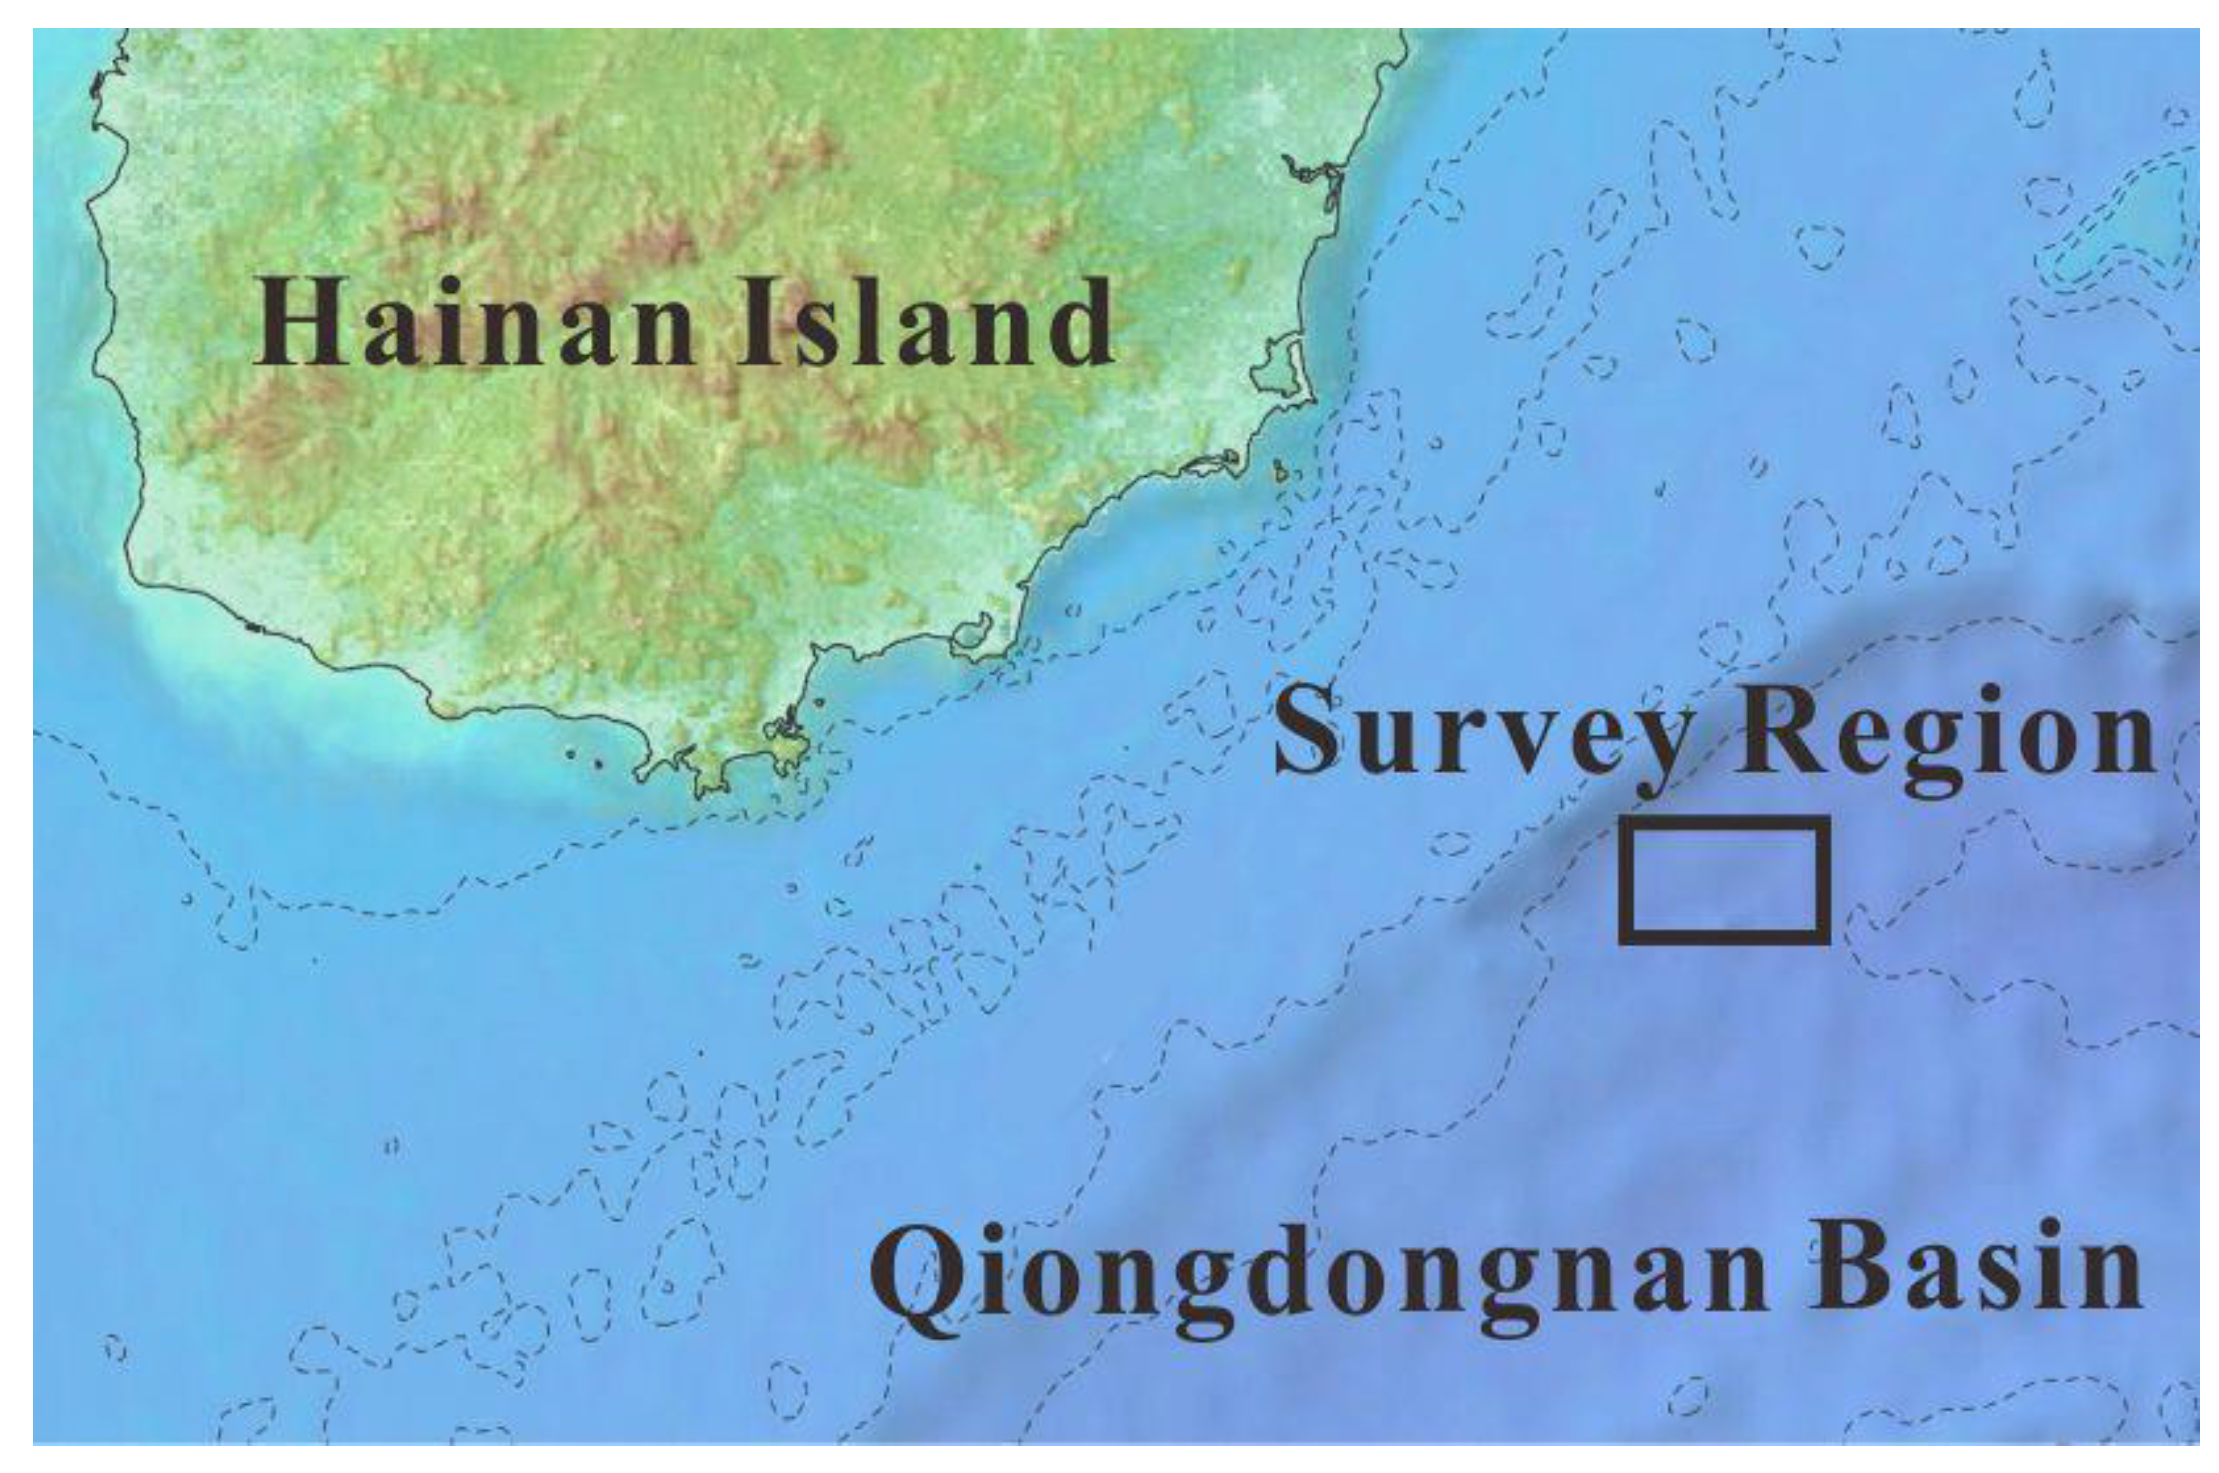
Figure 5. Location of marine controlled-source electromagnetic survey of natural gas hydrate in Qiongdongnan Basin.
2.2. Nankai Trough of Japan
The marine seismic surveys around Japan identified many BSRs. Among the seismic inferred gas hydrate occurrences, the Nankai Trough proved to be the best-known gas hydrate accumulation offshore of Japan. So far, based on the geological exploration and drilling expeditions investigation, two gas hydrate trail production tests have been carried out [12][14]. The Nankai Trough is the southwest portion of the Japanese island arc and was formed by the subduction of the Philippine plate to the Eurasian plate before the Pliocene. The deepest water depth of the trough ranges from 4500 to 4900 m [46]. At present, the exploration locations are mainly distributed along the Daini-Atsumi Knoll (Figure 6) [47].
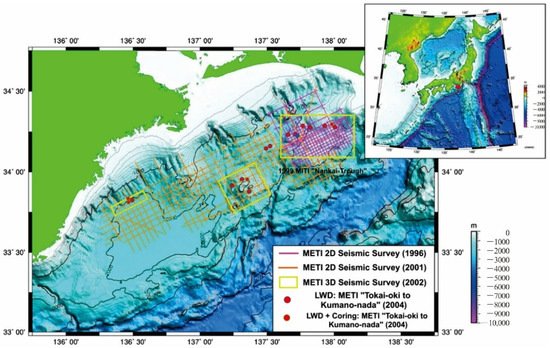
Figure 6. Map of gas hydrate seismic surveys in the eastern Nankai Trough [47].
In 2004, a multi-well exploration campaign in the Nankai Trough was conducted as a national project led by Ministry of Economy, Trade and Industry (METI) of Japan [48][49]. There were 30 wells drilled mainly for geological research purposes and 2 wells drilled for engineering experiment during this campaign. The experimental wells are located in the north end of the Daini-Atsumi Knoll. The formations can be classified into three targeted resistivity log inferred reservoir sections. The muddy portion of the reservoir yielded resistivity log values averaging about 1.5 Ω·m, which is underlain by interbedded methane hydrate and mud layers. The alternated layers were several centimeters to meters in thickness. The formation resistivity log values ranged widely from 2 Ω·m to 30 Ω·m due to the presence of gas hydrate. The non-hydrate bearing formation was at the deepest position, with the resistivity log values ranging from 1.5 to 1.8 Ω·m.
2.3. Ulleung Basin of East Sea
Located on the eastern edge of the Eurasian plate, Ulleung basin is a continental back-arc basin with many block-migration deposits growth. Natural gas hydrate mainly exists in the sandy turbidite layer, which occurs in argillaceous deposits or as vain and fracture-filled. South Korea conducted two gas hydrate expeditions in the Ulleung Basin in 2007 and 2010 (Figure 7) [50].
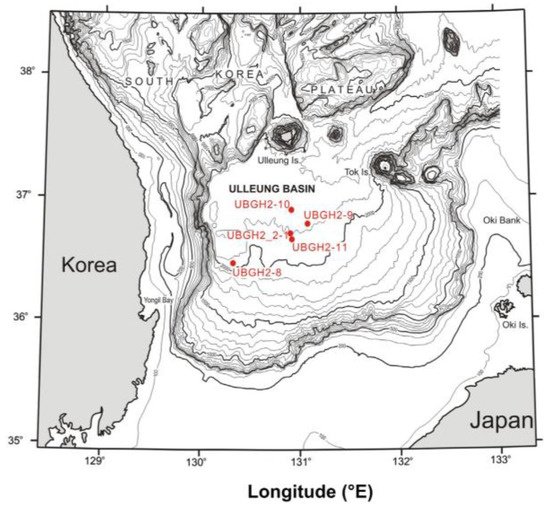
Figure 7. Schematic diagram of natural gas hydrate exploration drill sites in the Ulleung Basin [51].
During these expeditions, both vein-filling gas hydrates and pore-filling gas hydrate existed in the reservoir [52]. The resistivity data was acquired by LWD operations [51]. The LWD-tool string (provided by Schlumberger) contained the GeoVision (electrical imaging), EsoScope (propagation resistivity, bulk density, and neutron porosity), TeleScope, and Sonic Vision tools. Here the ring-resistivity log values acquired by the GeoVision were used. The downhole resistivity log data from Sites UBGH1-9 and UBGH1-10 as an example, there were pronounced increases in resistivity log values above the BSR. In UBGH1-9, the resistivity values of the gas hydrates layer increased to over 12 Ω·m and greater values were higher than 80 Ω·m at UBGH1-10. The values seen in these two logs were significantly higher than the unconsolidated sediments of the East Japan Sea [53][54], with an average value of 0.8 Ω·m. These high anomaly resistivity data not only indicate the existence of gas hydrate but also suggest the different types of occurrences. The morphologies of massive or fracture filling hydrate usually are vein, nodule, or lamina (Figure 8) [54], resulting in a high degree of anisotropy, and the resistivity is extremely high.
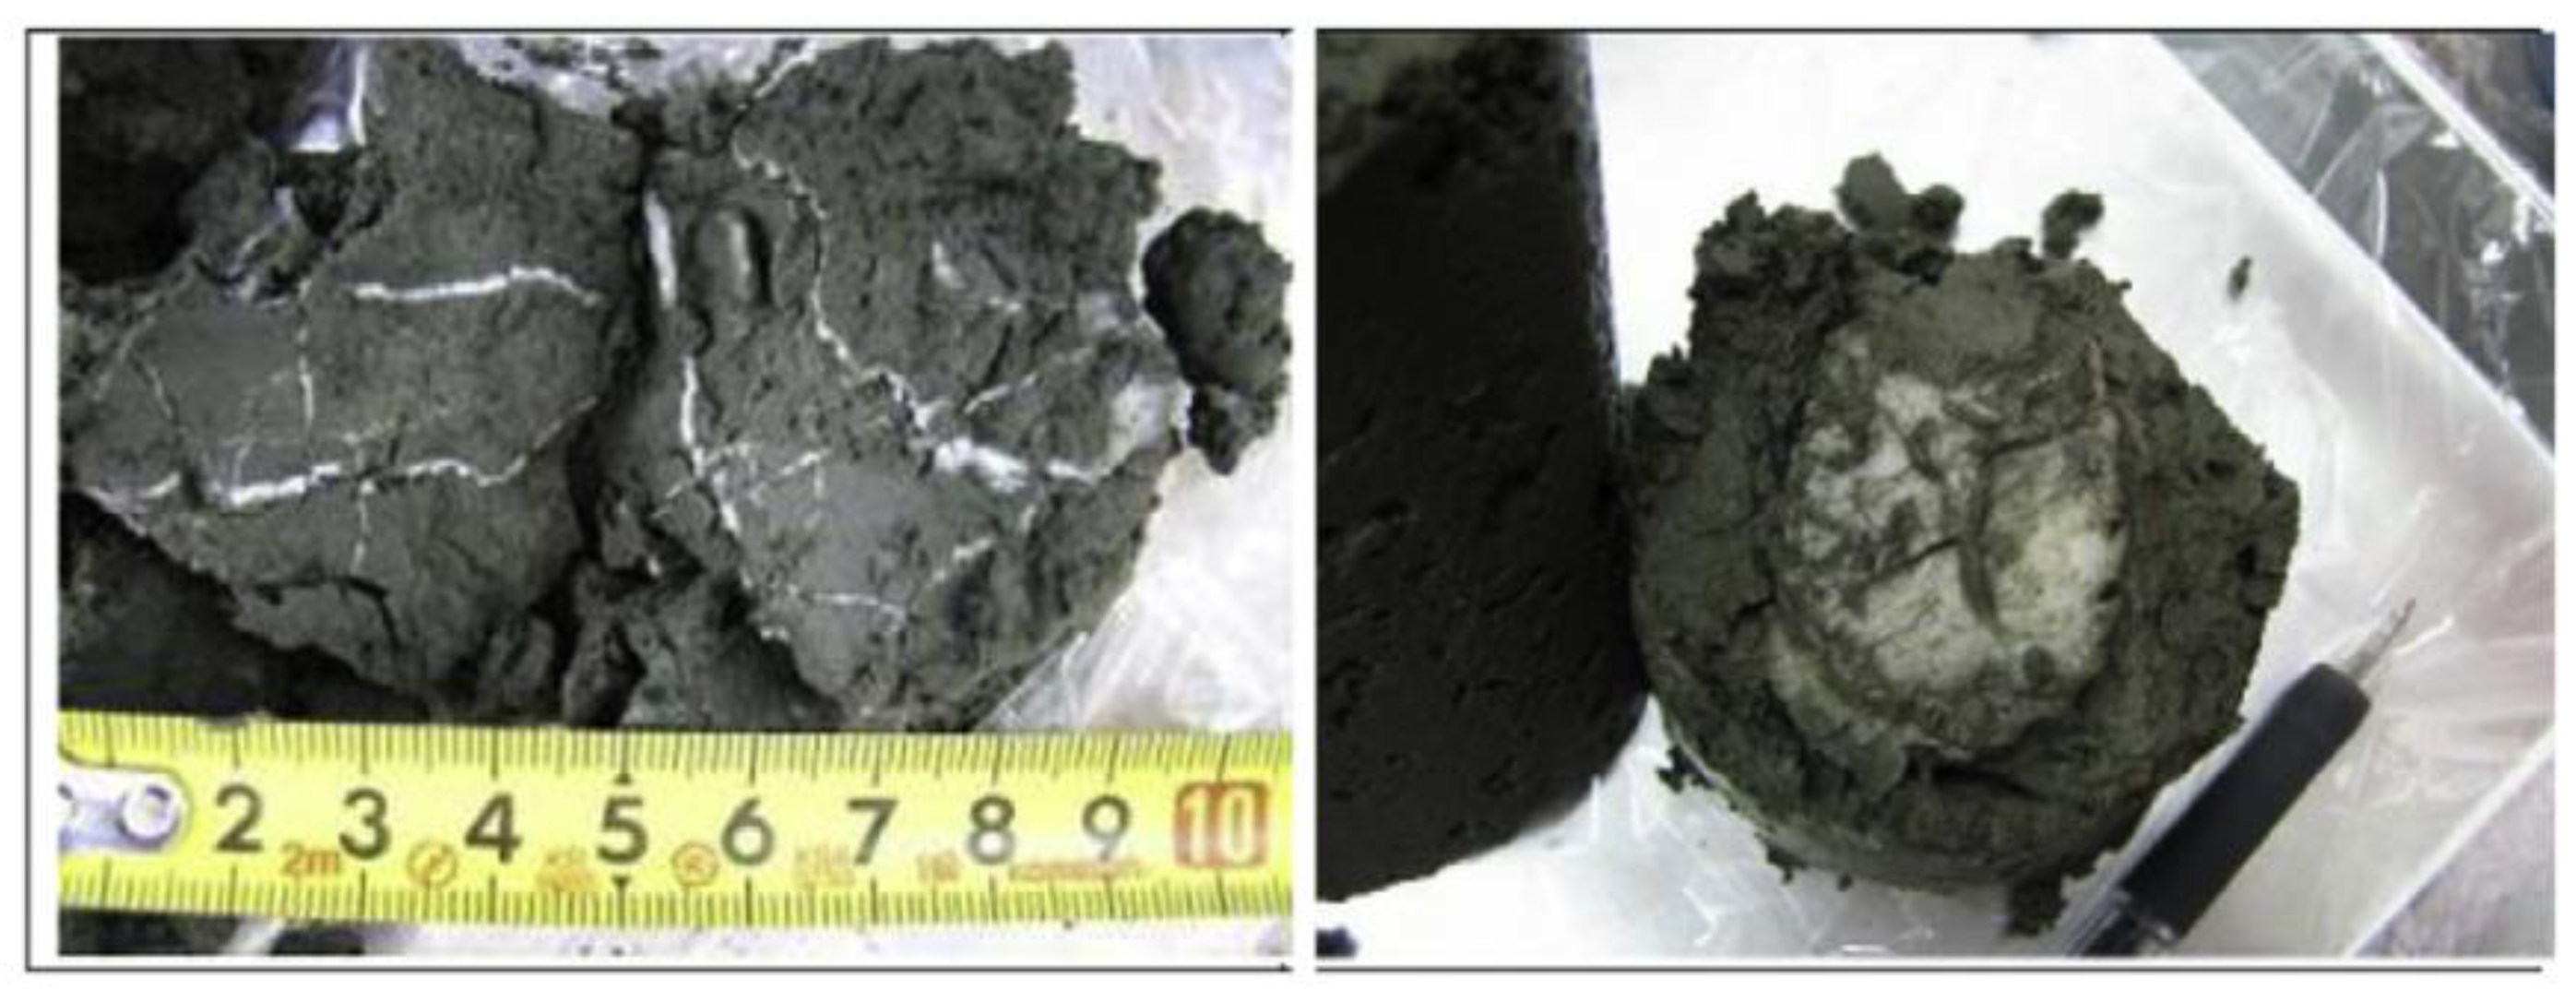
Figure 8. Gas hydrate samples collected from UBGH1-10B-19H [52].
Riedel et al. used the LWD data of UBGH2 to define the empirical Archie-constants to estimate the gas hydrate saturation [51]. They pointed out that pore filling gas hydrate was more suitable for Archie-based calculations, however, the Archie-constants were still strongly dependent on reservoir properties. For sites located in the northeastern part of the Ulleung Basin, changes in sedimentation patterns within the hemipelagic and turbidite sequences can be linked to patterns in the acquired well log data curves and the correlated to Archie interfered hydrate-bearing reservoirs, at sites located more in the western and southern portion of the basin. The top veneer of hemipelagic and turbidite sediments was mostly absent and the entire depth interval of the gas hydrate stability zone was dominated by stacks of mass transport deposits (MTDs) and Archie inferred interbedded gas hydrate-bearing reservoirs.
2.4. The Krishna–Godavari(K-G) Basin
The Krishna–Godavari Basin was formed along the rifted eastern continental margin of India, the offshore K-G Basin is considered a potential gas hydrate province [55]. The Ministry of Petroleum and Natural Gas began the National Gas Hydrates Program (NGHP) in 1997 and implemented NGHP-01 and NGHP-02 in the year 2006 and 2015 [56]. NGHP-01 investigated 21 sites in total, including 12 boreholes for logging while drilling (LWD) and 13 boreholes for wireline logging (WL). NGHP-02 collected LWD and sediment core data in Area B & C offshore of eastern India (Figure 9), to investigate controls on the distribution and peak saturation of methane gas hydrate occurrences in the buried channel, levee, and fan deposits [57].
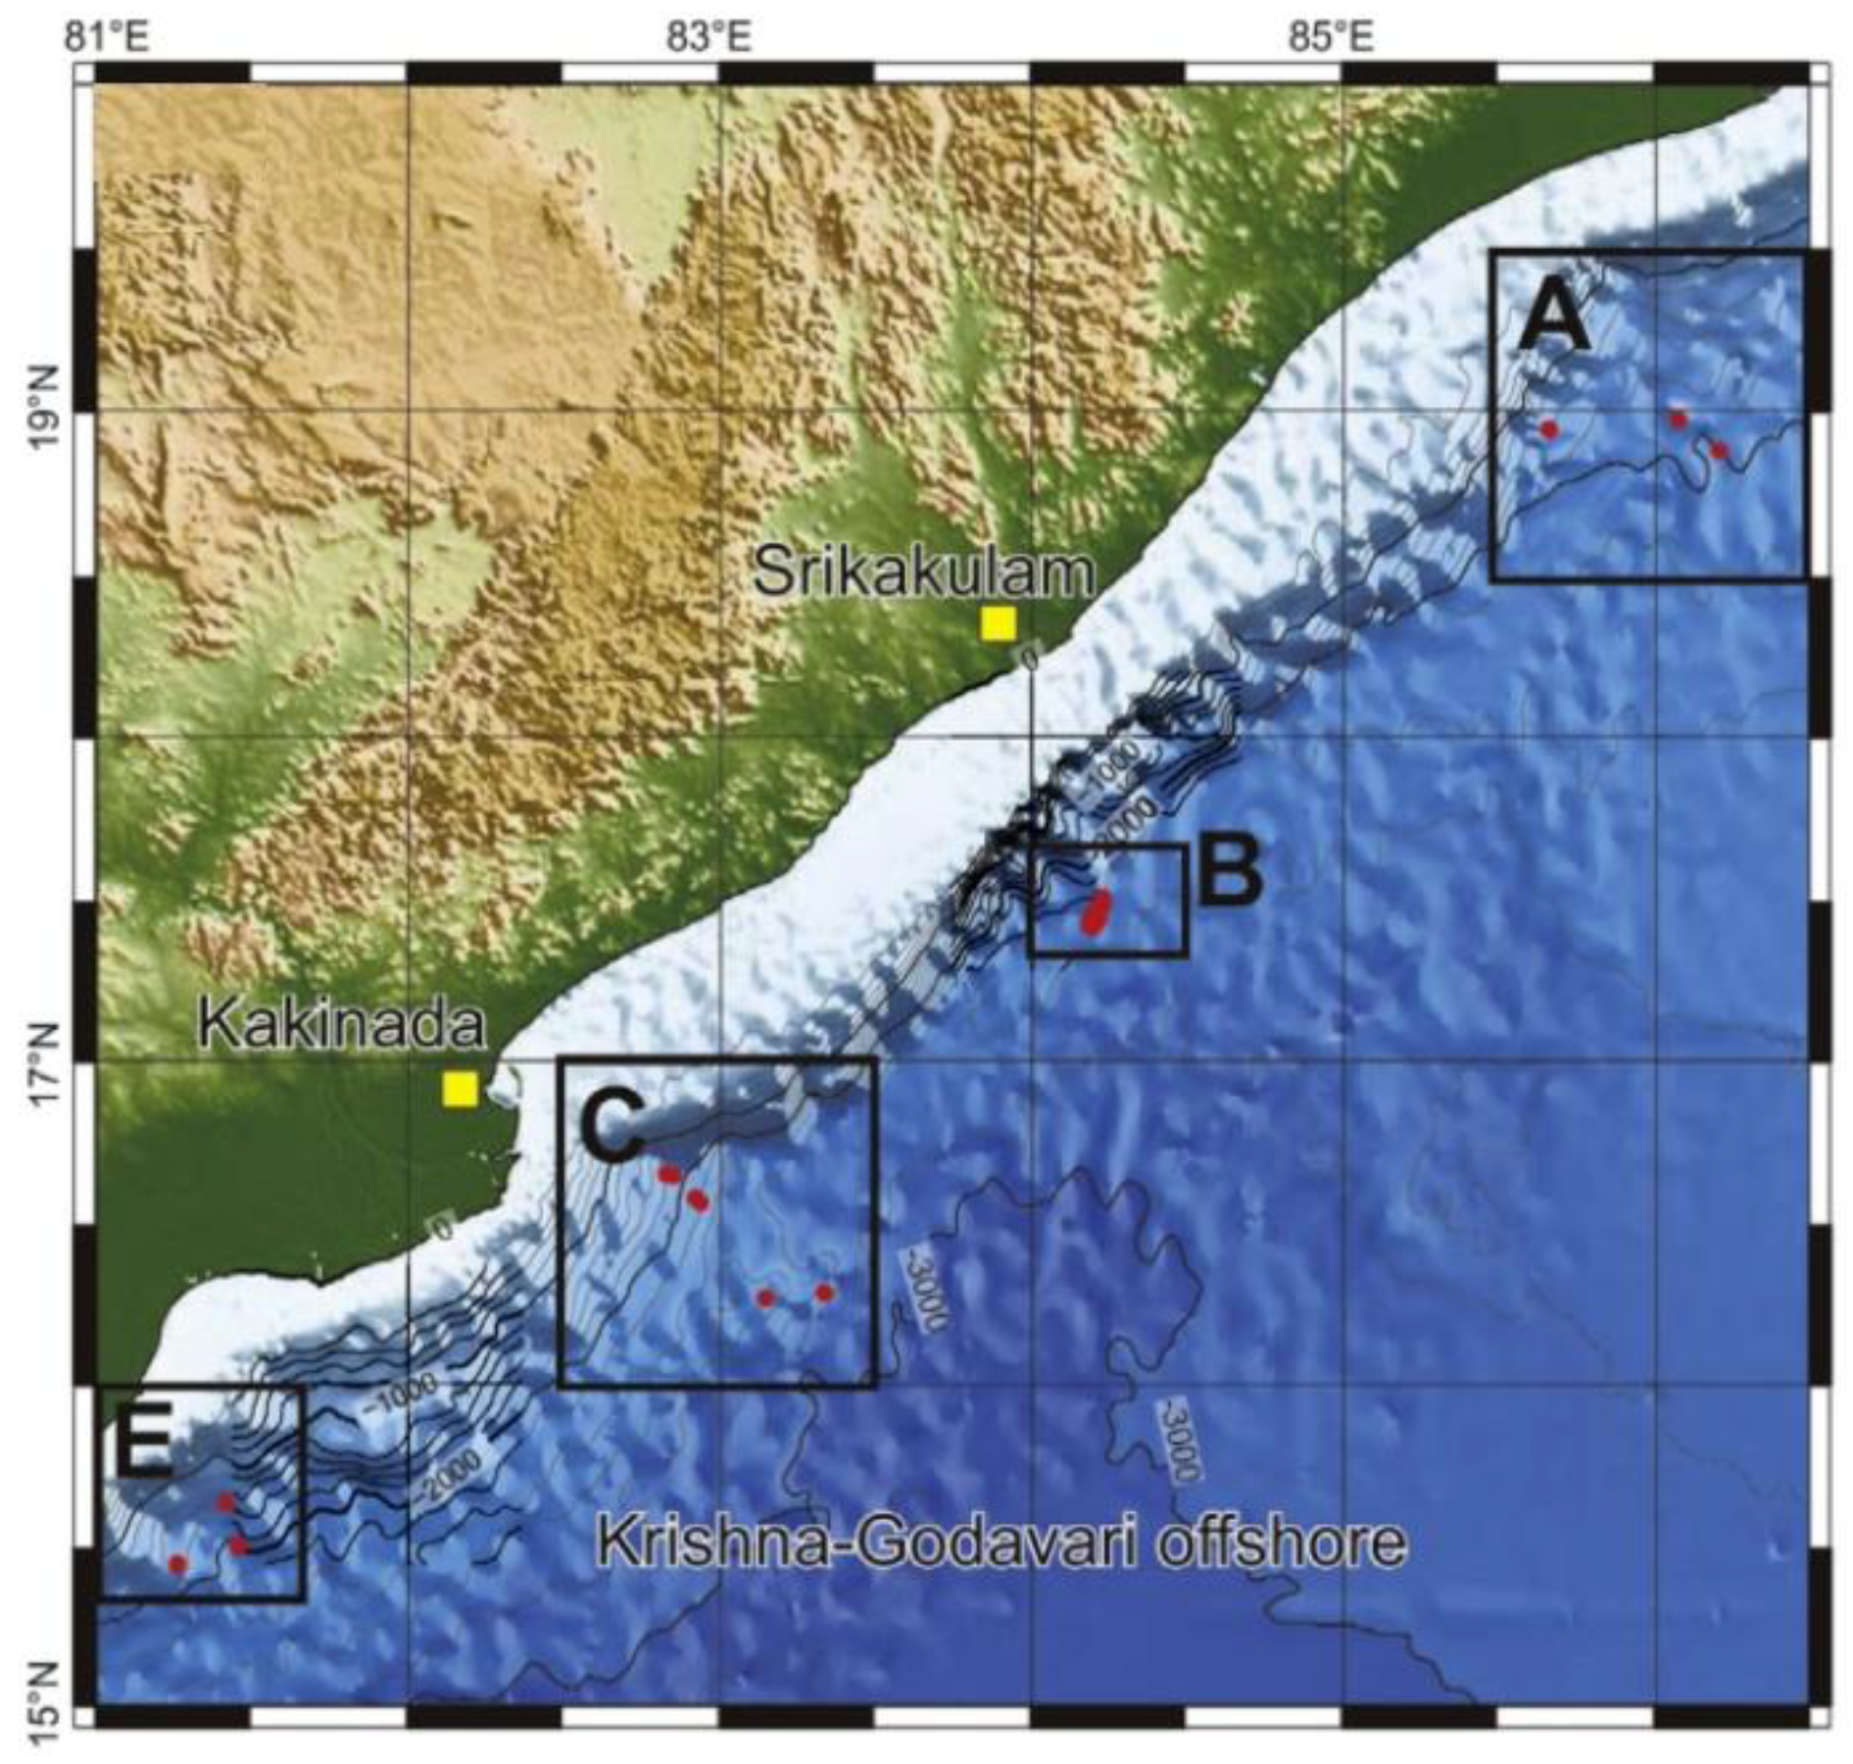
Figure 9. Gas hydrate research areas established during NGHP-02 (Areas A,B,C and E) [58].
NGHP-02-07 targeted the upper continental slope channel deposit, NGHP-02-08 targeted levee deposits, and NGHP-02-05 targeted a sequence of fan deposits. Coarse grained sediment exists at each site, but the clay distribution is different. Clay plays an important role in gas hydrate distribution and saturation. Electrical resistivity log data were obtained with the Schlumberger LWD GeoVision resistivity at the bit (RAB) tool. The background resistivity of Area C was about 1 to 2 Ω·m.
The most significant pore-occupying gas hydrate accumulation at Site NGHP-02-07 occurred between 109 to 113 mbsf. Gas hydrate-filled fractures were in fine-grained sediment above and below the primary reservoir unit, characterized by slightly elevated resistivities. The most significant gas hydrate accumulations at Site NGHP-02-08 occurred between 246 to 271 mbsf, but the thinly bedded nature of this site presents a challenge to make direct depth correlations between the LWD results and the recovered sediment core. The main gas hydrate accumulations at Site NGHP-02-05 were between 485 mbsf and the consensus base of hydrate occurrence at 508 mbsf. At certain depths, gas hydrate layers were associated with coarse-grained units, with resistivity as high as about 10 Ω·m.
2.5. The Blake Ridge
The Blake Ridge is a positive topographic sedimentary feature on the continental slope. The crest of the ridge extends to the general trend of the continental rise from water depths of 2000 to 4800 m. The thickness of the gas hydrate stability zone ranges from zero along the northwestern edge of the continental shelf to a maximum thickness of about 700 m along the eastern edge of the Blake Ridge (Figure 10) [59].
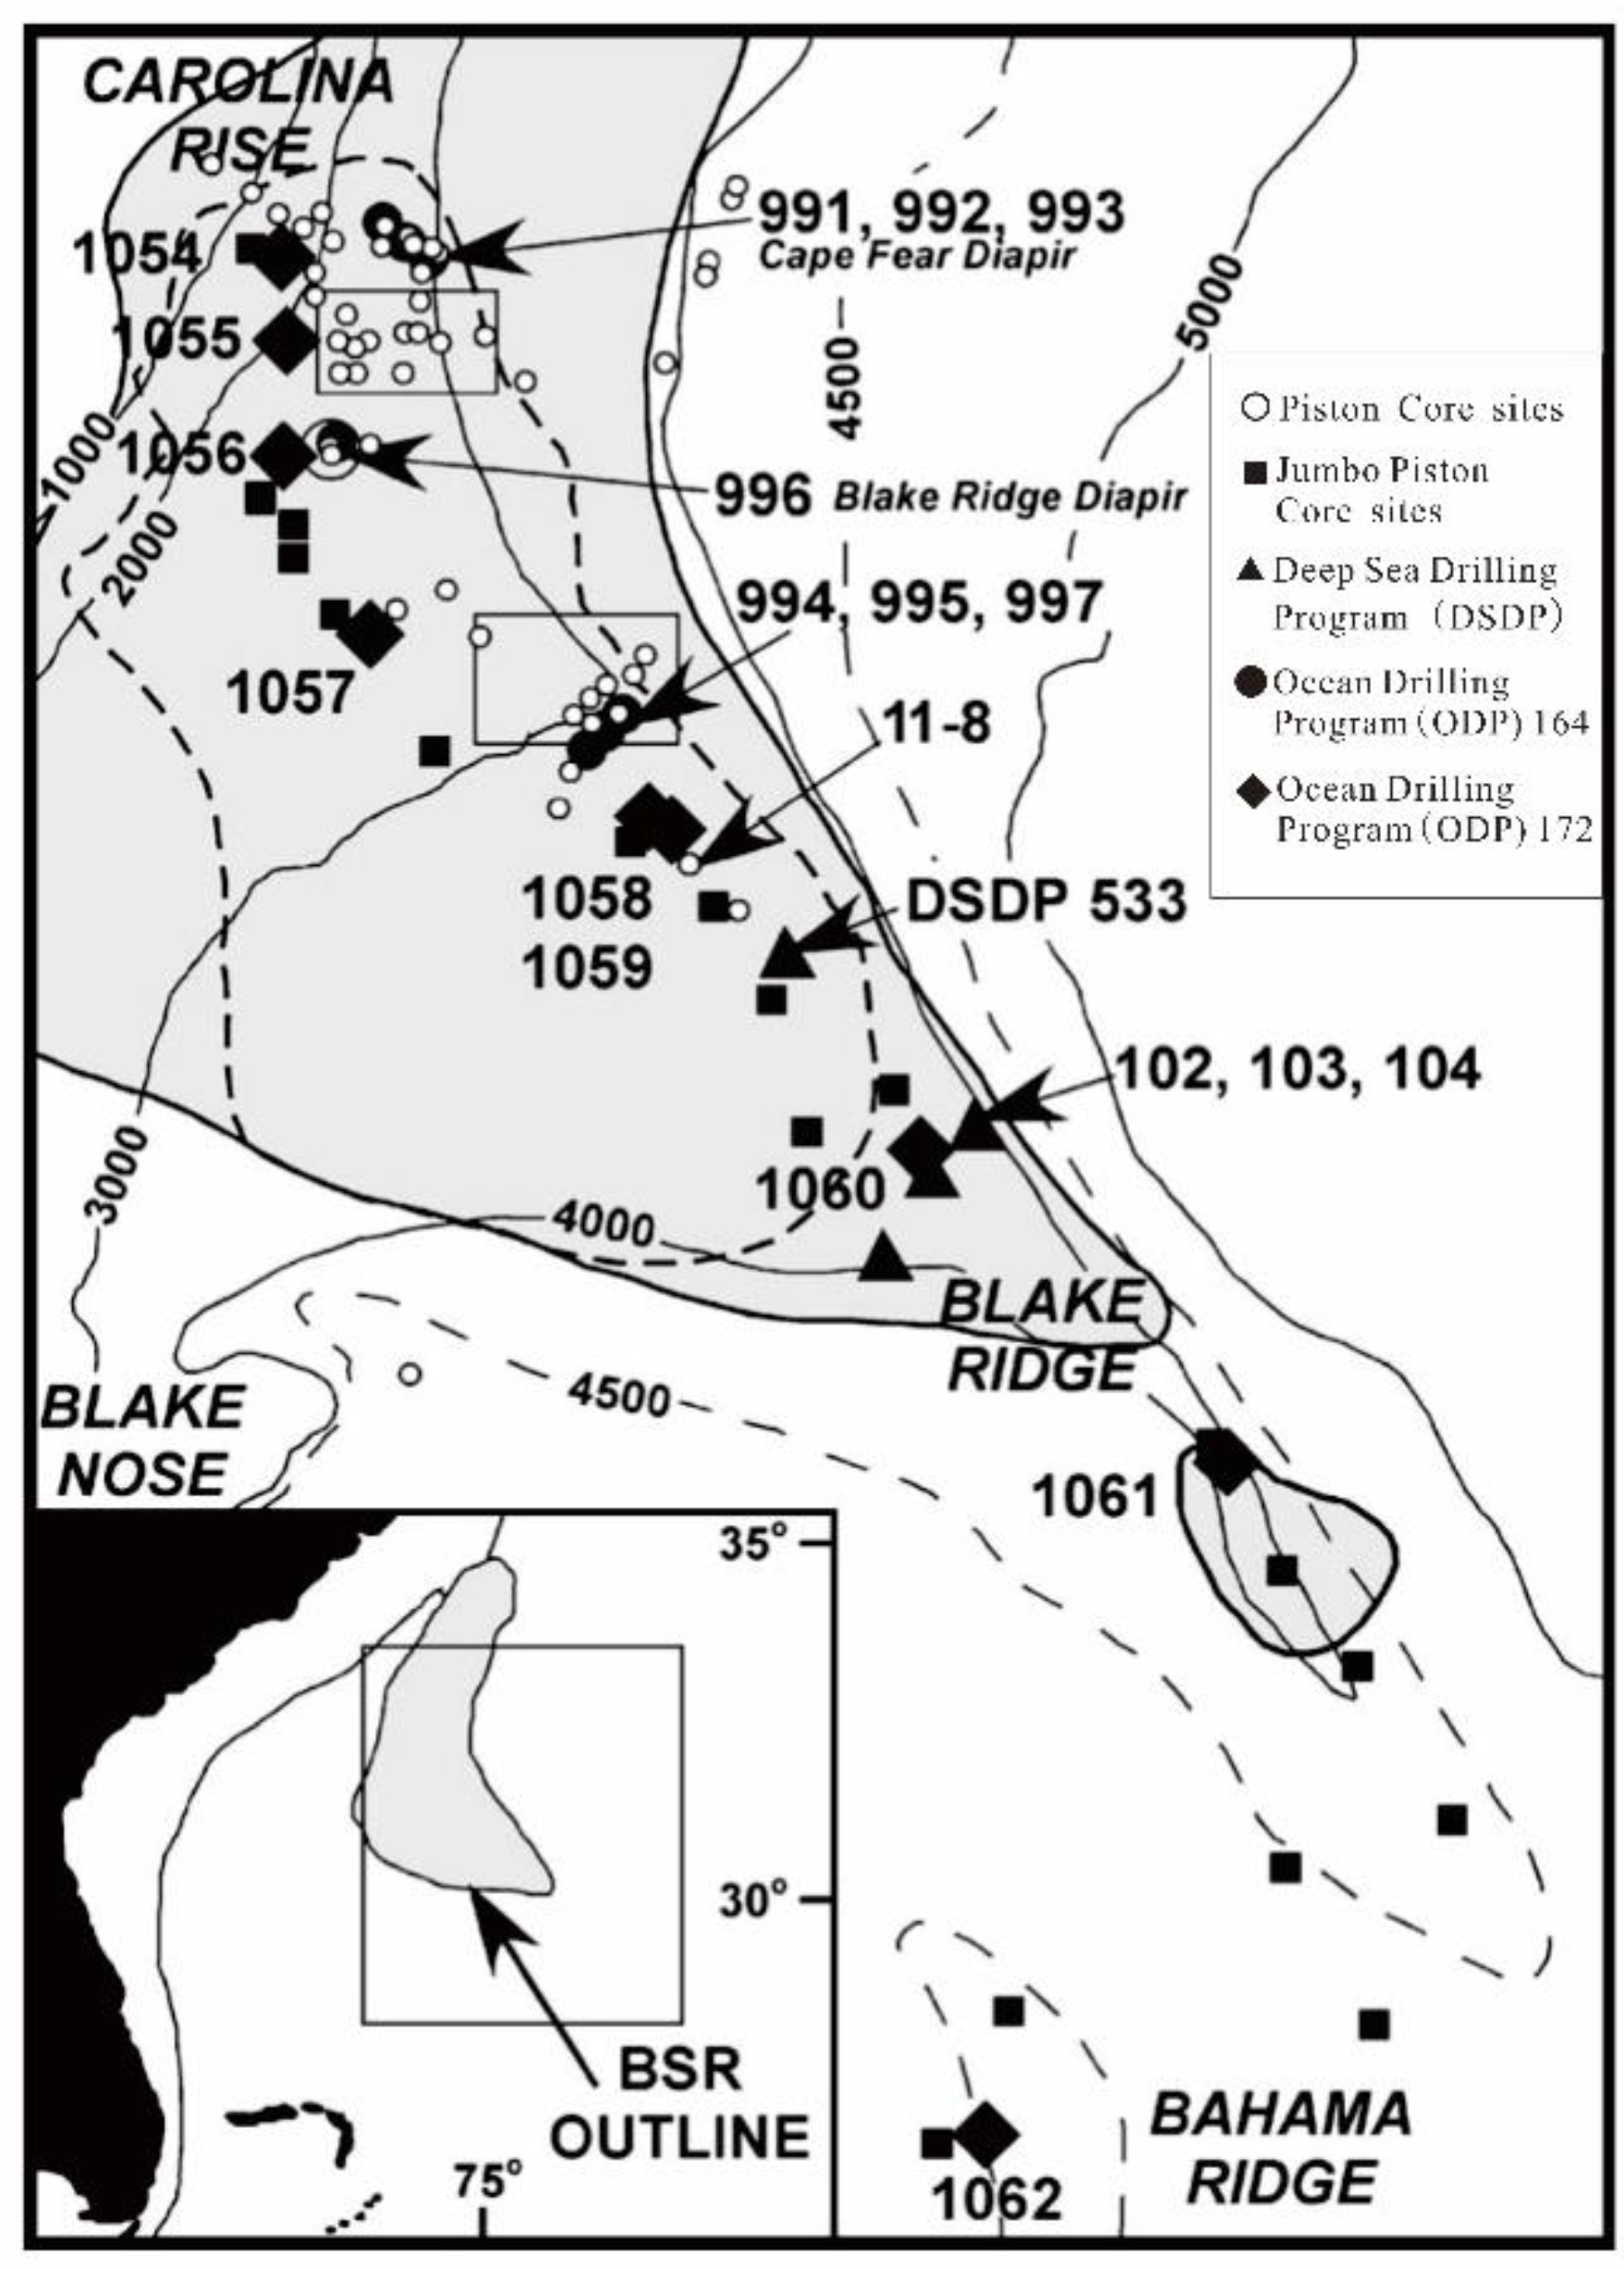
Figure 10. Location map for the Blake Ridge region [59].
Leg 164 of the Ocean Drilling Program was designed to investigate the occurrence of gas hydrate on the Blake Ridge. Electrical resistivity and other downhole logs from Sites 994, 995, and 997 indicate the presence of gas hydrate in the depth interval between 185 and 450 mbsf. The description of the logged intervals in Holes 994D, 995B, and 997B are shown in Figure 11.
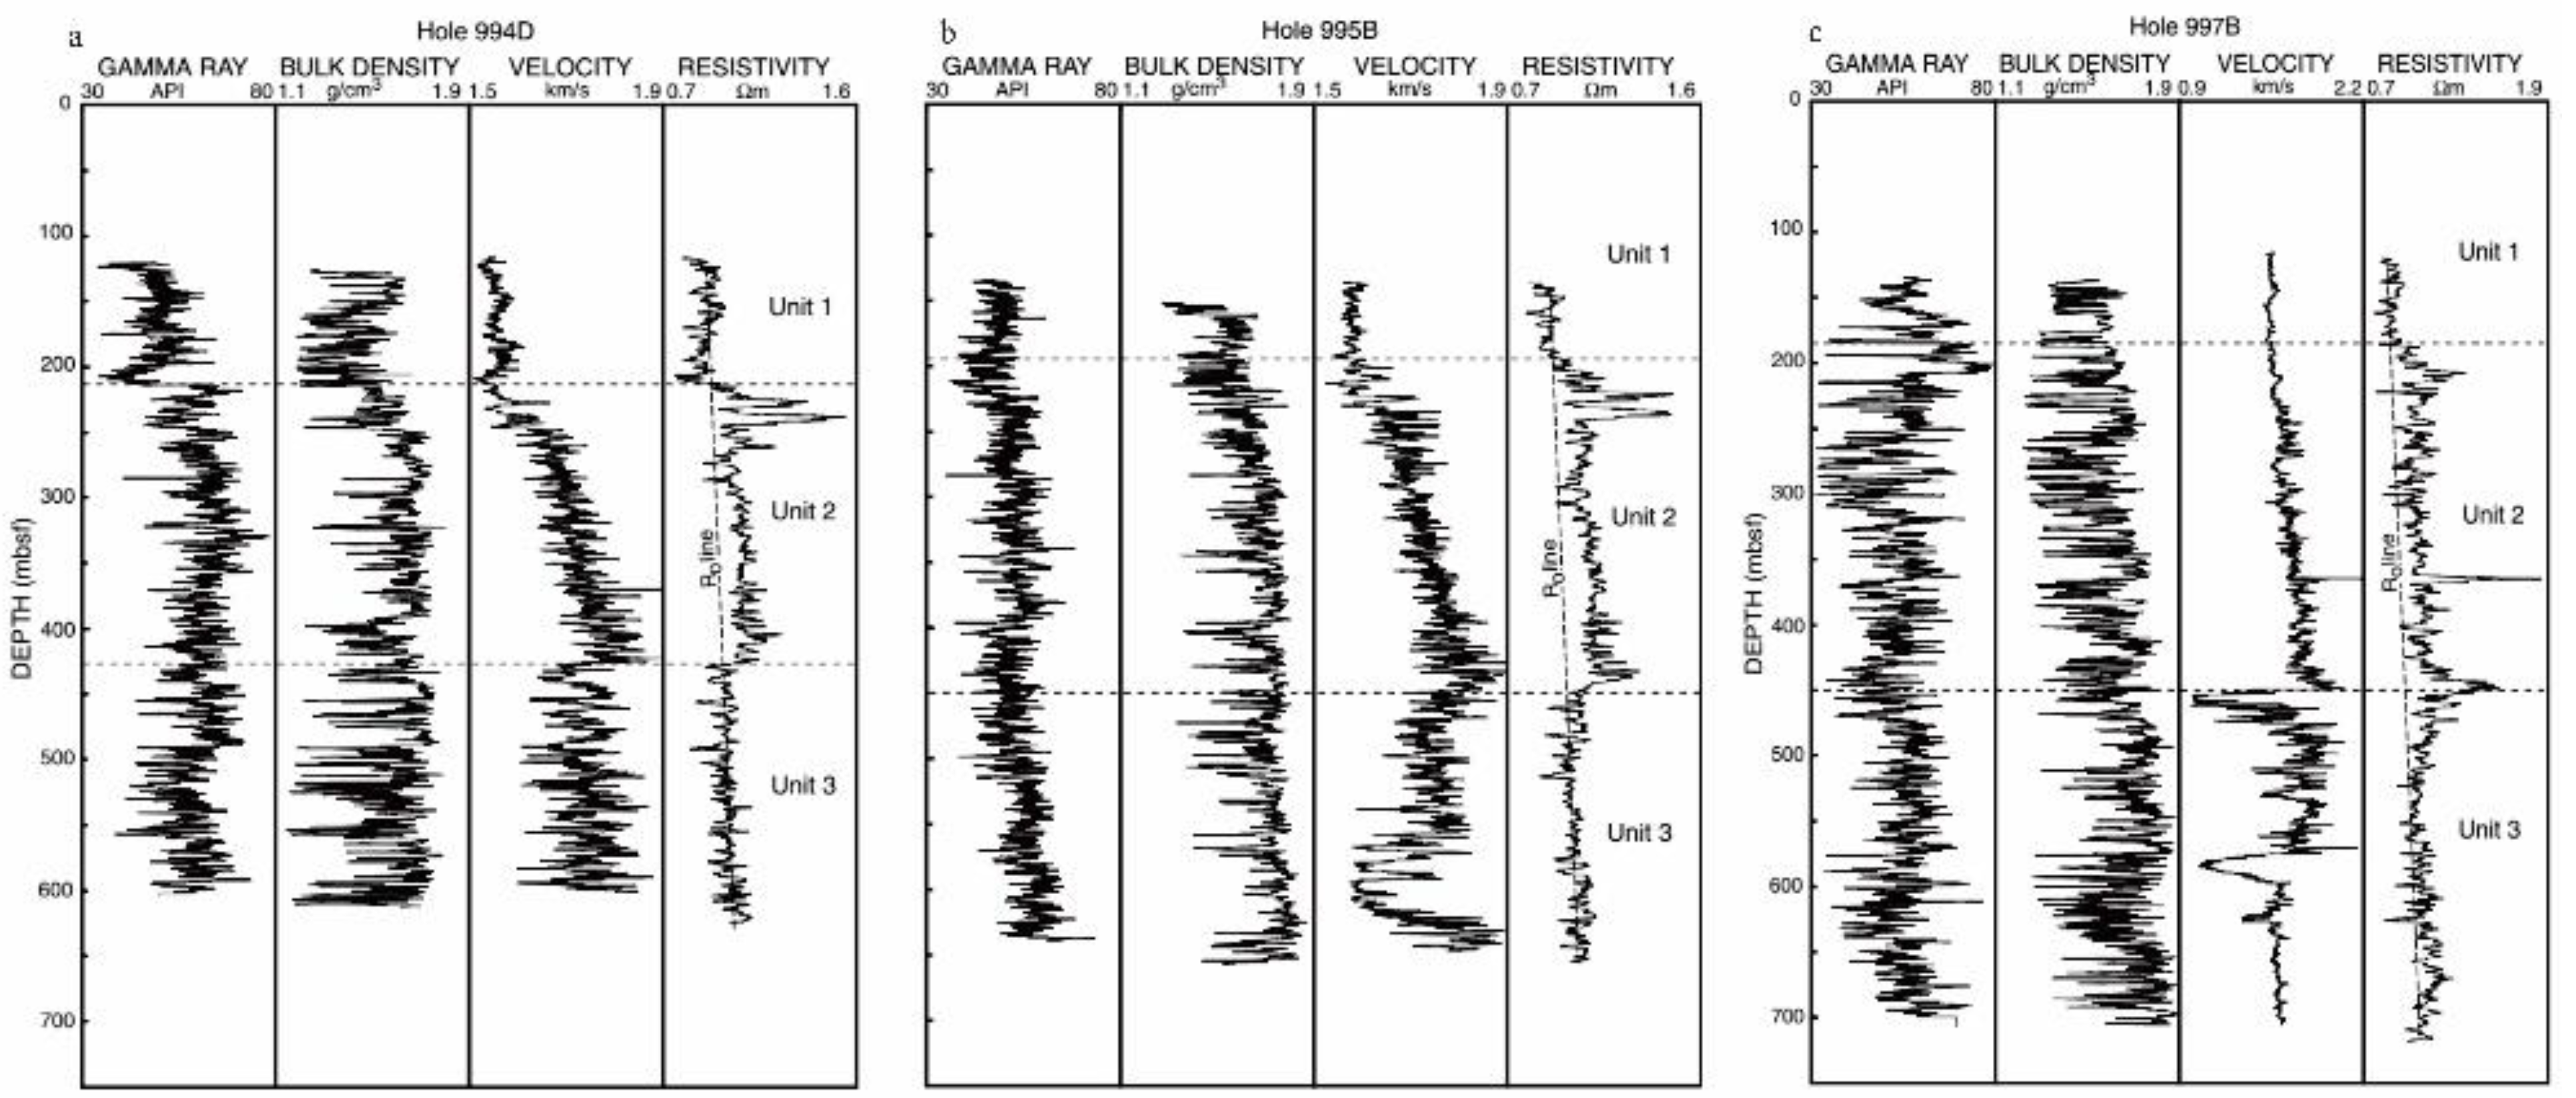
Figure 11. Downhole log data from Hole 994D, 995B and 997B [60]. ((a) Downhole log data from Hole 994D, (b) Downhole log data from Hole 995B, (c) Downhole log data from Hole 997B).
Three units were divided on the base of obvious changes in physical properties. The comparison of logging Units 1, 2, and 3 in these holes revealed that Unit 2 was characterized by a distinct stepwise increase of about 0.1~0.3 Ω·m in resistivity. The deep reading resistivity device revealed several anomalous high resistivity zones within the upper 100 m of Unit 2 at all three sites: anomalous resistivities ranging from 1.4 to 1.5 Ω·m [60].
2.6. Gulf of Mexico
The Gulf of Mexico is a tectonically active and geologically complex environment characterized by faulting, folding, and other deformational processes that largely arise due to the layering of thick sedimentary sequences over buoyant salt deposits [61]. It has been a major location for the exploration of oil and natural gas resources for decades. The first hydrate-focused drilling expedition in this area was the Chevron-led Gulf of Mexico Gas Hydrate Joint Industry Project (JIP) Leg I in 2005, which drilled and cored three sites to evaluate the sediment and borehole stability. During JIP Leg II in 2009, the LWD measurements were used to detect gas hydrate occurrences in sand reservoirs [61][62]. A total of seven holes were drilled at three sites and hydrate was identified in the Green Canyon and Walker Ridge sites in the sand and marine mud reservoirs. Figure 12 shows the 798 petroleum industry wells drilled in this area, including the gas hydrate JIP wells [63].
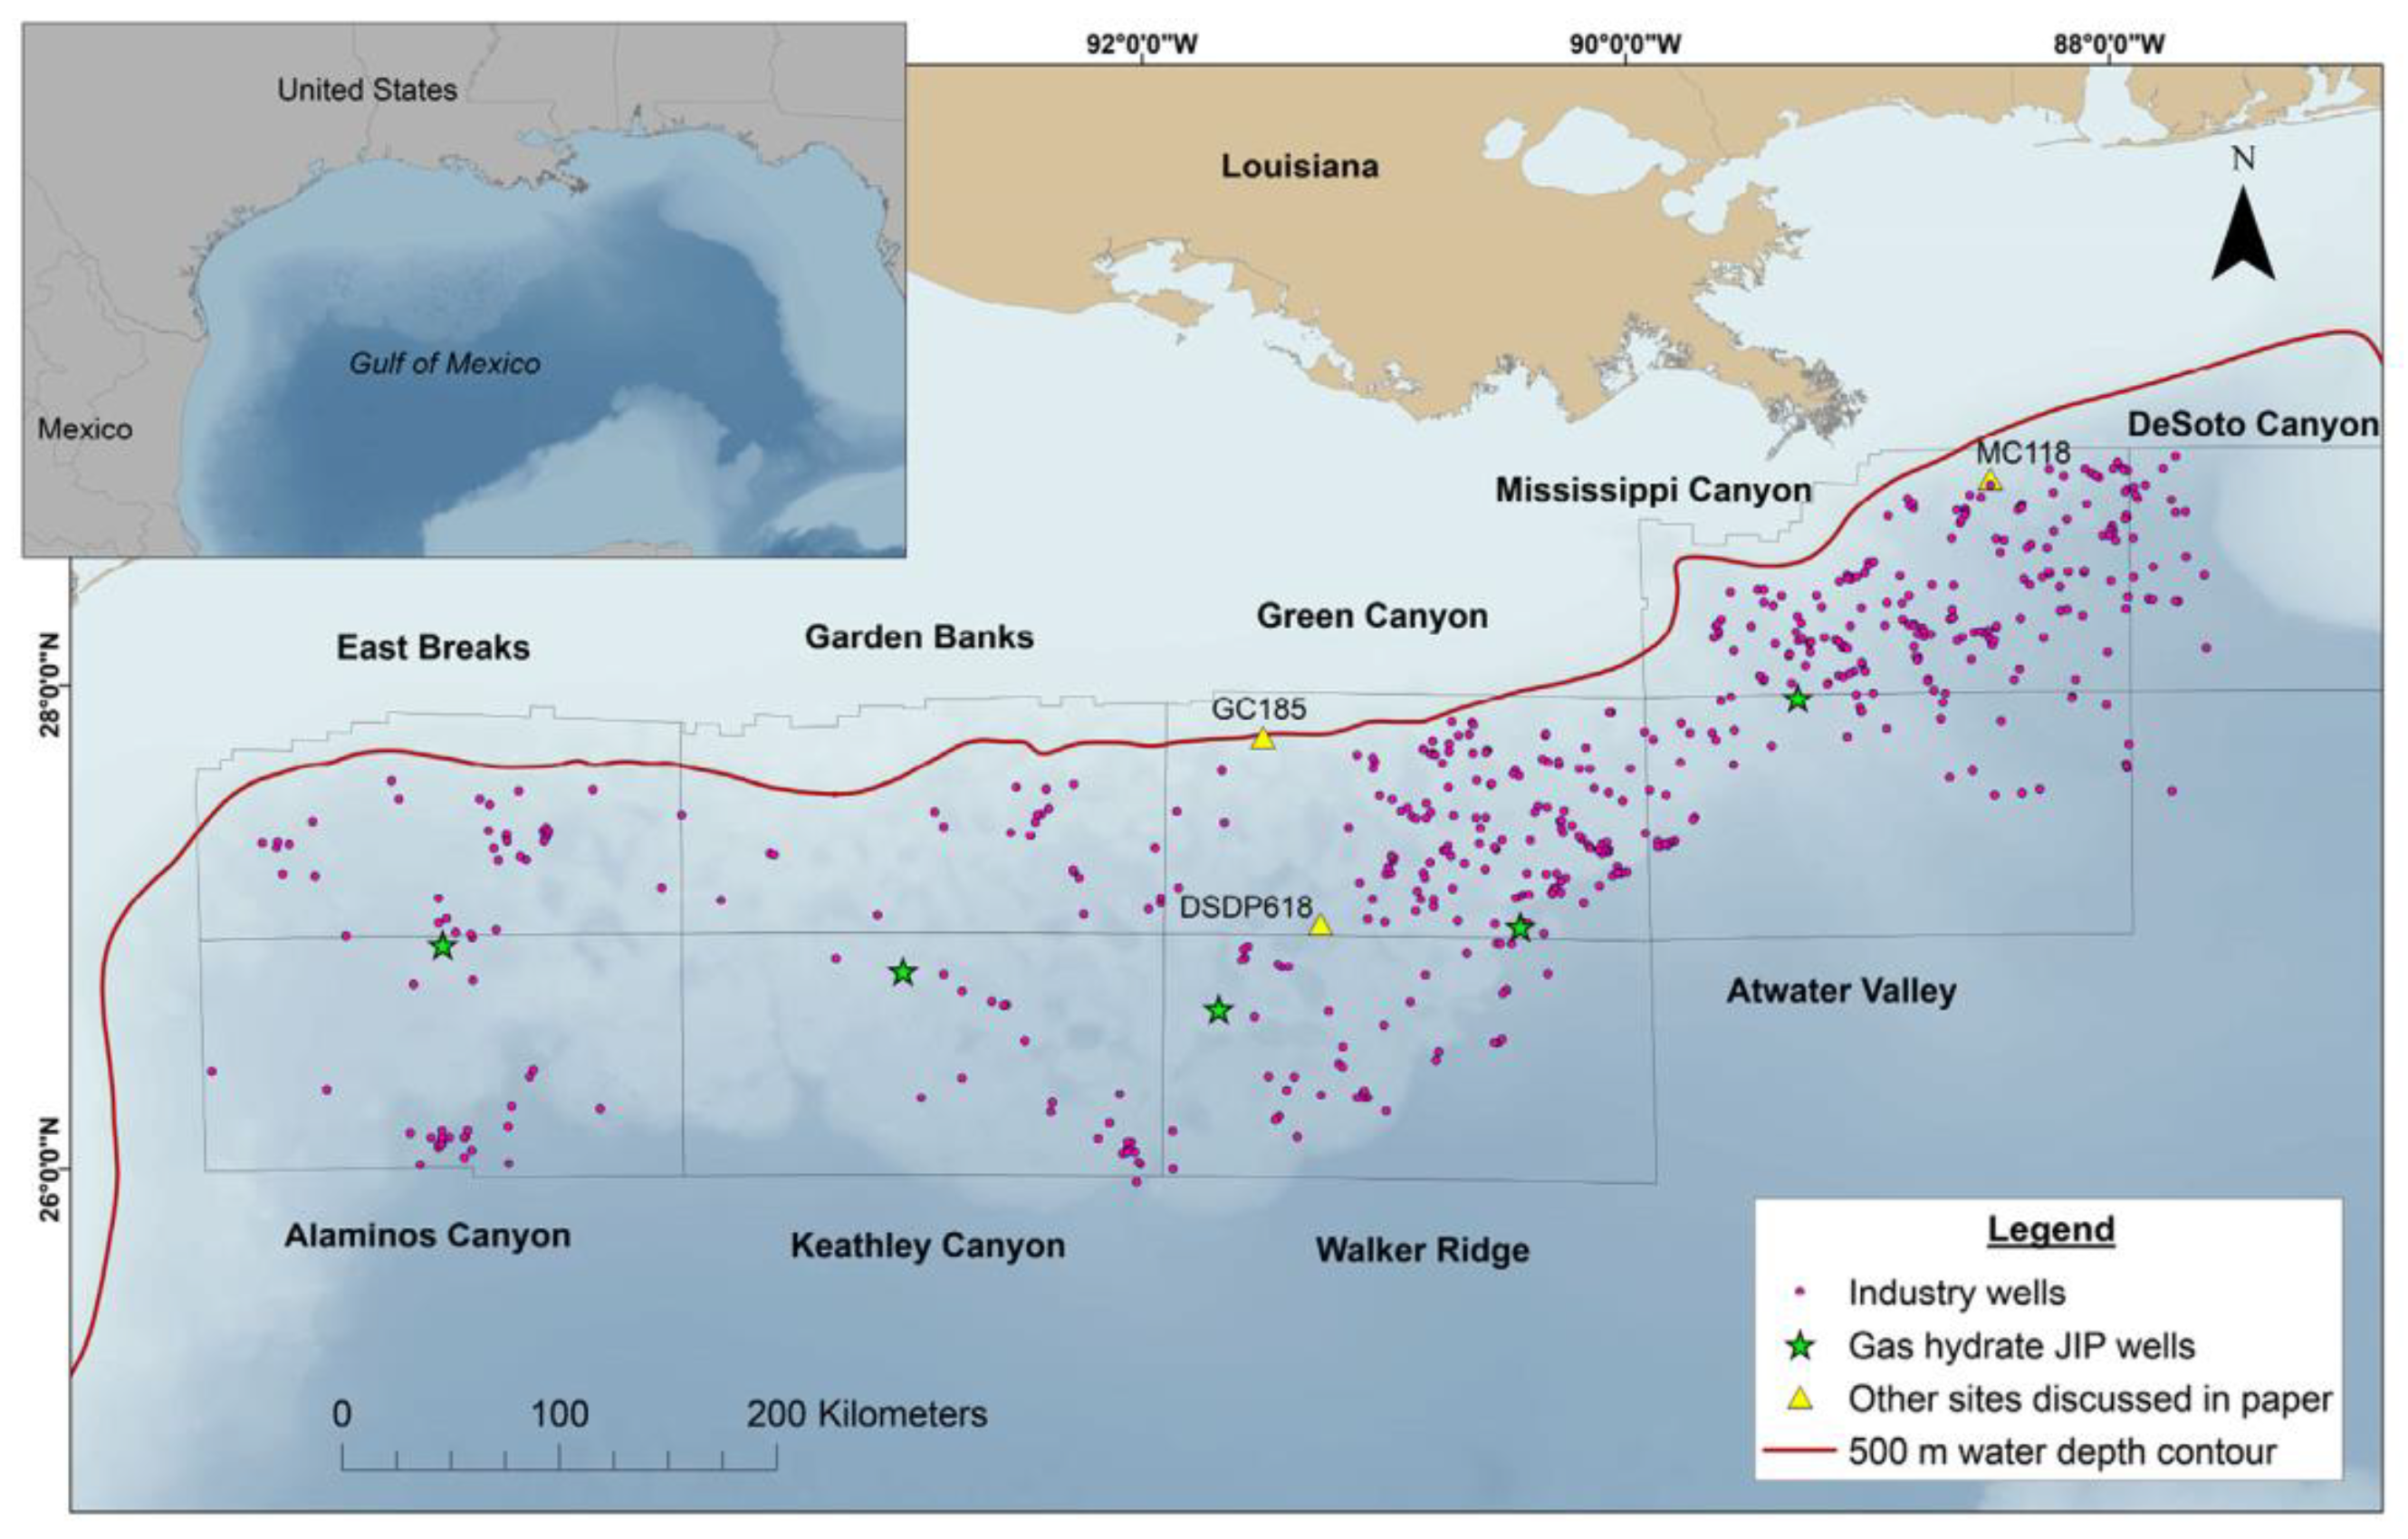
Figure 12. The 798 petroleum industry wells drilled in the northern Gulf of Mexico region, including the sites drilled during JIP Leg I and II [63].
The electrical resistivity properties of marine sediments are mainly controlled by the conductivity and volume of pore fluids present in the sediment. Setting an appropriate cutoff for the resistivity anomaly that is caused by the presence of gas hydrate is a major challenge. In addition to gas hydrate, several additional factors also yield higher formation resistivities, such as variations in pore–fluid salinities, lithology changes with depth, and the over-compaction of sediments, and so on. Majumdar et al. suggested using the criterion of 0.5 Ω·m or greater increases in formation resistivity as indicative of the presence of gas hydrate [64].
A well from Alaminos Canyon Block 856 was taken as an example. The depth of the base of the gas hydrate stability zone is 2898 m, with a background resistivity of 1 Ω·m. The interpreted gas hydrate interval is at a depth of 2568 to 2611 m with an increase in resistivity of 0.5 Ω·m to a maximum 1 Ω·m above background resistivity [63].
2.7. Cascadia Margin
The Cascadia subduction zone extends from northern California to offshore Vancouver Island. The presence of gas hydrate has been established by widespread BSR. However, the major advance in identifying gas hydrate comes from ODP sampling and downhole measurements (Figure 13) [65].
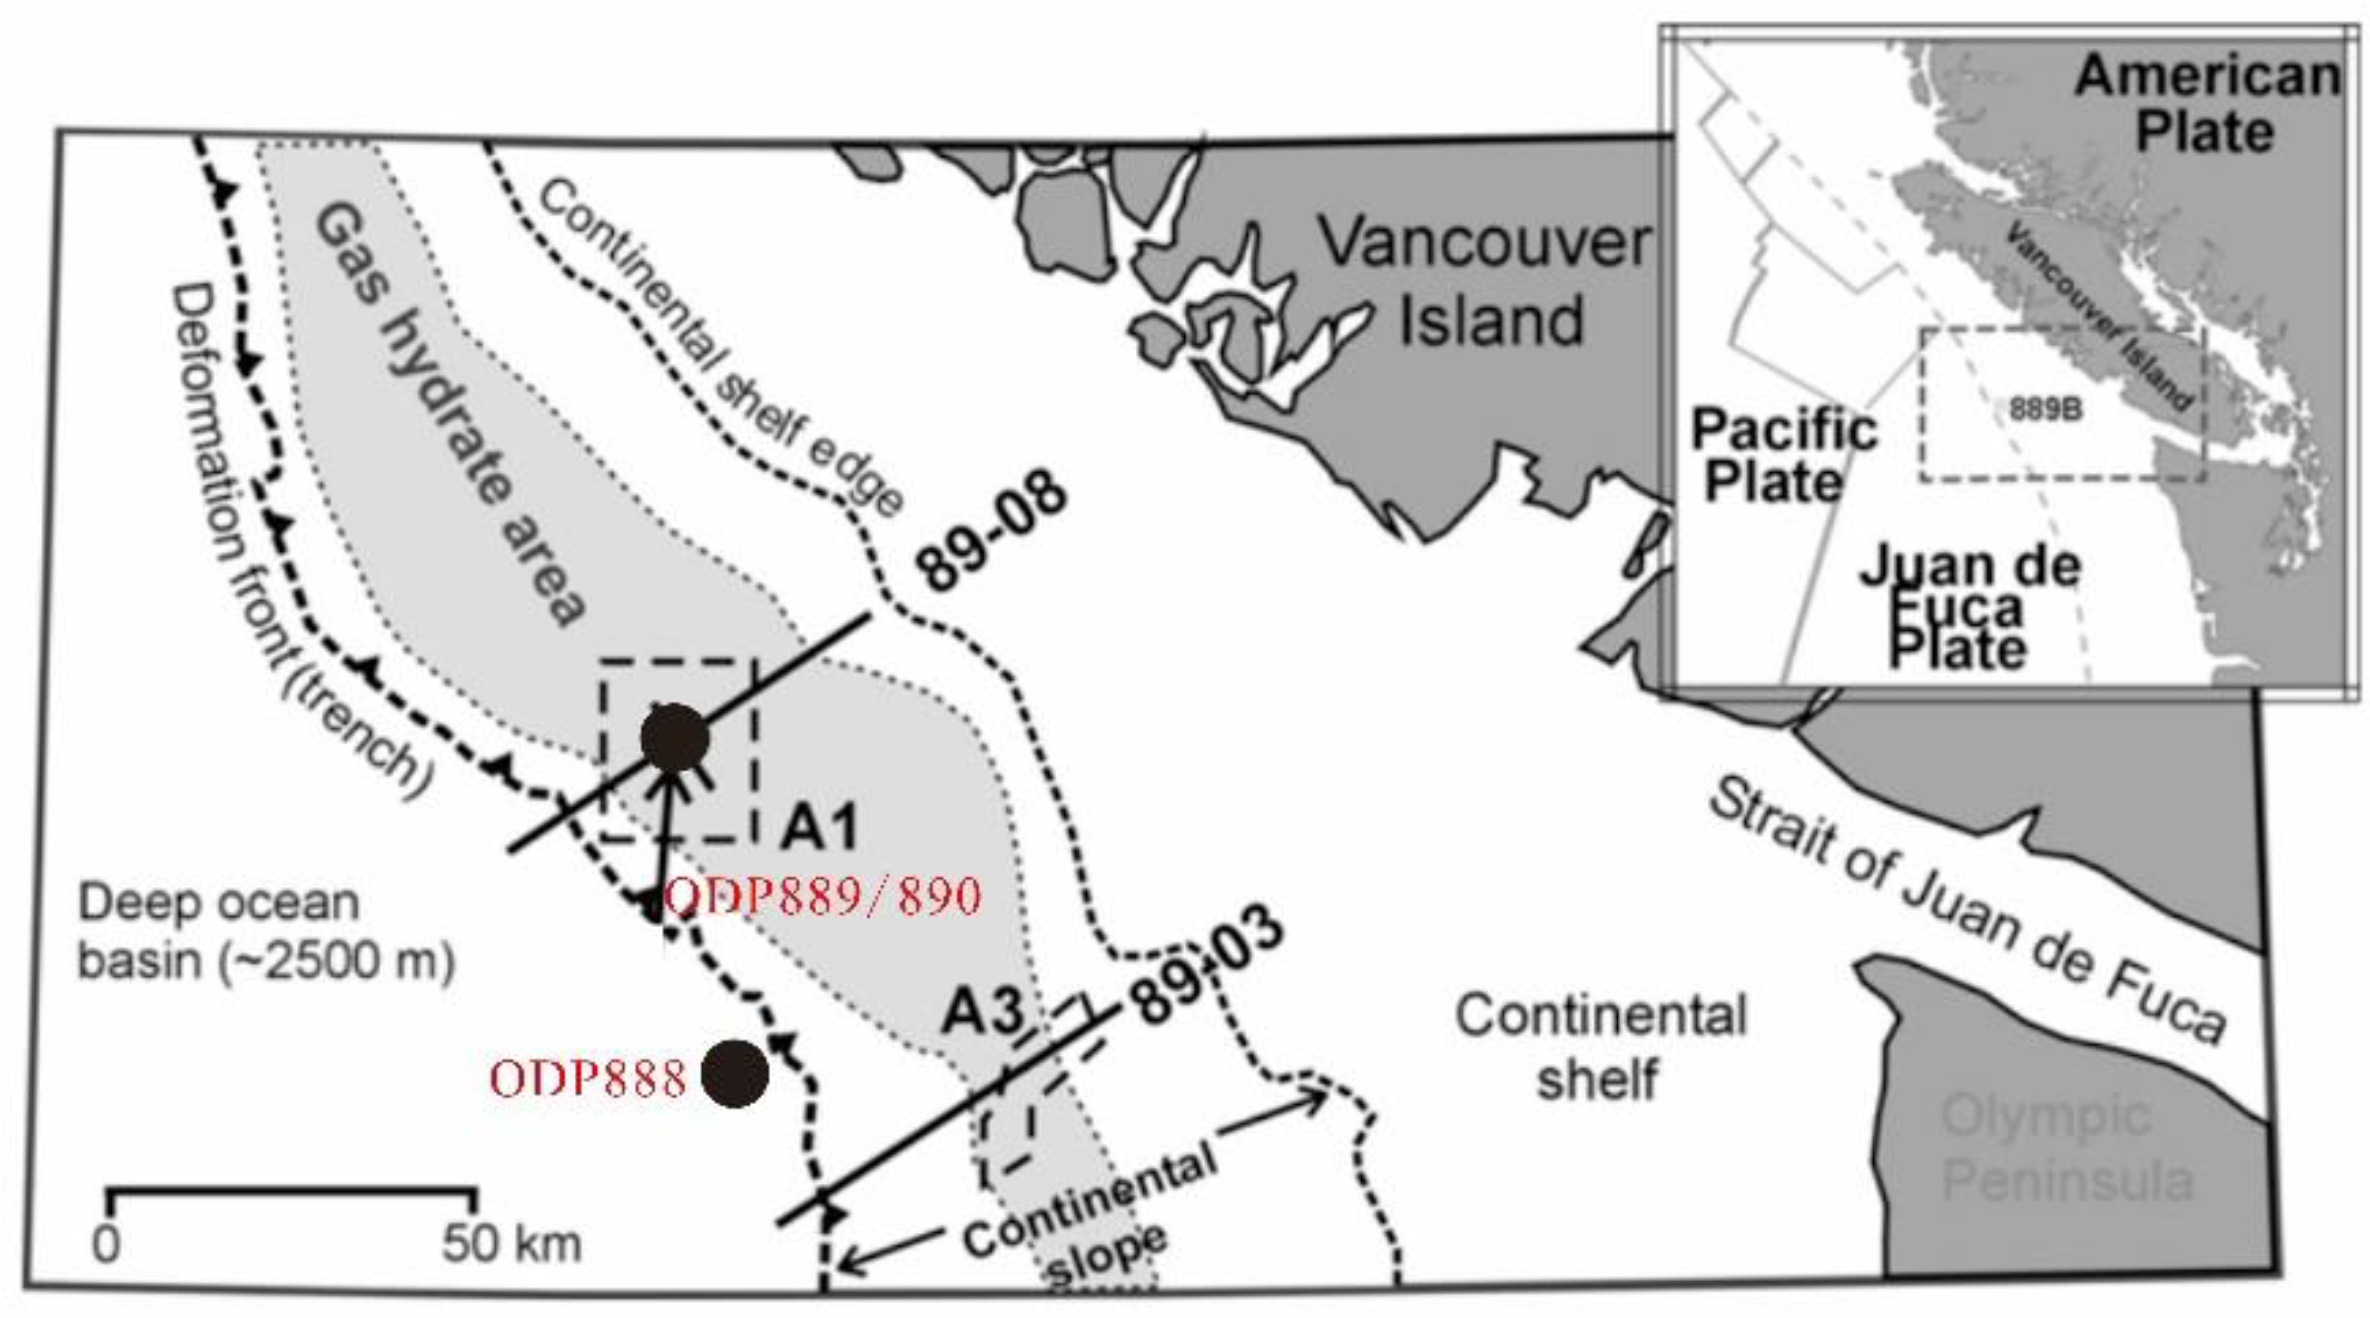
Figure 13. The northern Cascadia margin showing the region where gas hydrate is found [66].
The electrical resistivity logs for Site 888 provide a reference location for a site with no evidence of gas hydrate with an average resistivity log value of 1Ω·m. In contrast, the resistivity for Site 889/890 increased steadily to a value of 2.1 Ω·m for the 100 m above the BSR. There was no sharp resistivity discontinuity at the BSR, but a significant downward decrease appeared in the resistivity log values below the BSR, to about 1.8 Ω·m. The resistivity–depth log can be used along with porosity–depth logs to estimate hydrate saturation [65][67][68].
This entry is adapted from the peer-reviewed paper 10.3390/jmse10050645
References
- Boswell, R.; Hancock, S.; Yamamoto, K.; Collett, T.; Pratap, M.; Lee, S.-R. 6-Natural Gas Hydrates: Status of Potential as an Energy Resource. In Future Energy, 3rd ed.; Letcher, T.M., Ed.; Elsevier: Amsterdam, The Netherlands, 2020; pp. 111–131.
- Sloan, E.D. Clathrate Hydrates of Natural Gases, 2nd ed.; Revised and Expanded; CRC Press: Boca Raton, FL, USA, 1998.
- Liu, B.; Chen, J.; Pinheiro, L.M.; Yang, L.; Liu, S.; Guan, Y.; Song, H.; Wu, N.; Xu, H.; Yang, R. An insight into shallow gas hydrates in the Dongsha area, South China Sea. Acta Oceanol. Sin. 2021, 40, 136–146.
- Matsumoto, R.; Aoyama, C. Verifying Estimates of the Amount of Methane Carried by a Methane Plume in the Joetsu Basin, Eastern Margin of the Sea of Japan. J. Geogr. Chigaku Zasshi 2020, 129, 141–146.
- Daigle, H.; Cook, A.; Malinverno, A. Formation of massive hydrate deposits in Gulf of Mexico Sand Layers. Fire Ice 2018, 18, 1–3.
- Riedel, M.; Collett, T.S.; Shankar, U. Documenting channel features associated with gas hydrates in the Krishna–Godavari Basin, offshore India. Mar. Geol. 2011, 279, 1–11.
- Boswell, R.; Shipp, C.; Reichel, T.; Shelander, D.; Saeki, T.; Frye, M.; Shedd, W.; Collett, T.S.; McConnell, D.R. Prospecting for marine gas hydrate resources. Interpretation 2016, 4, SA13–SA24.
- Collett, T.; Bahk, J.; Baker, R.; Boswell, R.; Divins, D.; Frye, M.; Goldberg, D.; Husebø, J.; Koh, C.; Malone, M.; et al. Methane Hydrates in Nature—Current Knowledge and Challenges. J. Chem. Eng. Data 2015, 60, 319–329.
- Collett, T.S.; Johnson, A.H.; Knapp, C.C.; Boswell, R. Natural gas hydrates—A review. Brows. Collect. 2009, 89, 146–219.
- Ye, J.L.; Qin, X.W.; Xie, W.W.; Lu, H.L.; Ma, B.J.; Qiu, H.J.; Liang, J.Q.; Lu, J.A.; Kuang, Z.G.; Lu, C.; et al. Main progress of the second gas hydrate trial production in the South China Sea. Geol. China 2020, 47, 557–568.
- Wu, N.; Li, Y.; Wan, Y.; Sun, J.; Huang, L.; Mao, P. Prospect of marine natural gas hydrate stimulation theory and technology system. Nat. Gas Ind. B 2021, 8, 173–187.
- Yamamoto, K.; Wang, X.-X.; Tamaki, M.; Suzuki, K. The second offshore production of methane hydrate in the Nankai Trough and gas production behavior from a heterogeneous methane hydrate reservoir. RSC Adv. 2019, 9, 25987–26013.
- Wu, N.Y.; Huang, L.; Hu, G.W.; Li, Y.L.; Chen, Q.; Liu, C.L. Geological controlling factors and scientific challenges for offshore gas hydrate exploitation. Mar. Geol. Quat. Geol. 2017, 37, 1–11.
- Konno, Y.; Fujii, T.; Sato, A.; Akamine, K.; Naiki, M.; Masuda, Y.; Yamamoto, K.; Nagao, J. Key Findings of the World’s First Offshore Methane Hydrate Production Test off the Coast of Japan: Toward Future Commercial Production. Energy Fuels 2017, 31, 2607–2616.
- Giavarini, C.; Hester, K. Methods to Predict Hydrate Formation Conditions and Formation Rate. In Gas Hydrates; Springer: London, UK, 2011; pp. 49–57.
- Waite, W.F.; Ruppel, C.D.; Boze, L.-G.; Lorenson, T.D.; Buczkowski, B.J.; McMullen, K.Y.; Kvenvolden, K.A. Preliminary Global Database of Known and Inferred Gas Hydrate Locations; U.S. Geological Survey, Coastal and Marine Hazards and Resources Program: Woods Hole, MA, USA, 2020.
- Bhade, P.; Phirani, J. Effect of geological layers on hydrate dissociation in natural gas hydrate reservoirs. J. Nat. Gas Sci. Eng. 2015, 26, 1549–1560.
- Li, F.; Yuan, Q.; Li, T.; Li, Z.; Sun, C.; Chen, G. A review: Enhanced recovery of natural gas hydrate reservoirs. Chin. J. Chem. Eng. 2018, 27, 2062–2073.
- Ning, F.L.; Liang, J.Q.; Wu, N.Y.; Zhu, Y.H.; Wu, S.G.; Liu, C.L.; Wei, C.F.; Wang, D.D.; Zhang, Z.; Xu, M.; et al. Reservoir characteristics of natural gas hydrates in China. Nat. Gas Ind. 2020, 40, 1–24.
- Wang, L.F.; Fu, S.Y.; Liang, J.Q.; Shang, J.J.; Wang, J.L. A review on gas hydrate developments propped by worldwide national projects. Geol. China 2017, 44, 439–448.
- Guan, J.A.; Fan, S.S.; Liang, D.Q.; Wan, L.H.; Li, D.L. An overview on gas hydrate exploration and exploitation in natural fields. Adv. New Renew. Energy 2019, 7, 522–531.
- Berndt, C.; Bünz, S.; Clayton, T.; Mienert, J.; Saunders, M. Seismic character of bottom simulating reflectors: Examples from the mid-Norwegian margin. Mar. Pet. Geol. 2004, 21, 723–733.
- Paull, C.K.; Ussler, W., III. History and significance of gas sampling during DSDP and ODP drilling associated with gas hydrates. In Natural Gas Hydrates: Occurrence, Distribution, and Detection; Geophysical Monograph Series; American Geophysical Union: Washington, DC, USA, 2001; Volume 124, pp. 53–65.
- Zhang, T.; Ran, H.; Xu, J.J.; Sha, Z.B.; Jiang, Y.; Wang, K. Research and development progress as well as technical orientation of the natural gas hydrate in Japan. Acta Geosci. Sin. 2021, 42, 196–202.
- Wang, S.L.; Sun, Z.T. Current status and future trends of exploration and pilot production of gas hydrate in the world. Mar. Geol. Front. 2018, 34, 24–32.
- Sha, Z.; Xu, Z.; Wang, P.; Liang, Q.; Wan, X.; Wang, L.; Su, P. World progress in gas hydrate research and its enlightenment to accelerating industrialization in China. Mar. Geol. Front. 2019, 35, 1–10.
- Qian, J.; Wang, X.; Collett, T.S.; Guo, Y.; Kang, D.; Jin, J. Downhole log evidence for the coexistence of structure II gas hydrate and free gas below the bottom simulating reflector in the South China Sea. Mar. Pet. Geol. 2018, 98, 662–674.
- Collett, T.S.; Boswell, R.; Waite, W.F.; Kumar, P.; Roy, S.K.; Chopra, K.; Singh, S.K.; Yamada, Y.; Tenma, N.; Pohlman, J.; et al. India National Gas Hydrate Program Expedition 02 Summary of Scientific Results: Gas hydrate systems along the eastern continental margin of India. Mar. Pet. Geol. 2019, 108, 39–142.
- Zhang, Z.; Wright, C.S. Quantitative interpretations and assessments of a fractured gas hydrate reservoir using three-dimensional seismic and LWD data in Kutei basin, East Kalimantan, offshore Indonesia. Mar. Pet. Geol. 2017, 84, 257–273.
- Wang, X.J.; Wu, S.G.; Liu, X.W.; Guo, Y.Q.; Lu, J.A.; Yang, S.X.; Liang, J.Q. Estimation of gas hydrate saturation based on resistivity logging and analysis of estimation error. Geoscience 2010, 24, 993–999.
- Gongli, W.; Aria, A.; David, A.; Yan, S. Determining anisotropic resistivity in the presence of invasion with triaxial induction data. In Proceedings of the SPWLA 58th Annual Logging Symposium, Oklahoma City, OK, USA, 17–21 June 2017; pp. 1–12.
- Garcia, A.P.; Jagadisan, A.; Rostami, A.; Heidari, Z. A New Resistivity-Based model for Improved Hydrocarbon Saturation Assessment in Clay-Rich Formation using Quantitative Clay Network Geometry and Rock Fabric. In Proceedings of the SPWLA 58th Annual Logging Symposium, Oklahoma City, OK, USA, 17–21 June 2017.
- Chen, Y.F.; Zhou, X.B.; Liang, D.Q.; Wu, N.Y. Resistivity changes of natural gas hydrate formation and dissociation in sediments. Nat. Gas Geosci. 2018, 29, 1672–1678.
- Lim, D.; Ro, H.; Seo, Y.; Lee, J.Y.; Lee, J.; Kim, S.; Park, Y.; Lee, H. Electrical resistivity measurements of methane hydrate during N/CO gas exchange. Energy Fules 2016, 31, 708–713.
- Du Frane, W.L.; Stern, L.A.; Weitemeyer, K.A.; Constable, S.; Pinkston, J.C.; Roberts, J.J. Electrical properties of polycrystalline methane hydrate. Geophys. Res. Lett. 2011, 38.
- Chen, L.-T.; Li, N.; Sun, C.-Y.; Chen, G.-J.; Koh, C.A.; Sun, B.-J. Hydrate formation in sediments from free gas using a one-dimensional visual simulator. Fuel 2017, 197, 298–309.
- Liang, J.Q.; Zhang, G.X.; Lu, J.A.; Su, P.B.; Sha, Z.B.; Gong, Y.H.; Su, X. Accumulation characteristics and genetic models of natural gas hydrate reservoirs in the NE slope of the South China Sea. Nat. Gas Ind. 2016, 36, 152–162.
- Zhang, W.; Liang, J.Q.; Lu, J.A.; Wei, J.G.; Su, P.B.; Fang, Y.X.; Guo, Y.Q.; Yang, S.X.; Zhang, G.X. Accumulation features and mechanisms of high saturation natural gas hydrate in Shenhu area, norther South China Sea. Pet. Explor. Dev. 2017, 44, 670–680.
- Zhang, W.; Liang, J.Q.; He, J.X.; Cong, X.R.; Su, P.B.; Lin, L.; Liang, J. Differences in natural gas hydrate migration and accumulation between GMGS1 and GMGS3 drilling areas in the Shenhu area, northern South China Sea. Nat. Gas Ind. 2018, 38, 138–149.
- Wei, J.G.; Yang, S.X.; Liang, J.Q.; Lu, J.A.; Liu, S.X.; Zhang, W. Impact of seafloor drilling on methane seepage- enlightenments from natural gas hydrate drilling site GMGS2-16, northern South China Sea. Mar. Geol. Quat. Geol. 2018, 38, 63–70.
- Liu, J.; Zhang, J.Z.; Sun, Y.B.; Zhao, T.H. Gas hydrate reservoir parameter evaluation using logging data in the Shenhu area, South China Sea. Nat. Gas Geosci. 2017, 28, 164–172.
- Qin, X.-W.; Lu, J.-A.; Lu, H.-L.; Qiu, H.-J.; Liang, J.-Q.; Kang, D.-J.; Zhan, L.-S.; Lu, H.-F.; Kuang, Z.-G. Coexistence of natural gas hydrate, free gas and water in the reservoir system in the Shenhu Area, South China Sea. China Geol. 2020, 3, 210–220.
- Kang, D.; Lu, J.; Zhang, Z.; Liang, J.; Kuang, Z.; Lu, C.; Kou, B.; Lu, Q.; Wang, J. Fine-grained gas hydrate reservoir properties estimated from well logs and lab measurements at the Shenhu gas hydrate production test site, the northern slope of the South China sea. Mar. Pet. Geol. 2020, 122, 104676.
- Chen, M.; Liao, J.; Ouyang, M.; Sun, D.Q.; Qu, W.C.; Cai, H.M. Characteristics and exploration potential of gas hydrate reservoir in Songnan low Uplift, Qiongdongnan Basin. Well Logging Technol. 2021, 4, 290–296.
- Jing, J.E.; Zhao, Q.X.; Deng, M.; Luo, X.H.; Chen, K.; Wang, M.; Tu, G.H. A study on natural gas hydrates and their forming model using marine controlled source electromagnetic survey in the Qiongdongnan Basin. Chin. J. Geophys. 2018, 61, 4677–4689.
- Fujii, T.; Suzuki, K.; Takayama, T.; Tamaki, M.; Komatsu, Y.; Konno, Y.; Yoneda, J.; Yamamoto, K.; Nagao, J. Geological setting and characterization of a methane hydrate reservoir distributed at the first offshore production test site on the Daini-Atsumi Knoll in the eastern Nankai Trough, Japan. Mar. Pet. Geol. 2015, 66, 310–322.
- Noguchi, S.; Shimoda, N.; Takano, O.; Oikawa, N.; Inamori, T.; Saeki, T.; Fujii, T. 3-D internal architecture of methane hydrate-bearing turbidite channels in the eastern Nankai Trough, Japan. Mar. Pet. Geol. 2011, 28, 1817–1828.
- Takahashi, H.; Tsuji, Y. Multi-well exploration program in 2004 for natural hydrates in the Nankai-Trough offshore Japan. In Proceedings of the 2005 Offshore Technology Conference, Houston, TX, USA, 2–5 May 2005.
- Matsuzawa, M.; Umezu, S.; Yamamoto, K. Evaluation of experiment program 2004: Natural hydrate exploration campaign in the Nankai-Trough Offshore Japan. In Proceedings of the IADC/SPE Drilling Conference, Miami, FL, USA, 21–23 February 2006.
- Bahk, J.; Kim, D.; Chun, J. Gas hydrate occurrences and thier relation to host sediment properties: Results from Second Ulleung Basin Gas Hydrate Drilling Expedition, East Sea. Mar. Pet. Geol. 2013, 47, 21–29.
- Riedel, M.; Collett, T.S.; Kim, H.S.; Bahk, J.J.; Kim, J.H.; Ryu, B.J.; Kim, G.Y. Large-scale depositional characteristics of the Ulleung Basin and its impact on electrical resistivity and Archie-parameters for gas hydrate saturation estimates. Mar. Pet. Geol. 2013, 47, 222–235.
- Kim, G.Y.; Yi, B.Y.; Yoo, D.G.; Ryu, B.J.; Riedel, M. Evidence of gas hydrate from downhole logging data in the Ulleung Basin, East Sea. Mar. Pet. Geol. 2011, 28, 1979–1985.
- Kim, G.Y.; Yoo, D.G.; Lee, Y.J.; Kim, D.C. The relationship between silica diagenesis and physical properties in the East Japan Sea: ODP Legs 127/128. J. Asian Earth Sci. 2007, 30, 448–456.
- Kang, D.H.; Yoo, D.G.; Bahk, J.J.; Ryu, B.J.; Koo, N.H.; Kim, W.S.; Park, K.P. The occurrence patterns of gas hydrate in the Ulleung Basin, East Sea. J. Geol. Soc. Korea 2009, 45, 143–155.
- Shukla, K.M.; Kumar, P.; Yadav, U.S. Gas hydrate reservoir identification, delineation and characterization in the Krishna-Godavari Basin using subsurface geologic and geophysical data from the National Gas Hydrate Program 02. Mar. Pet. Geol. 2018, 108, 185–205.
- Kumar, P.; Collett, T.S.; Shukla, K.M.; Yadav, U.S.; Lall, M.V.; Vishwanath, K. India National gas hydrate program expedition 02: Operational and technical summary. Mar. Pet. Geol. 2019, 108, 3–38.
- Waite, W.; Jang, J.; Collett, T.; Kumar, P. Downhole physical property-based description of a gas hydrate petroleum system in NGHP-02 Area C: A channel, levee, fan complex in the Krishna-Godavari Basin offshore eastern India. Mar. Pet. Geol. 2018, 108, 272–295.
- Hsiung, K.-H.; Saito, S.; Kanamatsu, T.; Sanada, Y.; Yamada, Y. Regional stratigraphic framework and gas hydrate occurrence offshore eastern India: Core-log-seismic integration of National Gas Hydrate Program Expedition 02 (NGHP-02) Area-B drill sites. Mar. Pet. Geol. 2019, 108, 206–215.
- Borowski, W.S. A review of methane and gas hydrates in the dynamic, stratified system of the Blake Ridge region, offshore southeastern North America. Chem. Geol. 2004, 205, 311–346.
- Collett, T.S.; Ladd, J. Detection of gas hydrate with downhole logs and assessment of gas hydrate concentrations (saturations) and gas volumes on the Blake Ridge with electrical resistivity. In Proceedings of the Ocean Drilling Program, Scientific Results; Paull, C.K., Matsumoto, R., Eds.; Ocean Drilling Program: College Station, TX, USA, 2000; pp. 179–191.
- Francisca, F.M.; Yun, T.-S.; Ruppel, C.; Santamarina, J. Geophysical and geotechnical properties of near-seafloor sediments in the northern Gulf of Mexico gas hydrate province. Earth Planet. Sci. Lett. 2005, 237, 924–939.
- Collett, T.S.; Lee, M.W.; Zyrianova, M.V.; Mrozewski, S.A.; Guerin, G.; Cook, A.E.; Goldberg, D.S. Gulf of Mexico Gas Hydrate Joint Industry Project Leg II logging-while-drilling data acquisition and analysis. Mar. Pet. Geol. 2012, 34, 41–61.
- Majumdar, U.; Cook, A.E.; Scharenberg, M.; Burchwell, A.; Ismail, S.; Frye, M.; Shedd, W. Semi-quantitative gas hydrate assessment from petroleum industry well logs in the northern Gulf of Mexico. Mar. Pet. Geol. 2017, 85, 233–241.
- Majumdar, U.; Cook, A.E.; Sheed, W.; Frye, M. The connection between natural gas hydrate and bottom-simulating reflectors. Geophys. Res. Lett. 2016, 43, 7044–7051.
- Hyndman, R.D.; Spence, G.D.; Chapman, N.R.; Riedel, M.; Edwards, R.N. Geophysical studies of marine gas hydrate in Northern Cascadia. In Natural Gas Hydrates: Occurrence, Distribution, and Detection; American Geophysical Union: Washington, DC, USA, 2001.
- Pohlman, J.W.; Canuel, E.A.; Chapman, N.R.; Spence, G.D.; Whiticar, M.J.; Coffin, R.B. The origin of thermogenic gas hydrate s on the northern Cascadia Margin as inferred from isotopic (13C/12C and D/H) and molecular composition of hydrate and vent gas. Org. Geochem. 2005, 36, 703–716.
- Chen, M.A.P.; Riedel, M.; Spence, G.D.; Hyndman, R.D. Data report: A downhole electrical resistivity study of northern Cascadia marine gas hydrate. In Proceedings of the Integrated Ocean Drilling Program; Texas A & M University: College Station, TX, USA, 2008.
- Riedel, M.; Spence, G.D.; Chapman, N.R.; Hyndman, R.D. Deep-sea gas hydrates on the northern Cascadia margin. In The Leading Edge; Society of Exploration Geophysicists: Houston, TX, USA, 2012; Volume 20.
This entry is offline, you can click here to edit this entry!
