The definition of Carbon Emission Intensity (CEI) according to the INDCs is "the amount of carbon dioxide emissions per unit of GDP". As defined, CEI is an emission reduction indicator that takes into account environmental protection and economic development, which has important reference significance for the emission reduction work of developing countries.
- climate change
- China
- spatial panel data
- Influencing factors
- Environmental policy
- carbon emission intensity
- spatial econometrics
- regional cooperation
1. Introduction
With worldwide energy consumption in a constant increase, large amounts of Greenhouse Gasses (GHG), especially CO2, are being emitted directly into the atmosphere. This has triggered a series of global climate change issues—such as the Greenhouse Effect—and is posing a considerable threat to human survival and development. In order to address these challenges, through the United Nations Framework Convention on Climate Change (UNFCCC) in 2010, the United Nations advised all parties to make urgent efforts to significantly reduce their global carbon emissions [1]. Against such a background, countries all over the world are facing huge pressure to reduce emissions, especially developing countries, which need to balance the dual needs of environmental protection and economic growth.
As the largest developing country, in the past few decades, China’s rapid economic development has caused steep increases in CO2 emissions, which mainly stem from fossil fuel combustion [2]. In 2017, CO2 emissions from fossil fuel combustion in China reached up to 9.26 Gt, accounting for 28.19% of the global total emissions (IEA Statistics, 2018, IEA Energy Atlas, http://energyatlas.iea.org/#!/tellmap/1378539487), which represents an over-fourfold increase from 2.12 Gt in 1990. As the country with the largest CO2 emissions in the world, China is facing tremendous pressure to reduce its emissions. In its Intended Nationality Determined Contributions (INDC) submitted to the United Nations Framework Convention on Climate Change (UNFCCC) on 30th June 2015, China promised that CO2 emissions per unit of GDP (CO2/GDP) will be reduced by 60–65% by 2030, on a 2005 basis [3]. In order to achieve national Carbon Emission Intensity (CEI) reduction targets, it is crucial to delve into the influential factors and to clarify the driving mechanisms of CEI.
Since 2005, China has been committed to the simultaneous effort of economic development and environmental protection. Carbon intensity was reduced from 2.88 tons/10,000 yuan in 2005 to 1.11 tons/10,000 yuan in 2017. However, uneven regional development remains an urgent development problem. As shown in Figure 1, the level of China’s economic development has been significantly differentiated between regions, and the regional distribution of CEI has been characterized as high in the north and low in the south. The gap between the maximum value of 13.254 tons/10,000 yuan and the minimum value of 0.513 tons/10,000 yuan is quite large. The huge differences urgently need to be improved through the coordinated regional development route in order to achieve overall low-carbon development. In 2019, Chinese President Xi Jinping proposed to further promote the regional coordinated development strategy [4], which provides good strategic guidance and policy support for regionally-coordinated emission reduction. Therefore, studying the temporal and spatial characteristics of carbon intensity in China’s provinces, and the driving mechanism under the spatial effect, is of great significance for regional low-carbon cooperation in China. In addition, research on carbon intensity reduction from a provincial perspective in China can also provide a reference for emission reduction research in other countries or regions, especially in terms of regional cooperation in emission reduction.
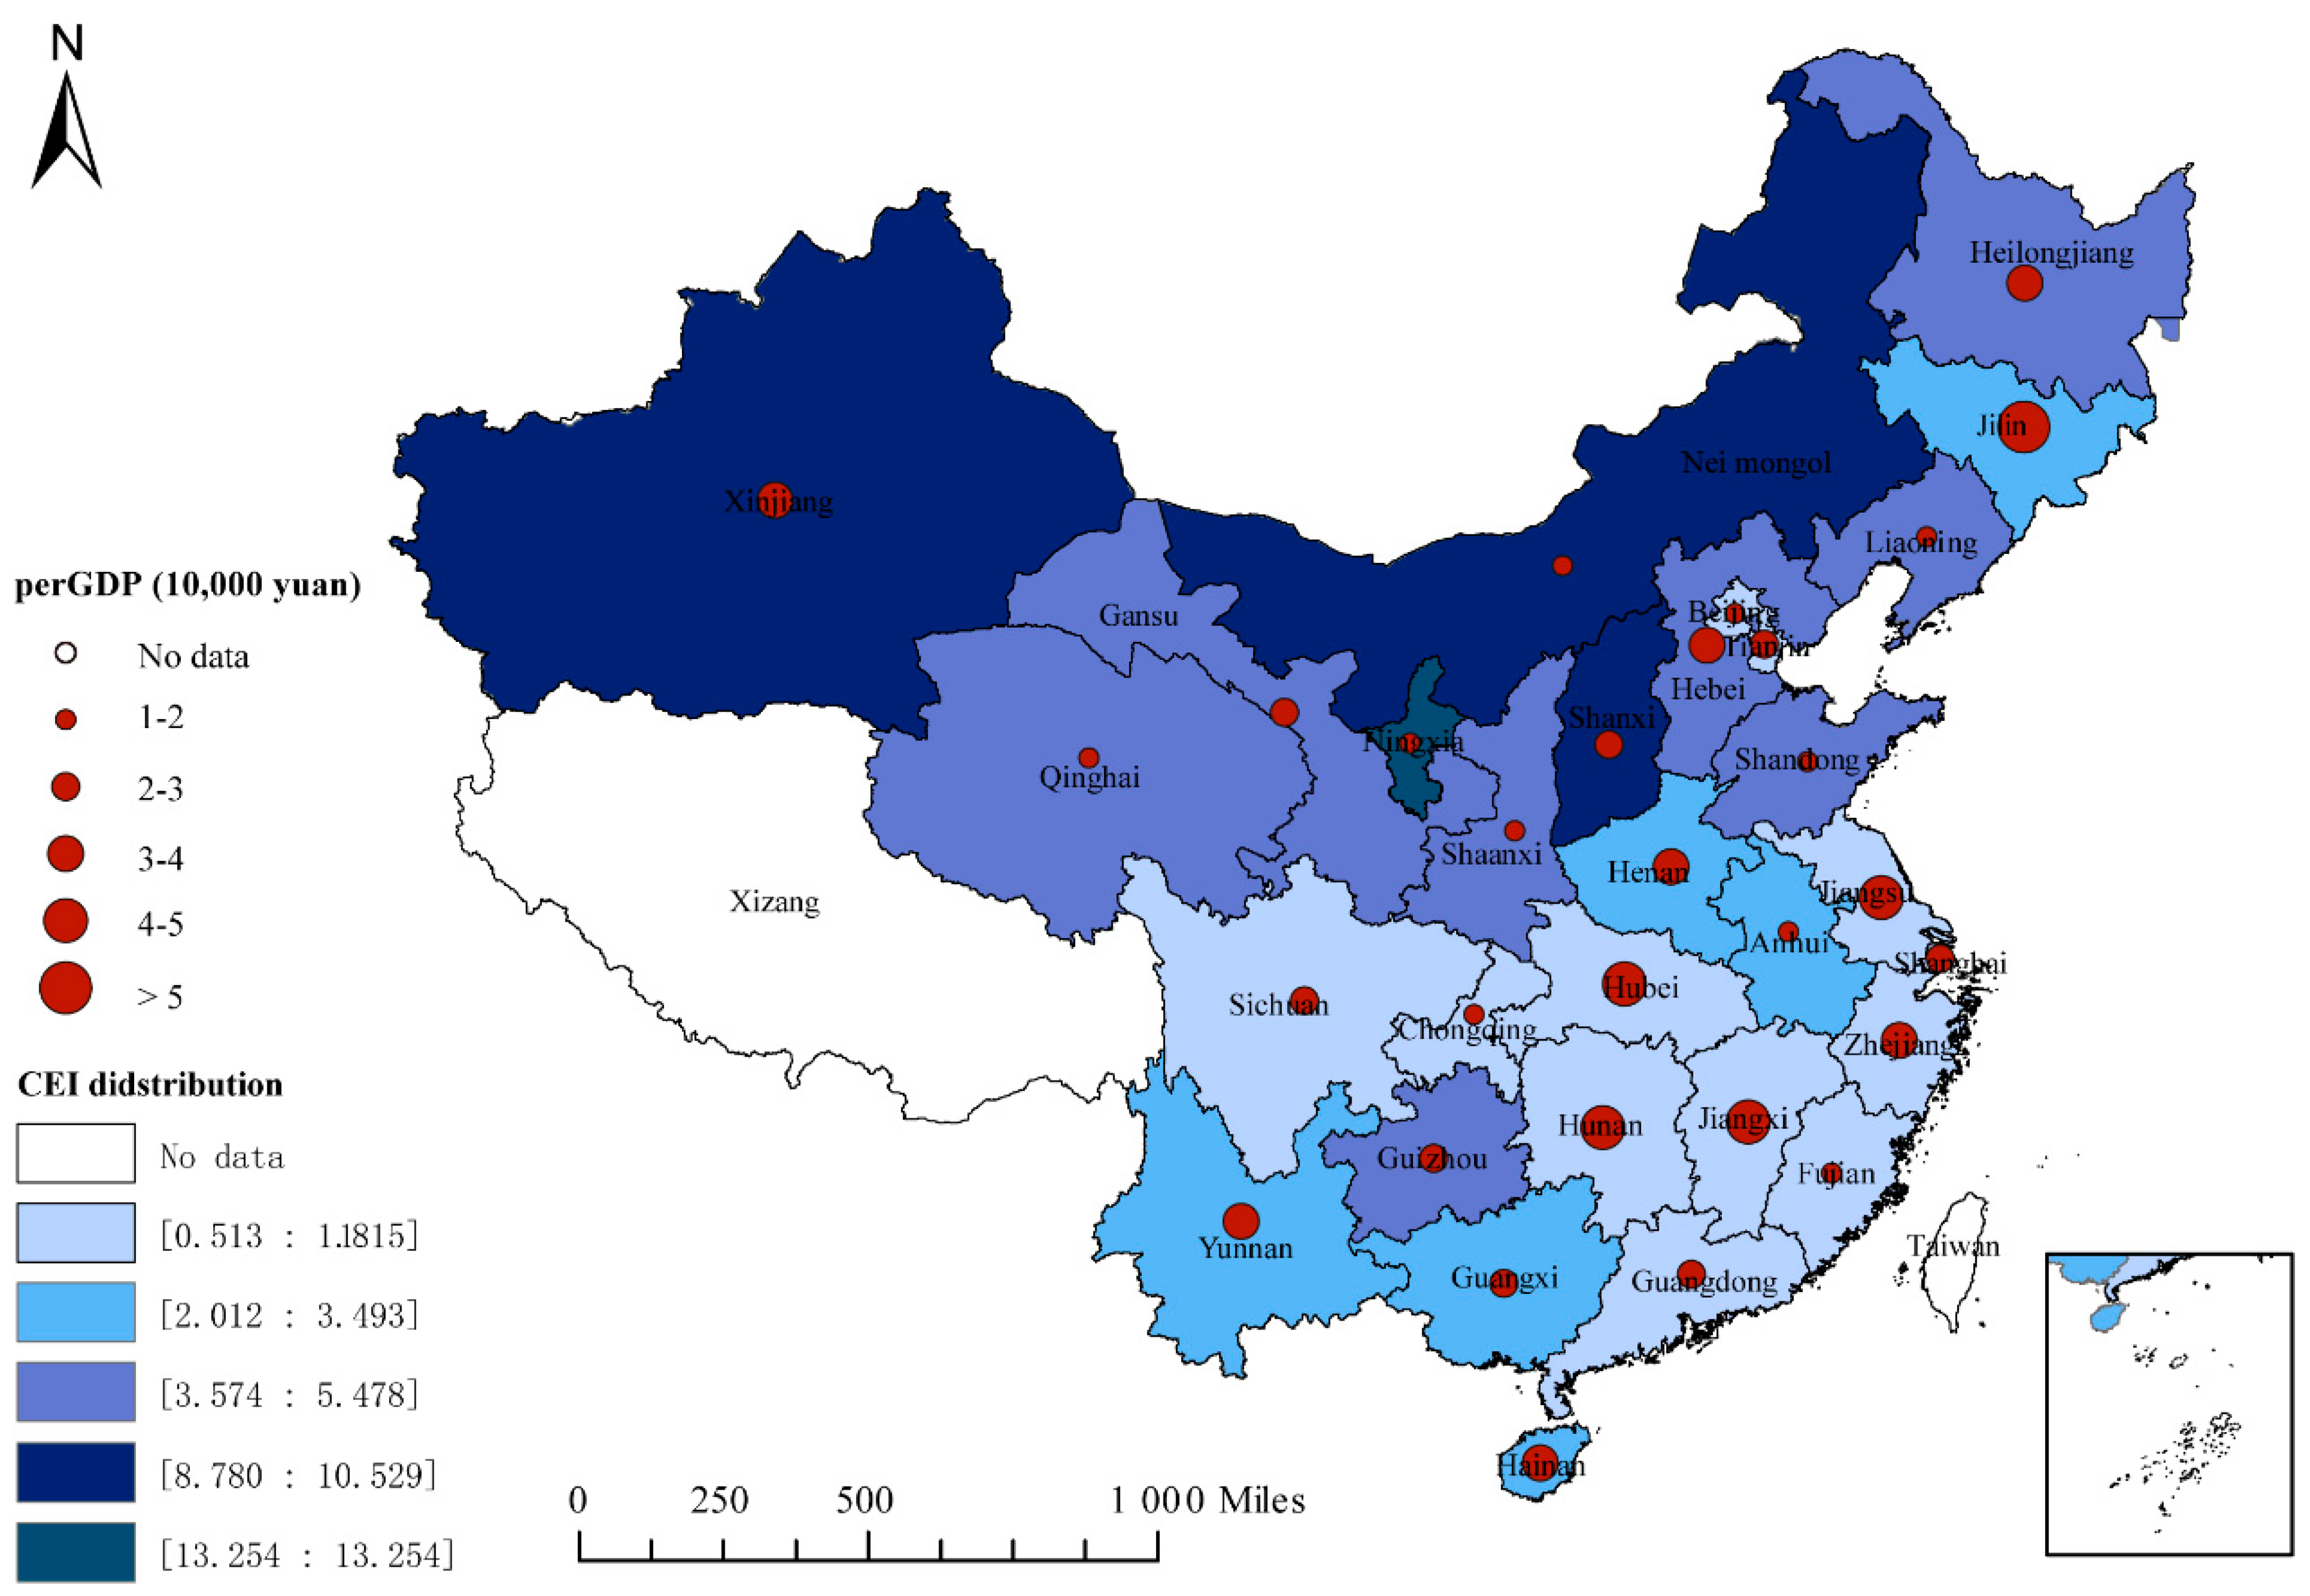
Figure 1. Space distribution of China’s provincial CEI and per capita GDP in 2017.
China has a vast territory, a large population, complex national conditions, and great differences in its economy, industrial structure, energy consumption, and humanities and social sciences environment around its regions [5]. As a result, the complex CO2 emission situation leads to the great difficulty of CO2 mitigation. The difficulty of carbon emission reduction mainly comes from the spatial effects—such as spatial spillover and spatial heterogeneity—around provinces, caused by the negative externalities of CO2 emissions [6], leading to the complexity of its driving mechanism. In order to clarify the CEI driving mechanism, traditional methods can provide only limited help, because they neglect the spatial interaction, which may lead to inaccurate estimate results. This kind of spatial interaction can be solved by spatial econometrics; that is, by introducing spatial weight variables to handle the spatial effects in regression.
2. Research on Carbon Emission Intensity
At present, there is a large amount papers on CEI regarding carbon reduction in different countries, which mainly focus on spatial and temporal characteristics, influencing factors, and prediction research, etc. Specifically, the research on the spatial and temporal characteristics of CEI mainly focuses on spatial difference [6,7], the evolution of spatiotemporal patterns [8,9], and spatiotemporal heterogeneity [10,11], etc. The research on predictions regarding CEI focuses on the construction of predictive models [12,13], the prediction of CEI reduction target achievements [14,15,16], and scenario evolution analysis [17,18]. Based on the researches above, more and more studies have focused on the factors affecting carbon intensity, and have committed to accurately identifying the driving mechanism of carbon intensity, improving emission reduction policies, and realizing low-carbon development.
2.1. Influencing Factors
The research on influencing factors has mostly focused on energy-related (ENR) and economy-related (ECO) factors, as economic growth, energy consumption and carbon emission are causal to each other, and there is a direct and inevitable connection [19]. Fernandoa and Hor [20] analyzed the impact of energy management on carbon emissions in Malaysian manufacturing based on PLS-SEM (Partial Least Squares-Structural Equation Modeling) software, and found that energy audits and energy efficiency are the key factors for the mitigation of carbon emissions. Vujović et al. [21] used the neuro-fuzzy method to explore the relationship between energy, carbon intensity and economic growth. It was found that alternative energy has the greatest impact on carbon emission intensity. Some papers have also conducted research on the impact of urbanization (URB) on carbon emissions, as urbanization has a large demand for infrastructure construction, which has caused a lot of carbon emissions [22]. Liu and Liu [5] researched the spatial spillover effects of urbanization on carbon emissions in China by dividing China into Eastern, Middle and Western regions, in order to find the regional disparity. The results show that, as urbanization improves, its influence on local carbon emissions changes from positive to negative, and then the negative influence becomes weaker. With the development of economic globalization, factors related to international trade (INT), including import and export trade, foreign direct investment, etc., have become more and more important to the carbon emissions of countries and regions [23]. Pan et al. [24] studied the carbon intensity influencing factors of 34 OECD (Organization for Economic Co-operation and Development) countries based on genetic programming (GP) and symbolic regression methods (SRM), creatively using foreign direct investment as an influencing factor. In addition, technological innovation (TEI) is one of the main measures that can be used to reduce carbon emissions without reducing economic growth performance [25]. Nguyen et al. [26] explored the role of information and communication technologies and innovation in driving carbon emissions in 13 selected G-20 countries, based on quantile panel regression (QPR). Besides this, the impact of carbon emission trading (CET) [27,28] and power (POW) factors [29,30] on carbon intensity has been studied in recent years. The list of the research of related papers is shown in Table 1. It can be seen that most studies only consider factors of one or two aspects, and few consider all of the aspects of factors as a system. This has led to relatively one-sided conclusions and limited reference for the overall planning and reduction of emissions. With respect to the research dimensions, most studies have only carried out research on the influential factors of CEI from a temporal dimension, and relatively few studies come from a comprehensively spatial-temporal dimension using space panel data.
2.2. Driving mechanism
The methods for the analysis of the driving mechanism of CEI in existing research are mainly based on the following three theories: decomposition analysis, machine learning, and spatial econometrics. Decomposition analysis is one of the classic theories that addresses influencing factors. It has been widely applied to the exploration of the factors that influence CO2 and other polluting gas emissions since the 1990s, and continues to be examined with respect to influential factors regarding CEI [35]. It can be divided into the two main categories of index decomposition analysis (IDA) [23,27,29,36,37] and structural decomposition analysis (SDA) [38,39,40,41]. The advent of Machine Learning (ML) technology has greatly improved research on influencing factors, it can solve some of the problems which exist in traditional research, such as the selection of indicators and the limitation of large data processing. Therefore, it has been widely used in various research fields, including carbon intensity, in recent years [12,24]. Although the above two mainstream methods have their own advantages in the research of carbon intensity factors, none of them can deal with complex spatial effects in theory, leading to a lack of research on the estimation of the influencing factors considering spatial effects.
Spatial econometric analysis, as a branch of econometrics, can handle spatial effects in regression models of panel data, such as spatial interaction and spatial autocorrelation. Since Anselin [42] systematically structured the spatial econometric method, it has been widely used in economic policy-related research. With greater emphasis being placed on CO2 emissions-related research over the last few years, spatial econometric analysis has begun to be applied to the research on CEI. However, due to its relatively late appearance, few related studies are currently available. Zhang et al. [34] studied the effect of urbanization on China’s CEI using the spatial Durbin mode, which is based on spatial econometric analysis, and comprehensively estimated the impact of population and land urbanization on carbon emissions, with consideration of the spatial effects. It has been proved that spatial econometric analysis can restore the actual spatial effects well [5,34], but there are few studies on the application of this method to carbon intensity, and there is a lack of the comprehensive consideration of various factors on the driving mechanism of carbon intensity.
3. Main results and analysis
3.1 Spatial Autocorrelation Analysis
In order to verify the spatial autocorrelation of the CEI among the provinces, a global spatial autocorrelation (GSA) test was performed using the Global Moran’s I. The values of the Moran’s I from 2005 to 2017 are all positive and greater than 0.25, and all of the, passed the significance test at the 1% level or more, except for 2007, in which the Moran’s I was significant at the level of 5%. This indicates that the CEI among provinces in China had obvious positive spatial autocorrelation characteristics; that is, when the CEI is higher than average in a province, it is often higher than average in the regions around it, and vice versa. In addition, during the research period, the Moran’s I values showed an overall upward trend, meaning that the spatial autocorrelation of CEI became stronger and stronger.
The GSA test can only prove that there is a spatial autocorrelation in the CEI among the provinces. The specific spatial autocorrelation of each province needs to be further tested using the local space autocorrelation (LSA) test. In order to express the result more clearly, the spatial distribution characteristics of the CEI in the provinces are divided into four categories: High–High, High–Low, Low–High, and Low–Low. The specific meanings are as follows: High–High indicates that the CEI of a province, as well as its neighboring provinces, are higher than the average level, Low–Low is the opposite; High–Low indicates that the CEI of a province is higher than the average level, while its neighboring provinces are lower than average, and Low–High is the opposite. High–High and Low–Low reflect the spatial aggregation effect; High–Low and Low–High reflect the spatial heterogeneity effect. The results of the LSA test are revealed by the Moran Scatter Plot (MSP) and the Local Indication of the Spatial Association (LISA) cluster map, respectively.
Figure 2 shows the MSP in 2005, 2011 and 2017, which intuitively indicates the local spatial autocorrelation and the dynamic trends of the provincial CEI in China.
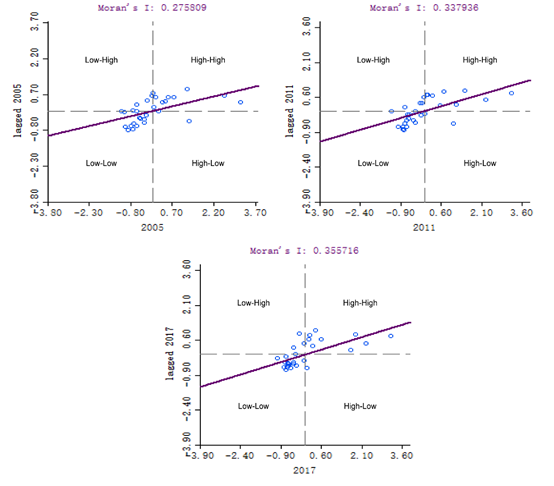
Figure 2. MSP for the Chinese provincial carbon emission intensity.
In order to show the local spatial correlation of specific provinces more intuitively, Local Indication of Spatial Association (LISA) agglomeration maps of China’s provincial CEI in different years at a 5% significance level were drawn (Figure 3). According to the maps, High–High provinces are mainly distributed in northern inland areas, such as Inner Mongolia and Gansu, while Low–Low provinces are mainly distributed in southeastern coastal areas, such as Zhejiang and Fujian. This distribution is mainly caused by the uneven distribution of various resources. The inland areas of northern China are rich in mineral resources, but are relatively undeveloped in their technology and economy. Their industrial structure is dominated by secondary industry, and their tertiary industry is mainly driven by transportation, so there is a strong dependence on fossil energy—such as mineral resources—in these provinces. The provinces located in the southeast coastal area are relatively developed in their economies, and their industrial structure is dominated by tertiary industry, which is mainly driven by the financial industry, the service industry, and high-tech industries, so these areas are less dependent on energy.
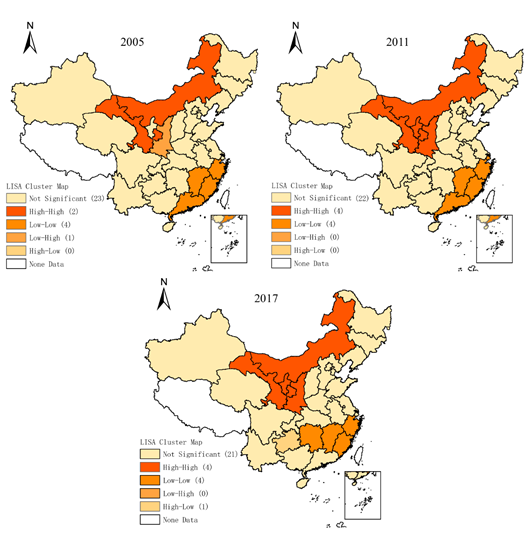
Figure 3. LISA cluster map for the Chinese provincial carbon emission intensity.
In this part, the results of the global and local spatial autocorrelation test proved that there is a significant spatial autocorrelation in China’s provincial carbon emission intensity (CEI), and the degree of the spatial correlation shows an upward trend with time, which puts forward an urgent need for the exploration on the driving mechanism of CEI under the space effect, and for the formulation of emission reduction measures from the perspective of regional coordination.
3.2 Regional Coordinated Emission Mitigation Mechanism
In order to explore regionally-cooperated emission mitigation mechanisms, it is necessary to clarify the spatial spillover effects of the factors that influence CEI, which is reflected by the indirect effect of changes in the local influencing factors on the CEI of the adjacent areas. Figure 4 shows the direct, indirect and total effects of various influential factors on the CEI obtained from the SDPM based on spatial fixed effects.
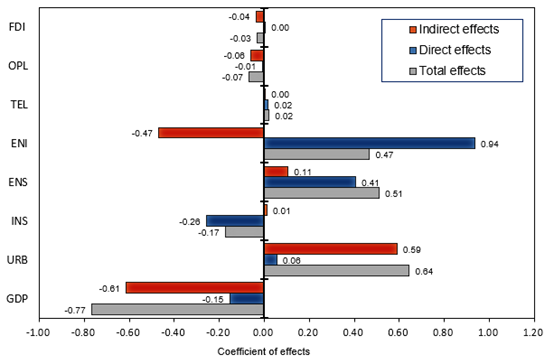
Figure 4. The direct, indirect, and total effects of the influential factors.
It can be seen from Figure 4 that the direct and indirect effects of GDP, URB, ENS, and TEL are in the same direction, while the direct and indirect effects of INS, ENI, OPL, and FDI are reversed. Among them, the total effects of GDP, INS, OPL, and FDI on CEI are negative in descending order of the coefficient, while the total effects of URB, ENS, ENI and TEL are positive in descending order of the coefficient. Besides this, according to the significance test results of the regression coefficients, with the exception of INS and TEL, there are significant indirect effects with respect to the other six influencing factors, reflecting the spatial spillover effects. To sum up, GDP, URB, ENS and ENI have relatively stronger effects on CEI, with a significant space spillover effect. Therefore, further analysis of these four influencing factors should be carried out.
4. Conclusions and Policy Implications
4.1. Main conclusions
(a) China’s provincial carbon emission intensity has significant spatial autocorrelation characteristics, and it shows an increasing trend with time;
(b) economic development has a negative correlation with carbon intensity, and the space spillover effect is significant, which is a great driving force for regional carbon intensity reduction;
(c) energy intensity has a positive correlation with local carbon intensity, but the spatial spillover effect is negative. When reducing carbon intensity by adjusting energy intensity, the impact on surrounding areas should be fully considered;
(d) The energy structure and urbanization have a relatively important effect on the intensity of carbon emissions, and have significant space spillover effects.
4.2. Policy implications
First, Low-CEI regions, such as Beijing, Tianjin and Zhejiang, can use their advantages with respect to economic development in order to drive the industrial transition of the surrounding regions and the other regions of the nation with high-CEI. They could fully mobilize their own technology and talent advantages to provide technical support for the development of clean energy and waste gas treatment in large resource-rich provinces, such as Xinjiang, Inner Mongolia, and Heilongjiang. Furthermore, with the state’s strategy of encouraging regional cooperation, regional resources can be shared, such as educational, cultural, tourism, and transportation resources.
Next, the CO2 emission quotas and emission reduction responsibilities allocated from a whole region would be more sensible for Low–High agglomeration regions, such as the Beijing–Tianjin–Hebei region. For regions that lie close to provinces with large resource reserves, their high CEI levels are often the result of the ease and convenience of procurement, and low transportation costs. These regions, such as Shaanxi and Hebei, bordering Shanxi; Qinghai and Gansu, bordering Xinjiang; and regions bordering Inner Mongolia, should focus on reducing their own demands for energy consumption by adjusting their industrial structures and transforming their underdeveloped production capacity. Simultaneously, other low-CEI regions that are not adjacent to high-carbon provinces with large resource reserves should assume more carbon emission reduction responsibilities as compensation, and should provide some support for the high emissions in high-carbon regions caused by their energy supply. In addition, high-CEI regions should work hard to advance the process of urbanization in a scientific and reasonable way, increase their talent introduction and research funding in order to promote the development of tertiary industry, and attract foreign direct investment, especially in energy production-related industries, which can bring advanced technologies, management models and cleaner production models from developed countries into the region.
Finally, for energy-dependent high-CEI regions—such as Shanxi, Shaanxi, Inner Mongolia, Ningxia, Xinjiang, Heilongjiang and Jilin—the energy intensity and coal consumption ratio are much higher, and the development of the whole nation depends on the resource endowment and energy industry in these regions. Based on these conditions, it is important to replace traditional fossil energy sources, such as coal, with clean energy sources, such as wind and nuclear energy. It is very important to develop solutions for the practical technical problems and policy issues that stand in the way of acceptance, such as the problem of grid connection and electricity pricing in wind power generation technology.
This entry is adapted from the peer-reviewed paper 10.3390/su12198097