Your browser does not fully support modern features. Please upgrade for a smoother experience.
Please note this is an old version of this entry, which may differ significantly from the current revision.
Subjects:
Health Care Sciences & Services
A central issue in modern cities is providing inclusive transportation services for people with reduced mobility. In particular, Barcelona is offering a public door-to-door pickup transportation service complementary to the adapted regular public transport.
- transportation
- reduced mobility
- disabled population
- descriptive analytics
1. Introduction
Globalisation has led to the development of modern cities, leading to over-populated urban areas. About two centuries ago, only 3% of the global population lived in cities. This number had increased to 54% by 2014. It is further predicted that by 2050, more than two-thirds of the worldwide population will be living in cities and urban areas[1], showing an exodus from rural life. This increase in the urban population implies changes in the socioeconomic life, cultural activities, architecture and health of the urban settlers, thereby inducing the need to adapt to the new challenges in planning city services. Importantly, people with reduced mobility should be included in the policies and decision making to create and develop these new urban cities.
For example, the city of Barcelona (Spain) comprised about 1.66 million inhabitants in 2020 [2] with a total area of 101.35 km2. During the last decades, Barcelona has undergone significant change due to urban planning transforming the city into a leading twenty-first-century metropolis in Europe and making it a pioneering smart city [3]. Presently, it is one of the most densely populated cities in Europe, with a high life expectancy, standing out as a city with a substantial older demographic population. In 2020, the over-65s represented 21.1% of the population of Barcelona, which is expected to rise to 35.7% by 2050. Currently, the city has 155,000 people with a legally recognized disability, representing 9% of the population of Barcelona.
Barcelona strives to improve the quality of life of its residents, especially understanding and meeting the needs of people with reduced mobility. The elderly form a part of the low-mobility population since physiological aging leads to a reduction in motor abilities, therefore causing movement difficulties [4]. To make a city more enjoyable and inclusive for Persons with Reduced Mobility (PRM), several concerns have been raised by the World Health Organization [5]. These concerns for PRM include the needs for housing, outdoor spaces, buildings, transportation, social participation, respect, social inclusion, civic participation, employment, communication, information, community support and health services. Among all the needs of these people, transportation is essential to fully participate in the economic and social life of the city[6].
One of the main goals of the Barcelona City Council and the Barcelona Metropolitan Area (AMB) is to promote mobility for all citizens, including the PRM. In this regard, a special transportation service is offered for this population, called the Special Municipal Transport Service (SMTS). The SMTS is a public door-to-door pickup transportation service offered to people with reduced mobility, which provides nonadapted and adapted taxis accessible for people with wheelchairs.
The SMTS service is offered on a first-come, first-served basis and can be booked 48 h in advance. The cost of each trip using the SMTS is priced as a single trip metro card for the user, while the institutions provide for any additional costs of service. Consequently, as the institutions have a fixed amount of money for this service, there is a financial limitation to the number of trips offered each day. One of the important challenges is that demand outnumbers the supply for the service, thereby making it, impossible to furnish all the trips demanded.
The mismatch between the demand and supply of the SMTS service therefore provides the rationale for further research to understand the nature of demand and devise ways to meet it. The research questions that this study wants to address are: How does the SMTS service work? What is the profile of the SMTS service end-users? Which factors could contribute to a better SMTS service? What kinds of trips are the most frequent? Would it be possible to have users share transports?
Special Municipal Transport Service for Persons with Reduced Mobility
Barcelona has a diverse public transport system composed of the subway, urban and intercity buses, trains, tramways, a funicular cable tramway and taxi services. Despite several modes of transportation, many stations are not easily accessible for PRM. For example, the subway system is the primary public transportation system in Barcelona. It has 8 lines and 161 stations, but 14 of them are not accessible for PRM [7]. It shows the gaps in the public transportation system, thereby impacting the mobility for PRM.
In the municipality of Barcelona, the SMTS was started in 1992 and is jointly funded and operated by the Institut Municipal de Persones amb Discapacitat (IMPD)[8], an autonomous body of the Barcelona City Council, and the AMB. It is addressed to PRM living in Barcelona by offering door-to-door service and providing them autonomy and better mobility. The SMTS is the only public door-to-door transportation service. Other private companies offer some adapted vehicles for door-to-door transportation but with a more elevated price. To use the SMTS, people must possess a white card, an accreditation processed at the Municipal Offices of Citizen Attention, which officially recognises their reduced mobility. The service is available to PRM every day of the year. The SMTS provides an integrated fleet of nonadapted and adapted taxis. Adapted taxis are the ones that have wheelchair accessibility. The popularity of the system is signified by the fact that in 2019 more than 150,000 trips were performed by the SMTS. However, in 2020, the number of trips fell to 99,215, owing to the restricted movements posed by the COVID-19 pandemic. During these two years, a total of 6591 different people used this service.
The SMTS is a complimentary public transport service for PRM. However, the cost of the service is priced as regular public transport and paid for by the institutions providing the service. This service is capped with a financial limit by the institution supporting this initiative [9]. To provide the service within the annual limit, the SMTS restricts the number of daily trips to 550. It is estimated that the daily trips available are lower than the requests made by the users, leading to a large number of requests being denied. This system is available from Sunday to Thursday from 7 a.m. to 12 p.m. On Fridays, Saturdays, Sundays and on the eve of public holidays it is available from 7 a.m. to 2 a.m.[10].
The user request process for the SMTS service is illustrated in Figure 1. As given in the figure, the service request is initiated by the user by contacting the Call Centre or by filling in the form on the website at least 48 h before the trip [11]. The request is registered and processed from the Call Centre. The system thereafter evaluates the daily journey limits, available transport and disability profile of the person, and an adapted or nonadapted taxi is assigned to the accepted applications. Once all available trips are assigned, no more trips can be provided.
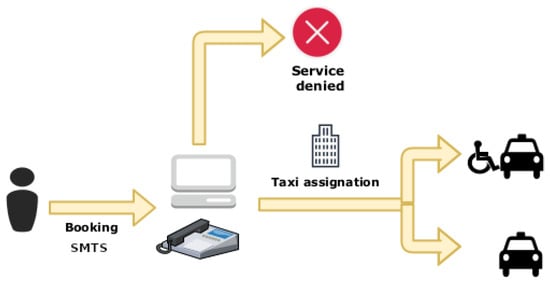
Figure 1. Workflow of the SMTS user request process.
The eligible SMTS users are legally recognised to be disabled and, in particular, have reduced mobility. In Spain, disability recognition is conducted using a category system of 0 to 5, ranging from 0% to 100% disabled. To be legally recognised as a person with a disability, one needs to have a minimum of a 33% degree of disability and a minimum of 75% degree of disability to be classified as extreme disabled in the fifth category [12].
2. Age Range Comparison between PRM and SMTS Users
The age ranges of the group of PRM are compared with those of the SMTS users. Specific differences between them are assessed regarding age to determine the differences between potential candidates who could use the service and those who use it.
As observed in Figure 2, the age distribution of SMTS users is given in orange, and the PRM in Barcelona is stated in blue. On the Y-axis, the scale of the total number of SMTS users is displayed on the left side, while on the right side, the total number of PRM users is given. The X-axis shows the different age groups.
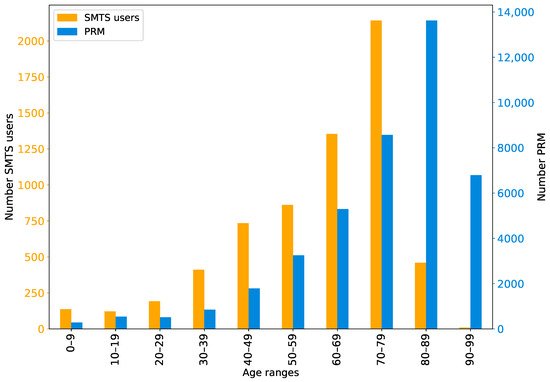
Figure 2. Age distribution and comparison between SMTS users and PRM. Orange bars (primary axis) represent SMTS data, while blue bars (secondary axis) represent PRM data.
It can be observed from the figure that the SMTS users are younger compared to the PRM (signified by the difference in orange and blue bars). As the X-axis represents the age of the individuals in increasing order, it indicates that the overall profile of the SMTS users has a lower age range than that of PRM. It is important to note that the mean age of SMTS users is 59.7 years, while the mean age of PRM is 74.5 years. The figure also shows that people over 90 years of age do not use the SMTS, while 16% of PRM belong to this age group. In addition, half of the PRM living in Barcelona are over 80 years old, while only 8% of SMTS users are over this age.
In summary, it can be found that users who use the SMTS service are on average younger than the potential users. One reason for the lower number of aged people using the SMTS is that these people tend to travel less and take shorter trips after retirement [13]. Consequently, older people tend to make fewer trips than younger people and may change their transport mode. Another reason could be that because older people have a shorter attention span [14], they have more problems entering the process that needs to be performed to receive this service (i.e., calling at a specific time to make a reservation so that rides are still available, waiting until the call centre is not busy and answering the call). For this reason, we believe that the reservation system should be more inclusive for older people. A third reason could be that older people do not want to go through the formalities to become a SMTS user. It should be noted that in order to use the SMTS, people must have a white card, an accreditation that officially recognises SMTS users and must be obtained through a formal process.
3. Neighbourhood Differences between PRM and SMTS Users
This section first analyses the residence of PRM and SMTS users, followed by a comparison between them. The 73 neighbourhoods of Barcelona were considered by measuring the density of PRM and SMTS users, concerning the region’s total population expressed per 1000 inhabitants. The results are presented in Figure 3a,b through a Choropleth map. Before explaining each Figure in detail, it should be noted that the neighbourhood of La Marina del Prat Vermell (located at the bottom left of the map) has been considered a particular case due to its idiosyncrasy. That is the reason why it has not been coloured on the map. It is a small neighbourhood with a small population where residential centres and housing have been given to people with disabilities. Therefore, it has a much higher number of PRM and SMTS users. The following figures will discuss the possible factors that could influence the results, although we have not found a direct correlation between them. The factors are neighbourhood income and the number of available public transport stations (considering the underground, the Ferrocarrils de la Generalitat de Catalunya (FGC) and the tram) per neighbourhood. We should bear in mind that other factors could contribute to the results.

Figure 3. (a) Density of the PRM residing in each neighbourhood of the city of Barcelona (per 1000 inhabitants); (b) Density of the of SMTS users residing in each neighbourhood of the city of Barcelona.
Figure 3a shows the density of PRM (per 1000 habitants) residing in the neighbourhoods of Barcelona. It can be found that a higher concentration of PRM lives in the district of Torre Baró (76 inhabitants), followed by Montbau (54) and el Barri Gòtic (47). Assessing the income profile of the neighbourhoods, they are in the 70th, 42nd and 18th position, respectively, on the list.
In Figure 3b, we can see the number of people using the SMTS (per 1000 inhabitants) in all neighbourhoods. Montbau, which is a neighbourhood located on the northeast side of Barcelona, presents the highest value of SMTS users (9.6), followed by Can Peguera (9), la Verneda i la Pau (6.8) and, Sant Martí de Provençals (6.3). It is important to mention that these neighbourhoods are near the bottom of the list regarding average income of the people living there (42nd, 65th, 59th and 54th position, respectively). Therefore, income could be an important factor in SMTS usage in low-income neighbourhoods, since people with lower incomes could take advantage of this kind of service. On the other hand, the public transport sections—taking into account the underground, the FGC and the tram—that are available in these neighbourhoods drastically change between these four top SMTS users’ neighbourhoods. Montbau is in the 25th position, Can Peguera has no stations, la Verneda i la Pau is in the 48th position, and Sant Martí de Provençals is in the 54th. Although these are not the neighbourhoods with the best public transport, in general, they are not the worst. On the other hand, the neighbourhoods that are using the SMTS less are el Barri Gòtic (1.1 inhabitants), les Tres Torres (1.6) and Vallvidrera, el Tibidabo i les Planes (1.7). These neighbourhoods are listed as high-income (18th, 2nd and 10th position, respectively). Therefore, we can conclude that, in general, the neighbourhoods that make more use of the service have a lower income than the ones that use it the least.
To compare the SMTS users and the PRM, the ratio between them was calculated by dividing the number of people using the SMTS by the PRM in each neighbourhood. This approach allows us to see the percentage of PRM that use the SMTS, as shown in Figure 4. In general, it can be observed that the neighbourhoods situated on the east side of Barcelona are the ones who are using the service more. In general, these neighbourhoods are the ones with lower-middle-income families. The ones located on the northwest side of Barcelona are the ones that are using the SMTS in a lower percentage of the cases. These neighbourhoods are situated in areas with higher incomes. These results show that income may be a relevant factor in explaining the use of the SMTS, while we have not found any significant associations with public transport.
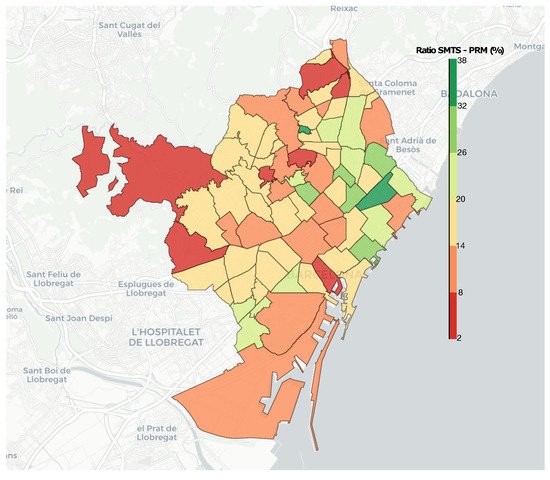
Figure 4. Ratio of PRM using the SMTS. The number indicates the percentage of PRM who use the SMTS in each neighbourhood. Greener colours indicate a higher percentage of PRM are using the SMTS. Redder colours indicate a lower percentage of PRM are using the SMTS.
Several other factors should be considered to understand the differences between neighbourhoods. The topography of Barcelona, which sits between the Mediterranean Sea and the Catalan Coastal Range, is crucial. Some neighbourhoods are situated in the hilly areas where the streets are steeper, making it more difficult for PRM to visit the closest public transport station, while others are located in flatter or plains areas. Furthermore, although we have not found a clear relationship with the amount of public transport available, it would also be interesting to analyse the waiting time to take public transport, the distance between stops, the accessibility of stations and the number of transfers needed to get from one point to another.
4. Behaviour of the Users
This section analyses the behaviour of users in terms of the frequency of use of the SMTS. When examining the users’ frequency of use of the SMTS, it can be observed that the top 1% of users who make more use of the SMTS benefit from 19% of the trips. In contrast, it takes 76% of the users who use the service the least to reach the same 19% of trips, which shows disproportionality of behaviour among SMTS users. Therefore, a post hoc analysis was further conducted to investigate the behaviour of users by categorising them according to the frequency of SMTS usage. These are placed into three categories: sporadic, frequent and overactive users.
The sporadic users utilise the service once per month (or even less), while the frequent users profit from this service up to two times per week. Lastly, the overactive users are the ones who use this service excessively, more than two times per week. By the results presented in Table 1, it is worth mentioning that 12.97% of the total trips are made by 68.58% of sporadic users, indicating that these users are not the primary users of the total trips. Specifically, 37.53% of the full trips are being utilised by only 3.52% of the users, namely the overactive ones. In fact, some overactive users have undertaken more than 1000 trips. These results show the importance of categorising the trips accordingly to the behaviour of the users.
Table 1. Information on the number and percentage of users and trips in each category of user behaviour.
| User Type | No. of Users | % of Users | No. of Trips | % of Trips |
|---|---|---|---|---|
| Sporadic users | 4520 | 68.58 | 32,977 | 12.97 |
| Frequent users | 1839 | 27.90 | 125,878 | 49.50 |
| Overactive users | 232 | 3.52 | 95,448 | 37.53 |
This entry is adapted from the peer-reviewed paper 10.3390/ijerph19084536
References
- 68% of the world population projected to live in urban areas by 2050, says UN . United Nations. Retrieved 2022-5-18
- The municipality of Barcelona . Statistical Institute of Catalonia (Idescat). Retrieved 2022-5-18
- Tuba Bakıcı; Esteve Almirall; Jonathan Wareham; A Smart City Initiative: the Case of Barcelona. Journal of the Knowledge Economy 2012, 4, 135-148, 10.1007/s13132-012-0084-9.
- Rocco Papa; Adriana Galderisi; Maria Cristina Vigo Majello; Erika Saretta; Smart and Resilient Cities. A Systemic Approach for Developing Cross-sectoral Strategies in the Face of Climate Change. TeMA - Journal of Land Use, Mobility and Environment 2015, 8, 19-49, 10.6092/1970-9870/2883.
- Global age-friendly cities: a guide . World Health Organization. Retrieved 2022-5-18
- Jill Louise Bezyak; Scott Sabella; Joy Hammel; Katherine McDonald; Robin Ann Jones; Dana Barton; Community participation and public transportation barriers experienced by people with disabilities. Disability and Rehabilitation 2019, 42, 3275-3283, 10.1080/09638288.2019.1590469.
- Accessibility and reduced mobility . Transports Metropolitans de Barcelona (TMB). Retrieved 2022-5-18
- Barcelona Accessible. La ciutat de les persones amb diversitat funcional . Institut Municipal de Persones amb Discapacitat. Retrieved 2022-5-18
- Barcelona Budget 2022 . Ajuntament de Barcelona. Retrieved 2022-5-18
- Sol·licitud de transport públic especial per a persones amb mobilitat reduïda severa de Barcelona . Àrea Metropolitana de Barcelona. Retrieved 2022-5-18
- Sol·licitud de servei esporàd . Àrea Metropolitana de Barcelona. Retrieved 2022-5-18
- Real Decreto 1971/1999, de 23 de diciembre, de procedimiento para el reconocimiento, declaración y calificación del grado de minusvalía. . Agencia Estatal Boletín Oficial del Estado. Retrieved 2022-5-18
- B. P. Shrestha; Alexandra Millonig; N. B. Hounsell; M. McDonald; Review of Public Transport Needs of Older People in European Context. Journal of Population Ageing 2016, 10, 343-361, 10.1007/s12062-016-9168-9.
- Elena Commodari; Maria Guarnera; Attention and aging. Aging Clinical and Experimental Research 2008, 20, 578-584, 10.1007/bf03324887.
- Eric Siéroff; Ambre Piquard; Attention and aging. Psychol Neuropsychiatr Vieil 2004, 2, 257-69, .
- Elena Commodari; Maria Guarnera; Attention and aging. Aging Clinical and Experimental Research 2008, 20, 578-584, 10.1007/bf03324887.
This entry is offline, you can click here to edit this entry!