Your browser does not fully support modern features. Please upgrade for a smoother experience.
Please note this is an old version of this entry, which may differ significantly from the current revision.
Wetlands constitute important habitats that provide several ecosystem services (ES). Wetlands have been termed the kidneys of the world for their water purification services and contain 20–25% of total soil organic carbon. Wetlands are among the ecosystems with the most valuable ES, with regulating services being the most important for inland wetlands.
- temperate wetlands
- ecosystem services
- intermittent wetlands
1. Definitions and Objectives
Although there is no global agreement on the definition of “wetland”, the Ramsar convention provides a well-accepted one by defining them as “areas of marsh, fen, peatland or water, whether natural or artificial, permanent or temporary, with water that is static or flowing, fresh, brackish or salt, including areas of marine water the depth of which at low tides does not exceed six metres” [1]. The definition was then expanded to include “… riparian and coastal zones adjacent to the wetlands and islands or bodies of marine water deeper than six metres at low tide lying within the wetlands” [2].
The main classes of wetlands are swamps, fens, bogs, and marshes. Other distinctions are then drawn, such as tidal and non-tidal, coastal, inland, freshwater, brackish or salt, or according to their substrate type (rock bottom, unconsolidated, rocky shore, unconsolidated shore, streambed, reef, [3]).
The total area occupied by wetlands is still subject to debate with recent estimates varying between about 12 × 106 km2 and 17 × 106 km2, with the lower value being probably the more accurate [4].
Examples of the biggest temperate wetlands are the Mississippi river delta in North America and the Danube delta and the Scottish Flow Country in Europe. Another notable example is the Norfolk Broads with habitats ranging from the open water of shallow lakes to flooded reedbeds and from boggy marshes and fens to wet ‘carr’ woodland with willows and alders [5]. Irish and Scottish bogs, together with the temperate parts of the mountain peatlands and lake littoral wetlands of Scandinavia and Finland, represent the widest expanses of peatlands in Europe.
Blankespoor et al. [6] estimate that with a 1 m sea level rise due to climate change, approximately 64% of the freshwater marsh, 72% of coastal wetlands, and 61% of brackish/saline wetlands in 86 developing countries are at risk. In light of these threats to wetlands, conservation efforts are being made worldwide and restoration is also underway for many different kinds of wetlands. One tool that can help with these efforts is the concept of ecosystem services (ES). ES were originally defined as the conditions and processes through which natural ecosystems sustain and fulfil human life [7] and are classified as provisioning, regulating, supporting and cultural. Although covering only 6 to 8% of the global land space, wetlands account for a disproportionate amount of the total value of the ES of all biomes (possibly around 36% [8]) This testifies to the importance of these habitats, with valuations of their ES growing worldwide.
About half of global wetland areas have been lost and much of the remaining wetland areas are degraded [9]. It is, therefore, crucial that we have accurate estimations of the value of wetlands, in order to be able to make a stronger case for their preservation.
2. ES Definition
The concept of ES originates from economic studies in the late 1970s, which have become more mainstream with increasing interest in methods of quantifying their economic benefit [10][11]. A common definition of ES as “the benefits that people obtain from ecosystems” has been provided by the Millennium Ecosystem Assessment (MEA) [12], which offers the four categories of provisioning, regulating, supporting, and cultural ES. Another definition describes ES as the functions of ecosystems that provide benefits to people [13]. A unifying classification system has been brought forward with the Common International Classification for Ecosystem Services (CICES), defined here as the contributions that ecosystems make to human well-being [14]. This builds on the approach of the MEA, but with the difference that, in the CICES classification, supporting services are classed as intermediate services. The CICES classification uses three main categories with some sub-categories: provisioning, regulating, and cultural ES. This classification is based on the cascade model, which proceeds from the biophysical structures and functions of ecosystems, to produce the final services, which in turn generate goods and benefits, as shown in Figure 1, illustrating how value is generated in this way.
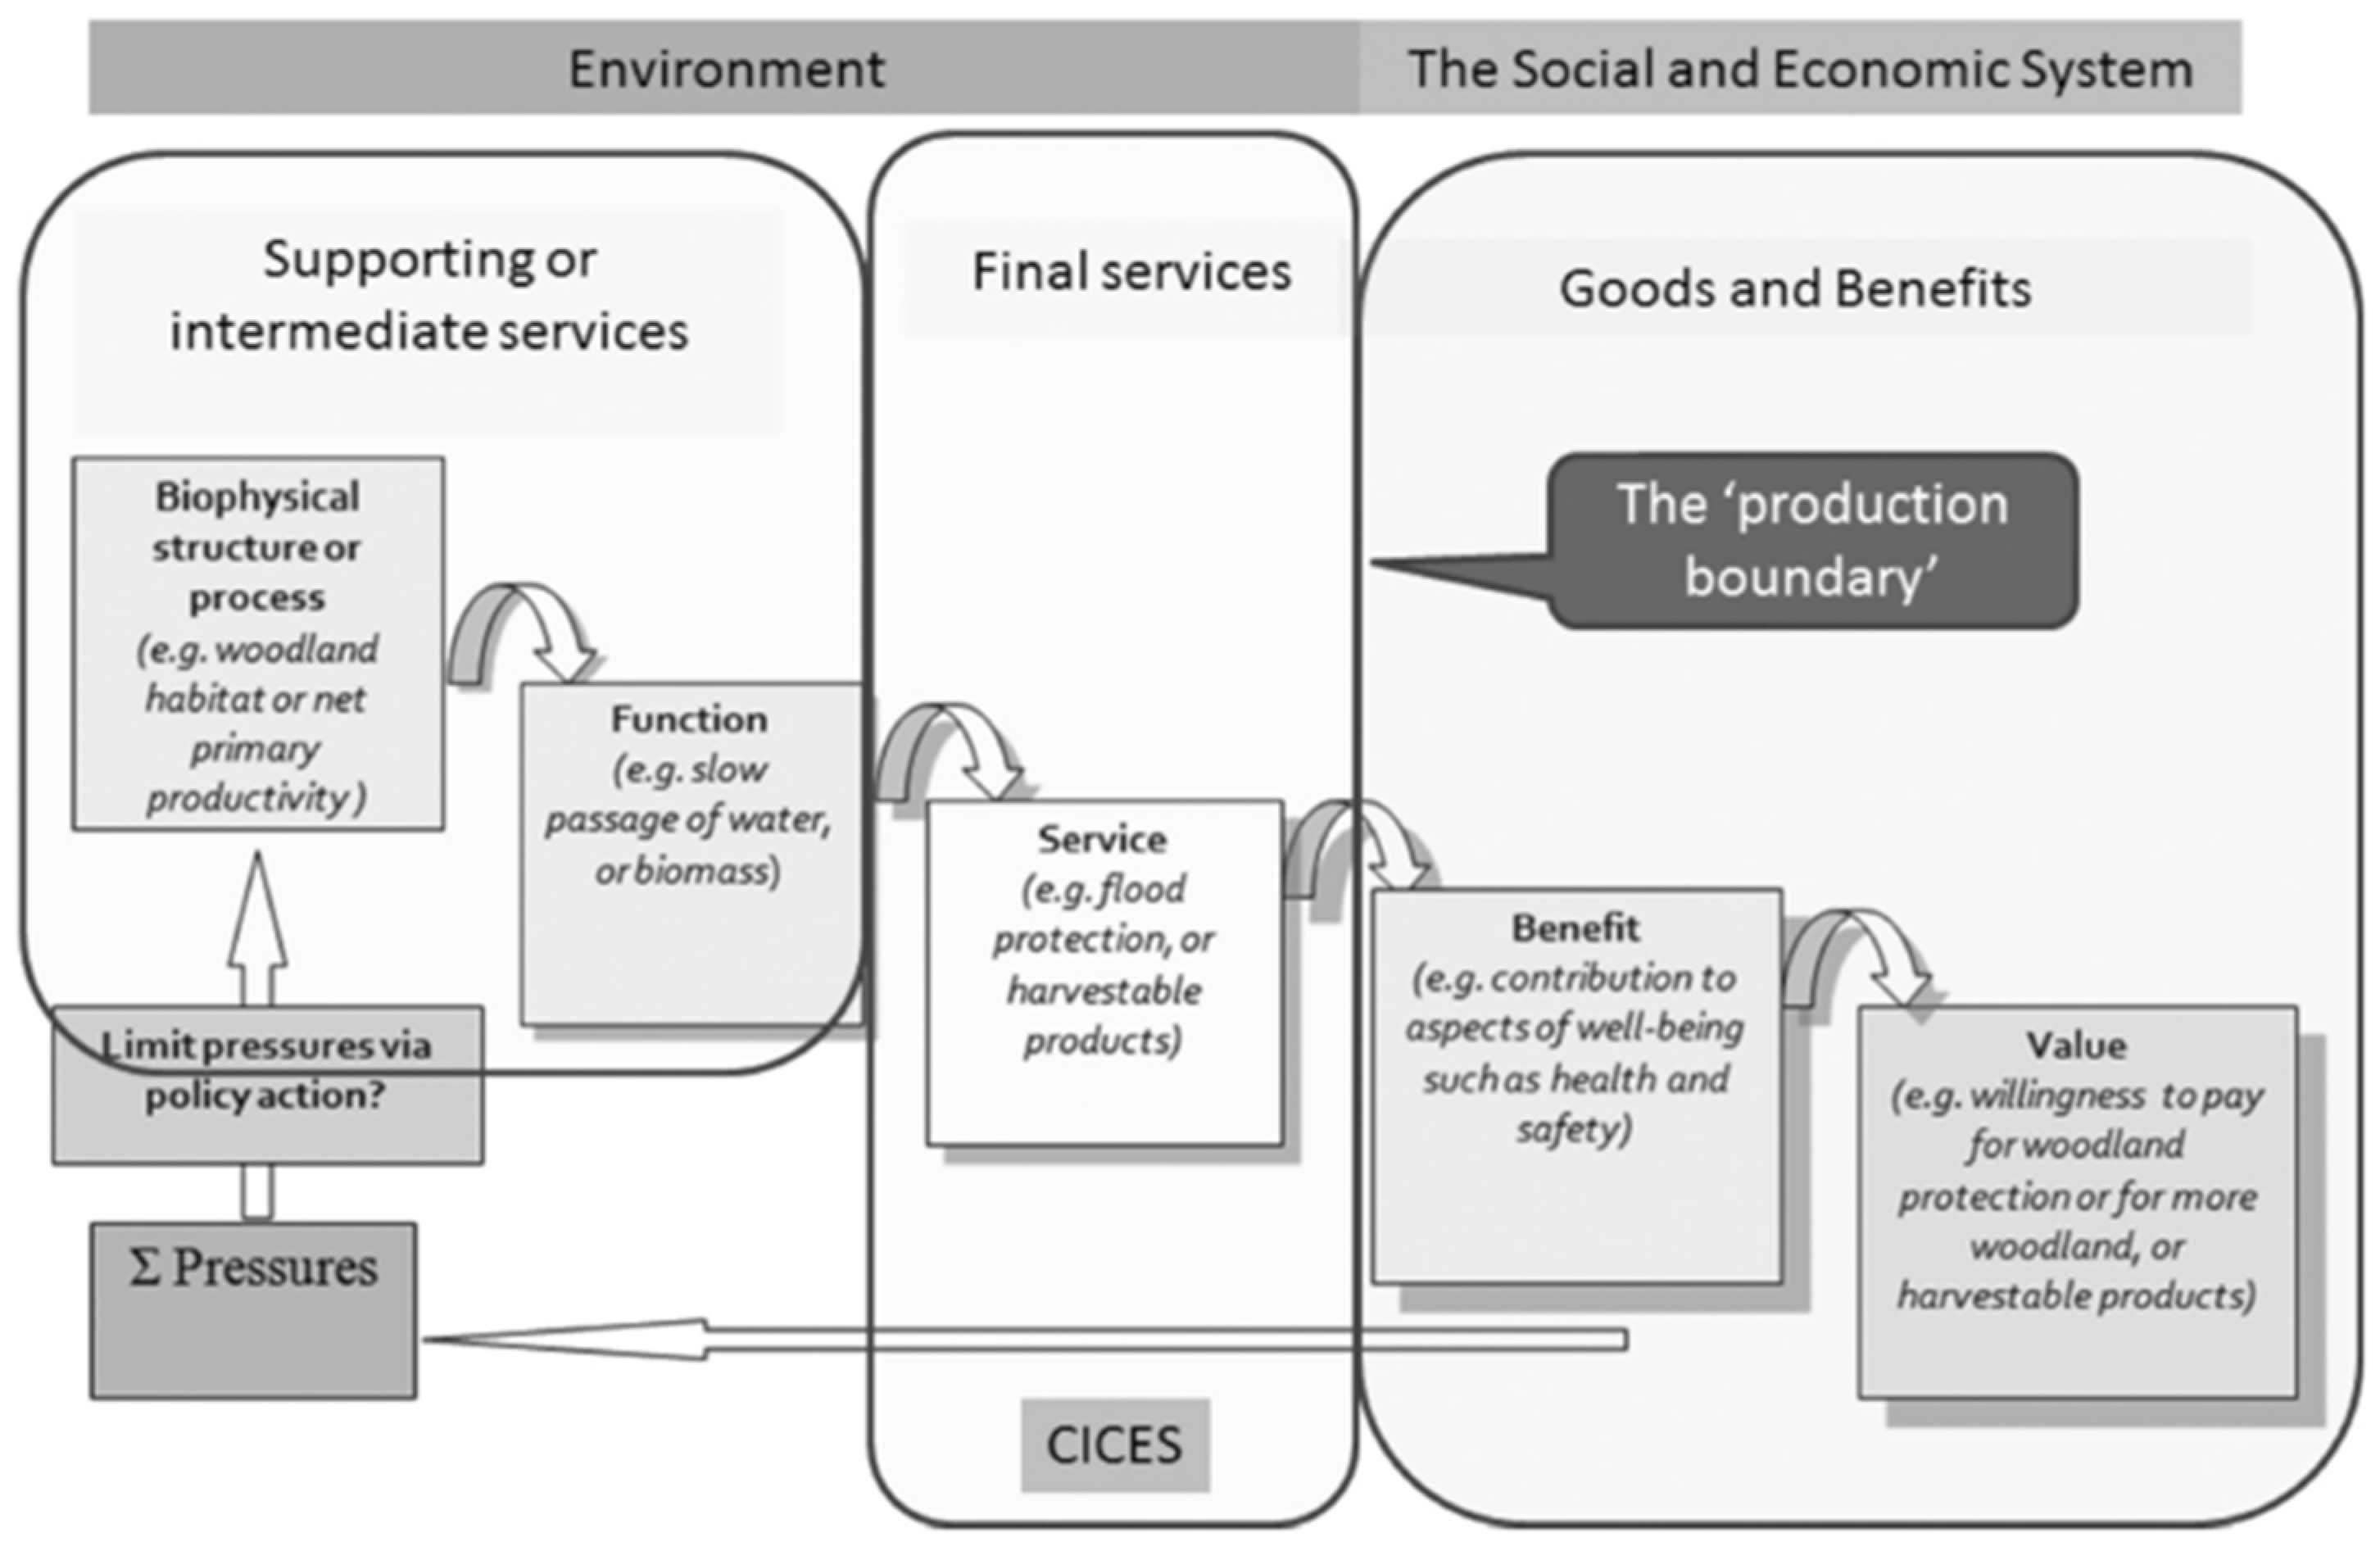
Figure 1. The CICES cascade framework for ecosystem services (ES)
The concept of ES has come under scrutiny and critique because of it being seen as anthropocentric in nature; therefore potentially promoting further exploitation of nature and undermining conservation efforts. It has been counter-argued that the concept of ES includes non-monetary and intrinsic values, which can help to reconnect humans with nature and it overlaps with the biodiversity concept [15]. Notwithstanding this debate, it is undeniable that the ES framework is being applied more and more in research as well as becoming mainstream in policy and planning; it provides increased awareness, communication, and participation, as well as spatially referenced knowledge [16]. The ES concept can help compare different management and policy options and choose the one with the least impact or that which promotes the highest level of ES [17]. Equally, it can be used to raise awareness of relative changes over certain time frames [18]. The Economics of Ecosystems and Biodiversity (TEEB, [17]) and the UK National Ecosystem Assessment (UKNEA, [19]) both highlighted the danger of loss of ES, including those associated with wetlands and peatlands in particular [20]. The Mapping of Ecosystems and their services (MAES) is also central to the European Biodiversity Strategy 2020 [21]. Among the ES frequently associated with wetlands are water supply and purification, flood and erosion control, carbon storage and sequestration, and habitat preservation [12].
3. Quantification and Valuation of ES
As defined by the MEA (2005) [12], value is “the contribution of an action, or object to user-specific goals, objectives, or conditions”. More specifically, the value of ES can be defined as the contributions of the ecosystem to supporting sustainable human wellbeing [22]. Different values can be highlighted depending on the frame of reference and on the stakeholders considered. It is important not to restrict valuation only to economic values but be aware of the other values such as inherent, fundamental, and eudemonistic [23].
A common approach is also to consider the Total Economic Value (TEV), which includes not only use and non-use value, but also non-direct values [24]. Non-direct values are the benefits provided by a good or service that are used indirectly by an economic agent (like water purified by a wetland and enjoyed further down in the catchment). The different kinds of value include:
- Social value: benefits are received by a group, not an individual. Examples are improved water quality and flood protection.
- Option value: the value for the conservation of a public asset or service even if it is not likely that it will be used and ensuring future availability.
- Existence value: the value deriving from the simple knowledge that the valued resource exists, even if it will never be used.
- Altruistic value: the value of ecosystems to others.
- Bequest value: the value associated with the satisfaction of preserving natural or cultural heritage for future generations.
Different methods have therefore been used to try to estimate the different components of TEV when a direct market and price are not available, as follows.
3.1. Market Prices
This approach estimates the value of an ecosystem good or service and its price on a market on which it is bought or sold. The value is determined by measuring the change in producer and consumer surplus after applying a change in production or price. Adjustments should be made to correct for market distortions, such as taxes and subsidies [25].
3.2. Cost-Based Methods
These methods are not a strict evaluation of the economic value of ecosystem service and assume that these values can be estimated by analysing the costs incurred in substituting them or avoiding damage. Examples are replacement cost, opportunity costs, the avoided damage cost, defensive expenditures, replacement/substitute costs, net factor income, travel cost, hedonic pricing, and restoration costs methods [26]. The replacement cost method requires the evaluation of the cheapest price that should be paid for the replacement of the function under scrutiny. This method has the advantage of being accepted by traditional economists. It also gives higher valuations than the other methods. Uncertainties remain though as to whether all the services provided at the moment would be replaced.
3.3. Stated Preference Approaches (Contingent Valuation and Choice Modelling)
Both methods involve using a hypothetical or contingent market in the absence of a free market for non-market goods. For the contingent valuation method, originally proposed by Davis (1963) [27], the value is then the amount that society would be willing to pay to produce and/or use a good beyond the value it already pays. Choice modelling involves the public in choosing between alternatives, thus having them reveal or state their willingness to pay for a good or service. It can be traced back to consumer studies by Thurston in the 1920s and to random utility theory [28]. This was then developed by Daniel Mc Fadden in economics [29] and by Duncan Luce [30] and Anthony Marley [31] in mathematical psychology.
3.4. Revealed Preference Methods
These methods imply gathering data linked to the preference of the public for a good linked to a specific ecosystem service. The main ones are hedonic pricing and travel cost methods. The hedonic pricing method (HPM) uses a surrogate market (usually the housing market) to quantify the revealed preference of the public in living in a certain area affected by an ecosystem good or service [32].
3.5. Production Function
The production function method estimates changes in producer and consumer surplus due to quantity or quality changes in an environmental good or services which is part of a production process. If the price does not change, only the producer surplus is affected [33].
3.6. Value Transfer
This method consists of using estimates from previous studies to value services provided by the studied ecosystems. This method takes two different approaches. In direct value transfer a value for an ecosystem service is directly transferred to the studied site. Ideally the two sites have similar characteristics, otherwise corrections should be applied. The other approach uses transfer functions, the terms of which have ideally been determined through a meta-analysis of valuation literature [34].
The total revenue, opportunity and replacement cost methods are not based on sound economic theory and therefore will tend to under- or overestimate values [34]. Brander et al. (2006) [33] also found that value transfers tend to have an average transfer error of 74%, which might be justified however, in light of the higher cost of primary valuations.
The TEV does not, however, represent the whole value of ecosystems, as other sets of values are provided by ecosystems. These represent the role of wetlands in the natural system and are usually presented in terms of biodiversity.
More inclusive estimations of values should be used, as to try to incorporate non-economic ecosystem values, such as inherent, contributory, primary, and infrastructure values [26]. One of these approaches is the eco-price, which considers both biophysical and economic valuation [35].
3.7. Valuation Tools Used for the Different ES
ES valuation is performed in different phases and using different tools, depending on the ES present and on the scale of the assessment (Table 1). A biophysical quantification of ES is a prerequisite of carrying out an economic one. It can use direct measurement of the variables of interest, though this can be costly, and therefore indicators or proxy data and spatial models are often used. Indicators can be primary (when they directly refer to the ES quantified, e.g., number of tourists visiting a natural area), or secondary, when they indirectly help quantify said ecosystem service (e.g., accessibility or naturalness as a proxy for touristic value). The most used indicators for mapping ES are land cover, soil, vegetation, and nutrient related indicators (Table 2). Egoh et al. (2012) [36], found that land cover is an important secondary indicator for all the categories of ES. Nutrient fluxes and soil characteristics are other important secondary indicators. Vegetation maps are useful for carbon sequestration and water regulation.
Table 1. Economic valuation methods of the different ecosystem services (ES). CV: Contingent Valuation/Choice Modelling; DE: Defensive Expenditures/Averting Behaviour/Avoided Costs; HPM: Hedonic Pricing Method; MA: Market Analysis; PF: Production Function; RC: Replacement/Restoration Costs; TC: Travel Cost.
| ES | Valuation Methods |
|---|---|
| Provisioning | |
| Water for residential use, livestock watering, and food manufacture processing | MA; PF; RC; CV; DE, HPM |
| Water for landscape, turf, and agricultural irrigation | MA; PF; RC; DE; CV |
| Food, reeds, grass/hay or timber harvesting, pharmaceuticals, and other products used in industry | MA; PF; CV |
| Regulating | |
| Habitat preservation | MA; PF; RC; CV; TC; DE, HPM |
| Climate regulation | MA; PF; RC; CV; DE; HPM |
| Waste removal | MA; PF; RC; CV; DE; HPM |
| Nutrient and toxicant retention | MA; PF; RC; CV; DE; HPM |
| Saltwater intrusion | MA; PF; RC; DE; CV |
| Erosion prevention, flood and storm protection, and shoreline stabilisation | MA; PF; RC; DE; CV; HPM |
| Cultural | |
| Recreational fishing, boating, hunting, trapping, and plant gathering | MA, PF, RC, CV, TC, DE, HPM |
| On and off-site observation for leisure, education, and scientific activities | MA; PF; RC; DE; CV; TC |
| Cultural, historic and aesthetic value provision | CV |
Table 2. Indicators for ES assessment.
| ES | Indicators |
|---|---|
| Fisheries and aquaculture | Fish production or fish catch; status of fish populations; aquaculture production; wild vegetation used in gastronomy, cosmetic or pharmaceutical uses; number of fishermen |
| Water for drinking purposes | Water consumption for drinking; water abstracted; surface water availability; water exploitation index (WEI); nitrate-vulnerable zones |
| Water purification | Indicators of surface water quality (nitrate, phosphates, coliforms…); indicators of groundwater quality; nutrient loads; nutrient concentration; nutrient retention; trophic status; ecological status; area occupied by riparian forests; potential mineralisation or decomposition; number and efficiency of treatment plants; wastewater treated |
| Erosion prevention | Sediment retention; groundwater evolution |
| Flood prevention | Flood risk maps; water holding capacity of soils; conservation of river and lakes banks; groundwater level evolution; flood plains area (and record of annual floods); area of wetlands located in flood risk zones; conservation status of riparian wetlands |
| Maintaining habitats | Biodiversity value (species diversity or abundance, endemics or red-listed species…); ecological status; hydromorphological status |
| Recreation | Number of visitors to natural places; number of visitors to attractions; National Parks and Natura 2000 sites; number of bird-watching sites; number of bathing areas and beaches; fish and waterfowl abundance; quality of fresh waters for fishing; number of waterfowl hunters and anglers; number of fishing licenses and fishing reserves; tourism revenue |
| Intellectual and aesthetic appreciation | Sites monitored by scientists; number of scientific projects, articles, studies; classified sites (e.g., World Heritage…); Number of visitors; National Parks and Natura 2000 sites; cultural sites and number of annual cultural events; contrasting landscapes; proximity to urban areas of scenic rivers or lakes. |
Provisioning services can be quantified by primary data; however, usually indirect indicators are used (e.g., landscape cover for food production). Regulating services such as carbon sequestration and water quantity regulation are usually quantified through models, given their complex nature [36].
The spatial and temporal scales of valuations should also be considered. Spatially, the amount of population affected by an impact under investigation must be determined. Direct uses of the wetland concern existing and potential users of the resource. Indirect uses values may not be site-specific; for example, the benefits provided by flood risk reduction further down the catchment. Non-use benefits are valued over a wider geographical area but are also subject to decrease with distance from the site of interest. The temporal scale entails considering a trade-off between short-term and long-term benefits. Many projects consider a long-term timescale and issues such as future demand for a particular service and discount rates must be considered.
Recently, several studies made a distinction between ES supply and demand ([37][38]). Supply can be defined as the capacity of an ecosystem to provide ES within a certain timeframe, while demand can be described as the sum of all ecosystem goods and services currently consumed or used in a particular over a given time period ([37][39]). The analysis of supply and demand of ES is important to assess the sustainability of ES provision.
This entry is adapted from the peer-reviewed paper 10.3390/w14091345
References
- Ramsar Convention. 1971. Available online: https://www.ramsar.org/document/the-convention-on-wetlands-text-as-originally-adopted-in-1971 (accessed on 20 September 2020).
- Ramsar Convention. Wetland inventory: A Ramsar framework for wetland inventory and ecological character description. In Ramsar Handbooks for the Wise Use of Wetlands, 4th ed.; Ramsar Convention Secretariat: Gland, Switzerland, 2010; Volume 15, Available online: www.ramsar.org (accessed on 3 September 2020).
- Cowardin, L.M.; Carter, V.; Golet, F.C.; Laroe, E.T. Classification of Wetlands and Deepwater Habitats of the United States; Fish and Wildlife Service, US Department of the Interior: Washington, DC, USA; Northern Prairie Wildlife Research Center: Jamestown, ND, USA, 1979.
- Davidson, N.C.; Finlayson, C.M. Extent, regional distribution and changes in area of different classes of wetland. Mar. Freshw. Res. 2018, 69, 1525–1533.
- Plantlife. Available online: https://www.plantlife.org.uk/uk (accessed on 26 January 2022).
- Blankespoor, B.; Dasgupta, S.; Laplante, B. Sea-level rise and coastal wetlands. Ambio 2014, 43, 996–1005.
- Daily, G.C. Nature’s Services: Societal Dependence on Natural Ecosystems; Yale University Press: London, UK, 1997.
- De Groot, R.; Brander, L.; Van Der Ploeg, S.; Costanza, R.; Bernard, F.; Braat, L.; Christie, M.; Crossman, N.; Ghermandi, A.; Hein, L.; et al. Global estimates of the value of ecosystems and their services in monetary units. Ecosyst. Serv. 2012, 1, 50–61.
- Zedler, J.B.; Kercher, S. Wetland resources: Status, trends, ecosystem services, and restorability. Annu. Rev. Environ. Resour. 2005, 30, 39–74.
- Gómez-Baggethun, E.; de Groot, R.; Lomas, P.L.; Montes, C. The history of ecosystem services in economic theory and practice: From early notions to markets and payment schemes. Ecol. Econ. 2010, 69, 1209–1218.
- Costanza, R.; d’Arge, R.; de Groot, R.; Farber, S.; Grasso, M.; Hannon, B.; Limburg, K.; Naeem, S.; O’Neill, R.V.; Paruelo, J.; et al. The value of the world’s ecosystem services and natural capital. Nature 1997, 387, 253–360.
- Millennium Ecosystem Assessment Board. Ecosystems and Human Well-Being: Wetlands and Water Synthesis; UNEP—UN Environment Programme: Geneva, Switzerland, 2005; Available online: https://wedocs.unep.org/20.500.11822/8735 (accessed on 26 January 2022).
- Mace, G.M.; Norris, K.; Fitter, A.H. Biodiversity and ecosystem services: A multi-layered relationship. Trends Ecol. Evol. 2012, 27, 19–26.
- Potschin-Young, M.; Haines-Young, R.; Görg, C.; Heink, U.; Jax, K.; Schleyer, C. Understanding the role of conceptual frameworks: Reading the ecosystem service cascade. Ecosyst. Serv. 2018, 29, 428–440.
- Schröter, M.; Van Der Zanden, E.H.; van Oudenhoven, A.; Remme, R.; Serna-Chavez, H.M.; De Groot, R.S.; Opdam, P. Ecosystem services as a contested concept: A synthesis of critique and counter-arguments. Conserv. Lett. 2014, 7, 514–523.
- Dick, J.; Turkelboom, F.; Woods, H.; Iniesta-Arandia, I.; Primmer, E.; Saarela, S.-R.; Bezák, P.; Mederly, P.; Leone, M.; Verheyden, W.; et al. Stakeholders’ perspectives on the operationalisation of the ecosystem service concept: Results from 27 case studies. Ecosyst. Serv. 2018, 29, 552–565.
- Russi, D.; ten Brink, P.; Farmer, A.; Badura, T.; Coates, D.; Förster, J.; Kumar, R.; Davidson, N. The Economics of Ecosystems and Biodiversity for Water and Wetlands; IEEP: London, UK; Brussels, Belgium; Ramsar Secretariat: Gland, Switzerland, 2013.
- Reynaud, A.; Lanzanova, D.; Liquete, C.; Grizzetti, B. Cook-Book for Water Ecosystem Service Assessment and Valuation; European Commission—Joint Research Centre: Luxembourg, 2015; Volume 136, p. 2015.
- UKNEA. UK National Ecosystem Assessment; DEFRA: Cambridge, UK, 2011.
- Van der Wal, R.; Bonn, A.; Monteith, D.; Reed, M.; Blackstock, K.; Hanley, N.; Armitage, H. Mountains, moorlands and heaths. In UK National Ecosystem Assessment: Technical Report; United Nations Environment Programme World Conservation Monitoring Centre: Cambridge, UK, 2011; pp. 105–159. ISBN 9789280731644. Available online: http://uknea.unep-wcmc.org/Resources/tabid/82/Default.aspx (accessed on 23 March 2020).
- Burkhard, B.; Santos-Martin, F.; Nedkov, S.; Maes, J. An operational framework for integrated mapping and assessment of ecosystems and their services (MAES). One Ecosyst. 2018, 3, e22831.
- Costanza, R.; de Groot, R.; Sutton, P.; van der Ploeg, S.; Anderson, S.J.; Kubiszewski, I.; Farber, S.; Turner, R.K. Changes in the global value of ecosystem services. Glob. Environ. Chang. 2014, 26, 152–158.
- Jax, K.; Barton, D.N.; Chan, K.M.; De Groot, R.; Doyle, U.; Eser, U.; Haines-Young, R. Ecosystem services and ethics. Ecol. Econ. 2013, 93, 260–268.
- Potschin, M.; Haines-Young, R. Defining and measuring ecosystem services. In Routledge Handbook of Ecosystem Services; Potschin, M., Haines-Young, R., Fish, R., Turner, R.K., Eds.; Routledge: London, UK; New York, NY, USA, 2016; pp. 25–44. Available online: http://www.routledge.com/books/details/9781138025080/ (accessed on 4 August 2020).
- Bateman, I.J.; Mace, G.M.; Fezzi, C.; Atkinson, G.; Turner, R.K. Economic analysis for ecosystem service assessments. In Valuing Ecosystem Services; Edward Elgar Publishing: Cheltenham, UK, 2014.
- Georgiou, S.; Turner, R.K. Valuing Ecosystem Services: The Case of Multi-Functional Wetlands; Routledge: Oxfordshire, UK, 2012.
- Davis, R.K. The Value of Outdoor Recreation: An Economic study of Maine Woods. Ph. D Thesis, Harvard University, Cambridge, MA, USA, 1963.
- Thurstone, L.L. A law of comparative judgment. Psychol. Rev. 1994, 101, 266.
- Zarembka, P. Transformation of Variables in Econometrics. In Palgrave Macmillan; The New Palgrave Dictionary of Economics, Palgrave Macmillan: London, UK, 1987.
- Luce, R.D. Conditional Logit Analysis of Qualitative Choice Behavior; John Wiley & Sons: New York, NY, USA, 1959.
- Marley, A.A.J. Some probabilistic models of simple choice and ranking. J. Math. Psychol. 1968, 5, 311–332.
- Vanslembrouck, I.; Van Huylenbroeck, G.; Van Meensel, J. Impact of agriculture on rural tourism: A hedonic pricing approach. J. Agric. Econ. 2005, 56, 17–30.
- Brander, L.M.; Florax, R.J.; Vermaat, J.E. The empirics of wetland valuation: A comprehensive summary and a meta-analysis of the literature. Environ. Resour. Econ. 2006, 33, 223–250.
- Brander, L. Guidance Manual on Value Transfer Methods for Ecosystem Services; UNEP: Nairobi, Kenya, 2013.
- Campbell, E.T. Revealed social preference for ecosystem services using the eco-price. Ecosyst. Serv. 2018, 30, 267–275.
- Egoh, B.; Drakou, E.G.; Dunbar, M.B.; Maes, J.; Willemen, L. Indicators for Mapping Ecosystem Services: A Review; European Commission, Joint Research Centre (JRC): Petten, The Netherlands, 2012; p. 111.
- Burkhard, B.; Kandziora, M.; Hou, Y.; Müller, F. Ecosystem service potentials, flows and demands-concepts for spatial localisation, indication and quantification. Landsc. Online 2014, 34, 1–32.
- Villamagna, A.M.; Mogollón, B.; Angermeier, P.L. A multi-indicator framework for mapping cultural ecosystem services: The case of freshwater recreational fishing. Ecol. Indic. 2014, 45, 255–265.
- Ala-Hulkko, T.; Kotavaara, O.; Alahuhta, J.; Hjort, J. Mapping supply and demand of a provisioning ecosystem service across Europe. Ecol. Indic. 2019, 103, 520–529.
This entry is offline, you can click here to edit this entry!