Remote sensing (RS) enables a cost-effective, extensive, continuous and standardized monitoring of traits and trait variations of geomorphology and its processes, from the local to the continental scale. RS technologies can record geomorphic traits, their diversity and variations, from which the other four geomorphodiversity characteristics are derived. However, compared to in situ measurements, RS approaches can only record certain parts of these geomorphic traits and their variations. This is because capturing geomorphic traits and diversity using RS approaches is limited by various constraints, namely: (1) the characteristics and spatial-temporal distribution of geomorphic traits; (2) the characteristics of geomorphological processes; as well as (3) the RS sensor characteristics, the chosen RS platforms and the characteristics of RS data-processing and classification information. These constraints and limitations define the detectability, feasibility, accuracy, depth of information, repeatability, and, thus, standards disability in monitoring the five geomorphic characteristics using RS approaches.
- Remote sensing
- Geomorphodiversity
- Structural
- Taxonomic
- Genesis
- Functional
- Traits
- Geomorphic Traits
- Biodiversity
- Earth Observation
1. Characteristics of Geomorphodiversity
-
Geomorphic trait diversity, which represents the diversity of mineralogical, bio-/geochemical, bio-/geo-optical, chemical, physical, morphological, structural, textural, or functional characteristics of geomorphic components that affect, interact with, or are influenced by geomorphic genesis diversity, geomorphic taxonomic diversity, geomorphic structural diversity, and geomorphic functional diversity.
-
Geomorphic genesis diversity represents the diversity of the length of evolutionary pathways, linked to a given set of geomorphic traits, taxa, structures, and functions. Therefore, sets of geomorphic traits, taxa, structures, and functions are identified that maximize the accumulation of geomorphic-functional diversity.
-
Geomorphic structural diversity, which is the diversity of composition and configuration of 2D to 4D geomorphic structural traits.
-
Geomorphic taxonomic diversity, which stands for the diversity of geomorphic components that differ from a taxonomic perspective.
-
Geomorphic functional diversity, which is the diversity of geomorphic functions and processes, as well as their intra- and interspecific interactions.
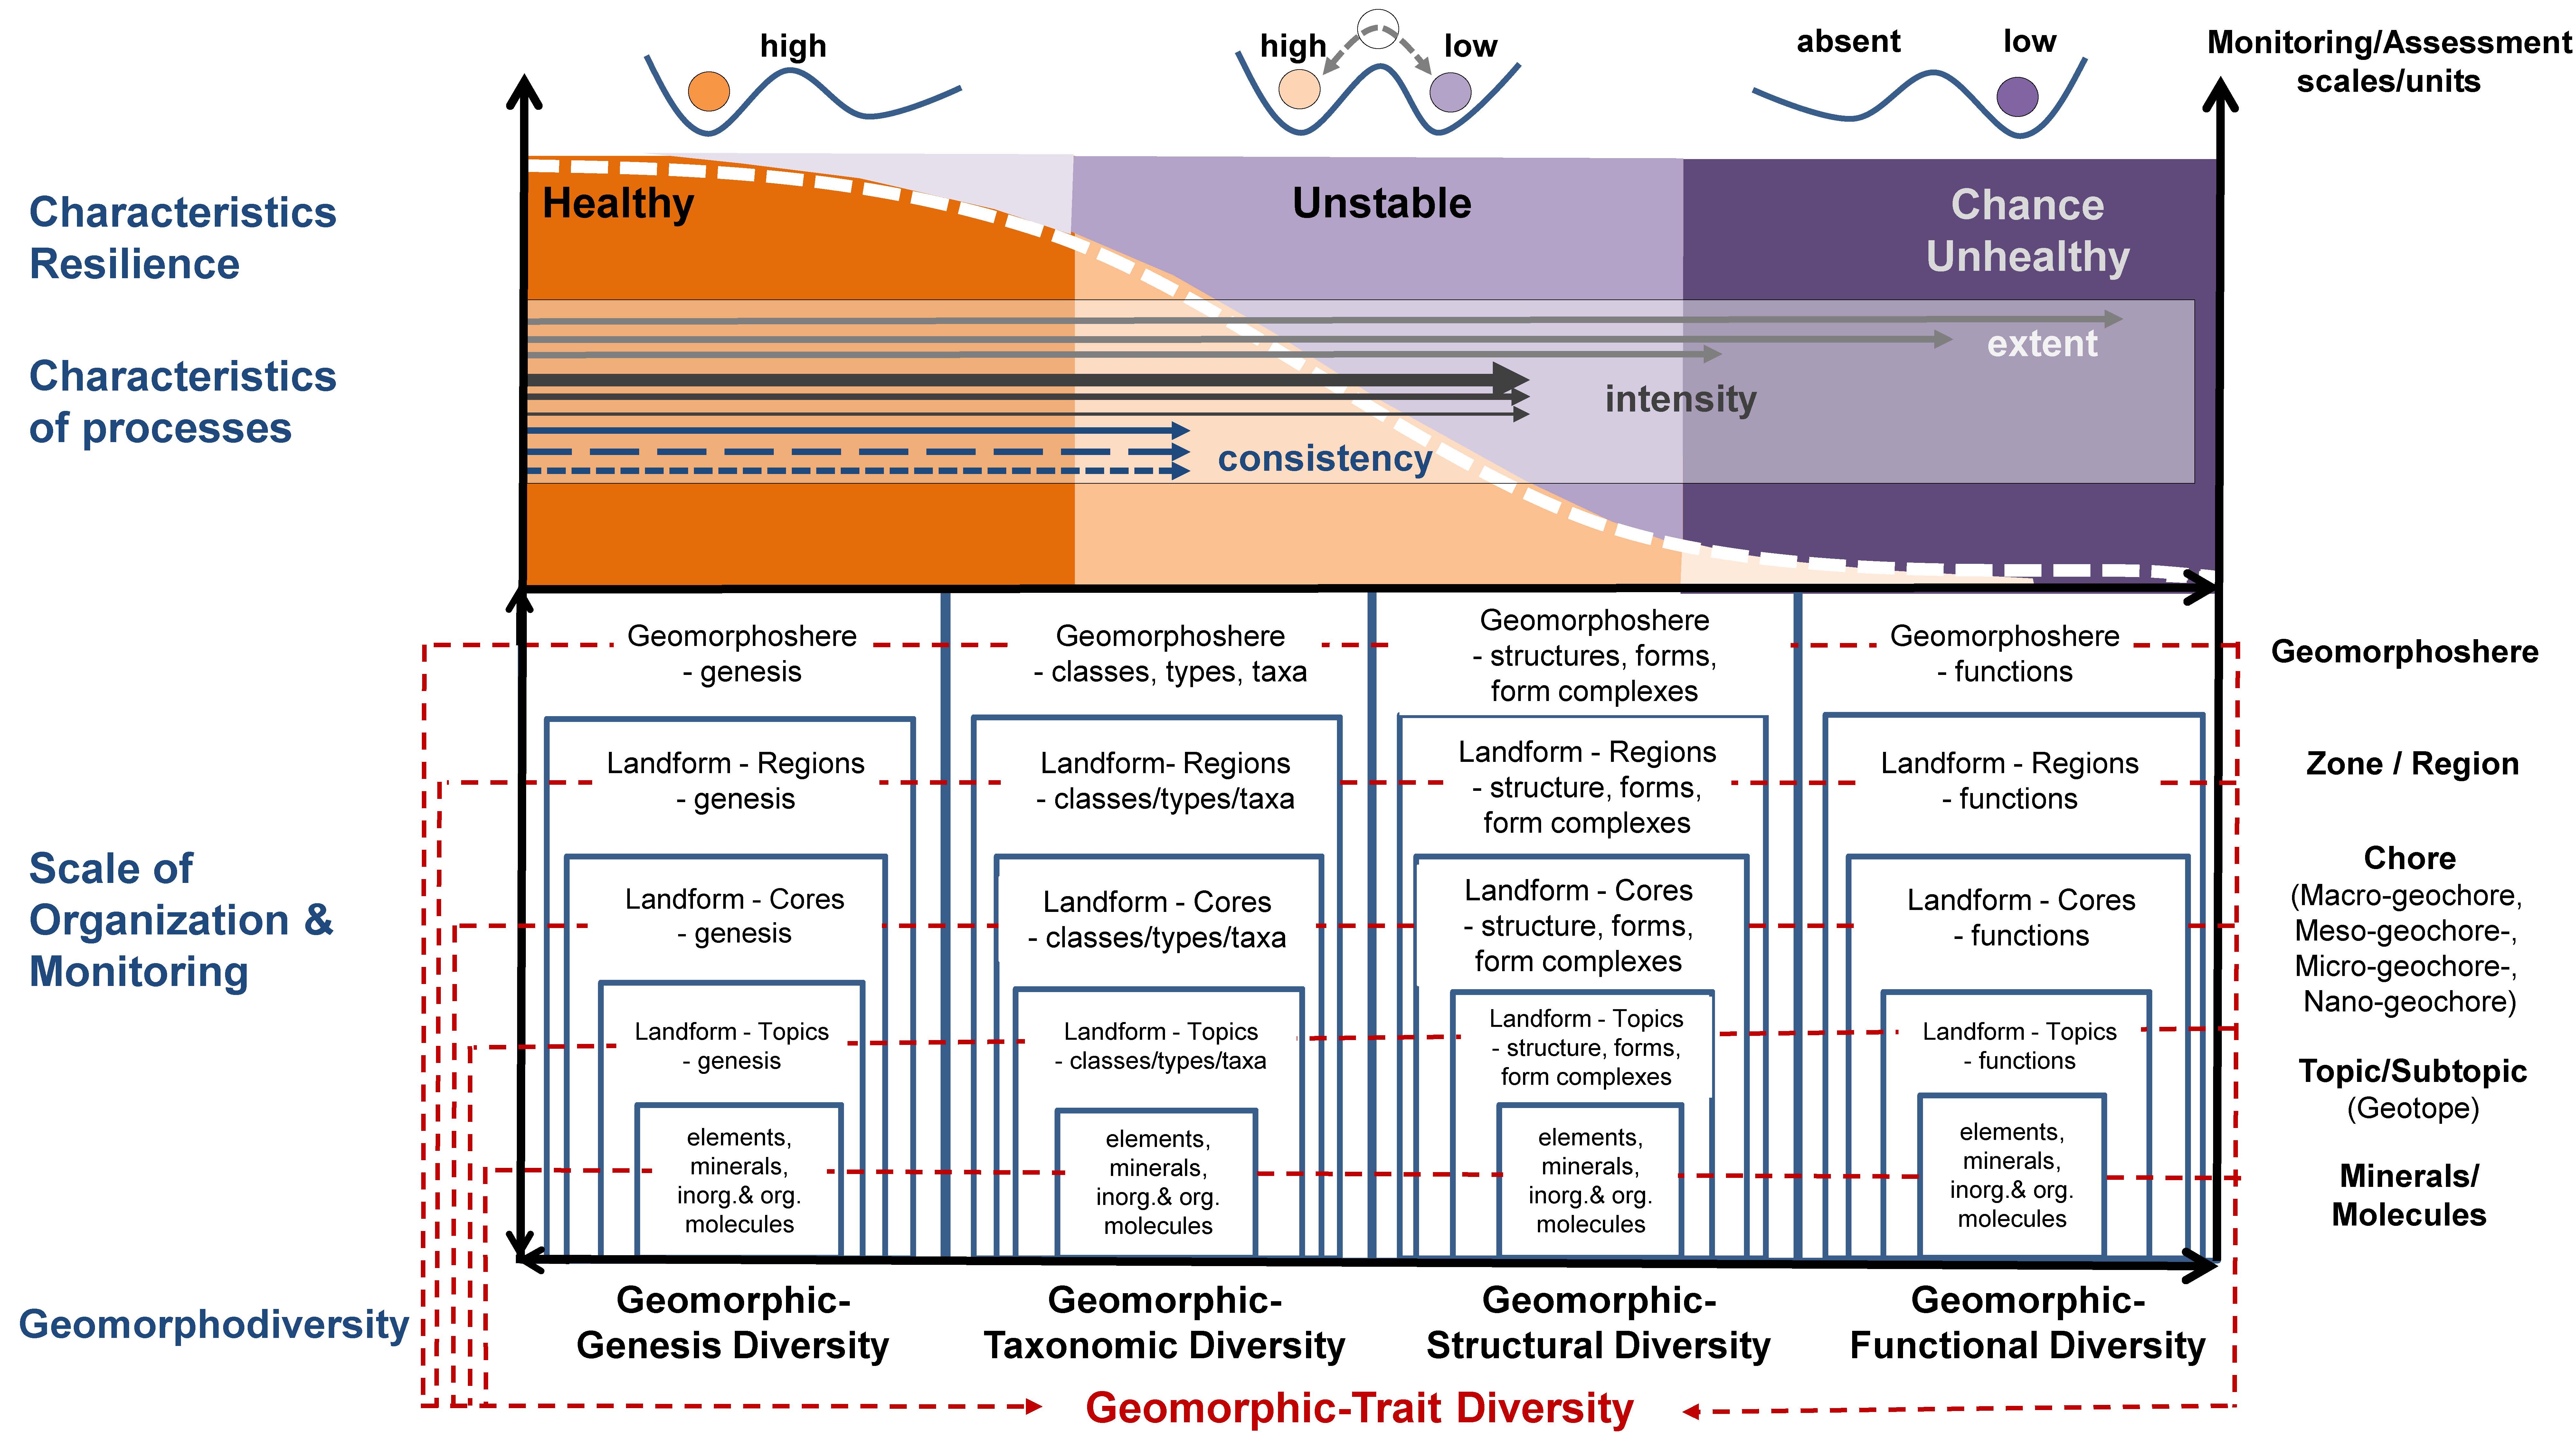 Figure 3. The five characteristics of geomorphodiversity exist on all the spatial, temporal, and directional scales of geomorphic organization (modified after Lausch et al. [1]).
Remote Sens. 2022, 14, 2279 10 of 48 traits are referred as spectral trait variations (STV). Hence, the respective RS approaches are referred as RS spectral traits and RS spectral trait variations—concept (RS-ST/STV-C; see Figure 5) [2].
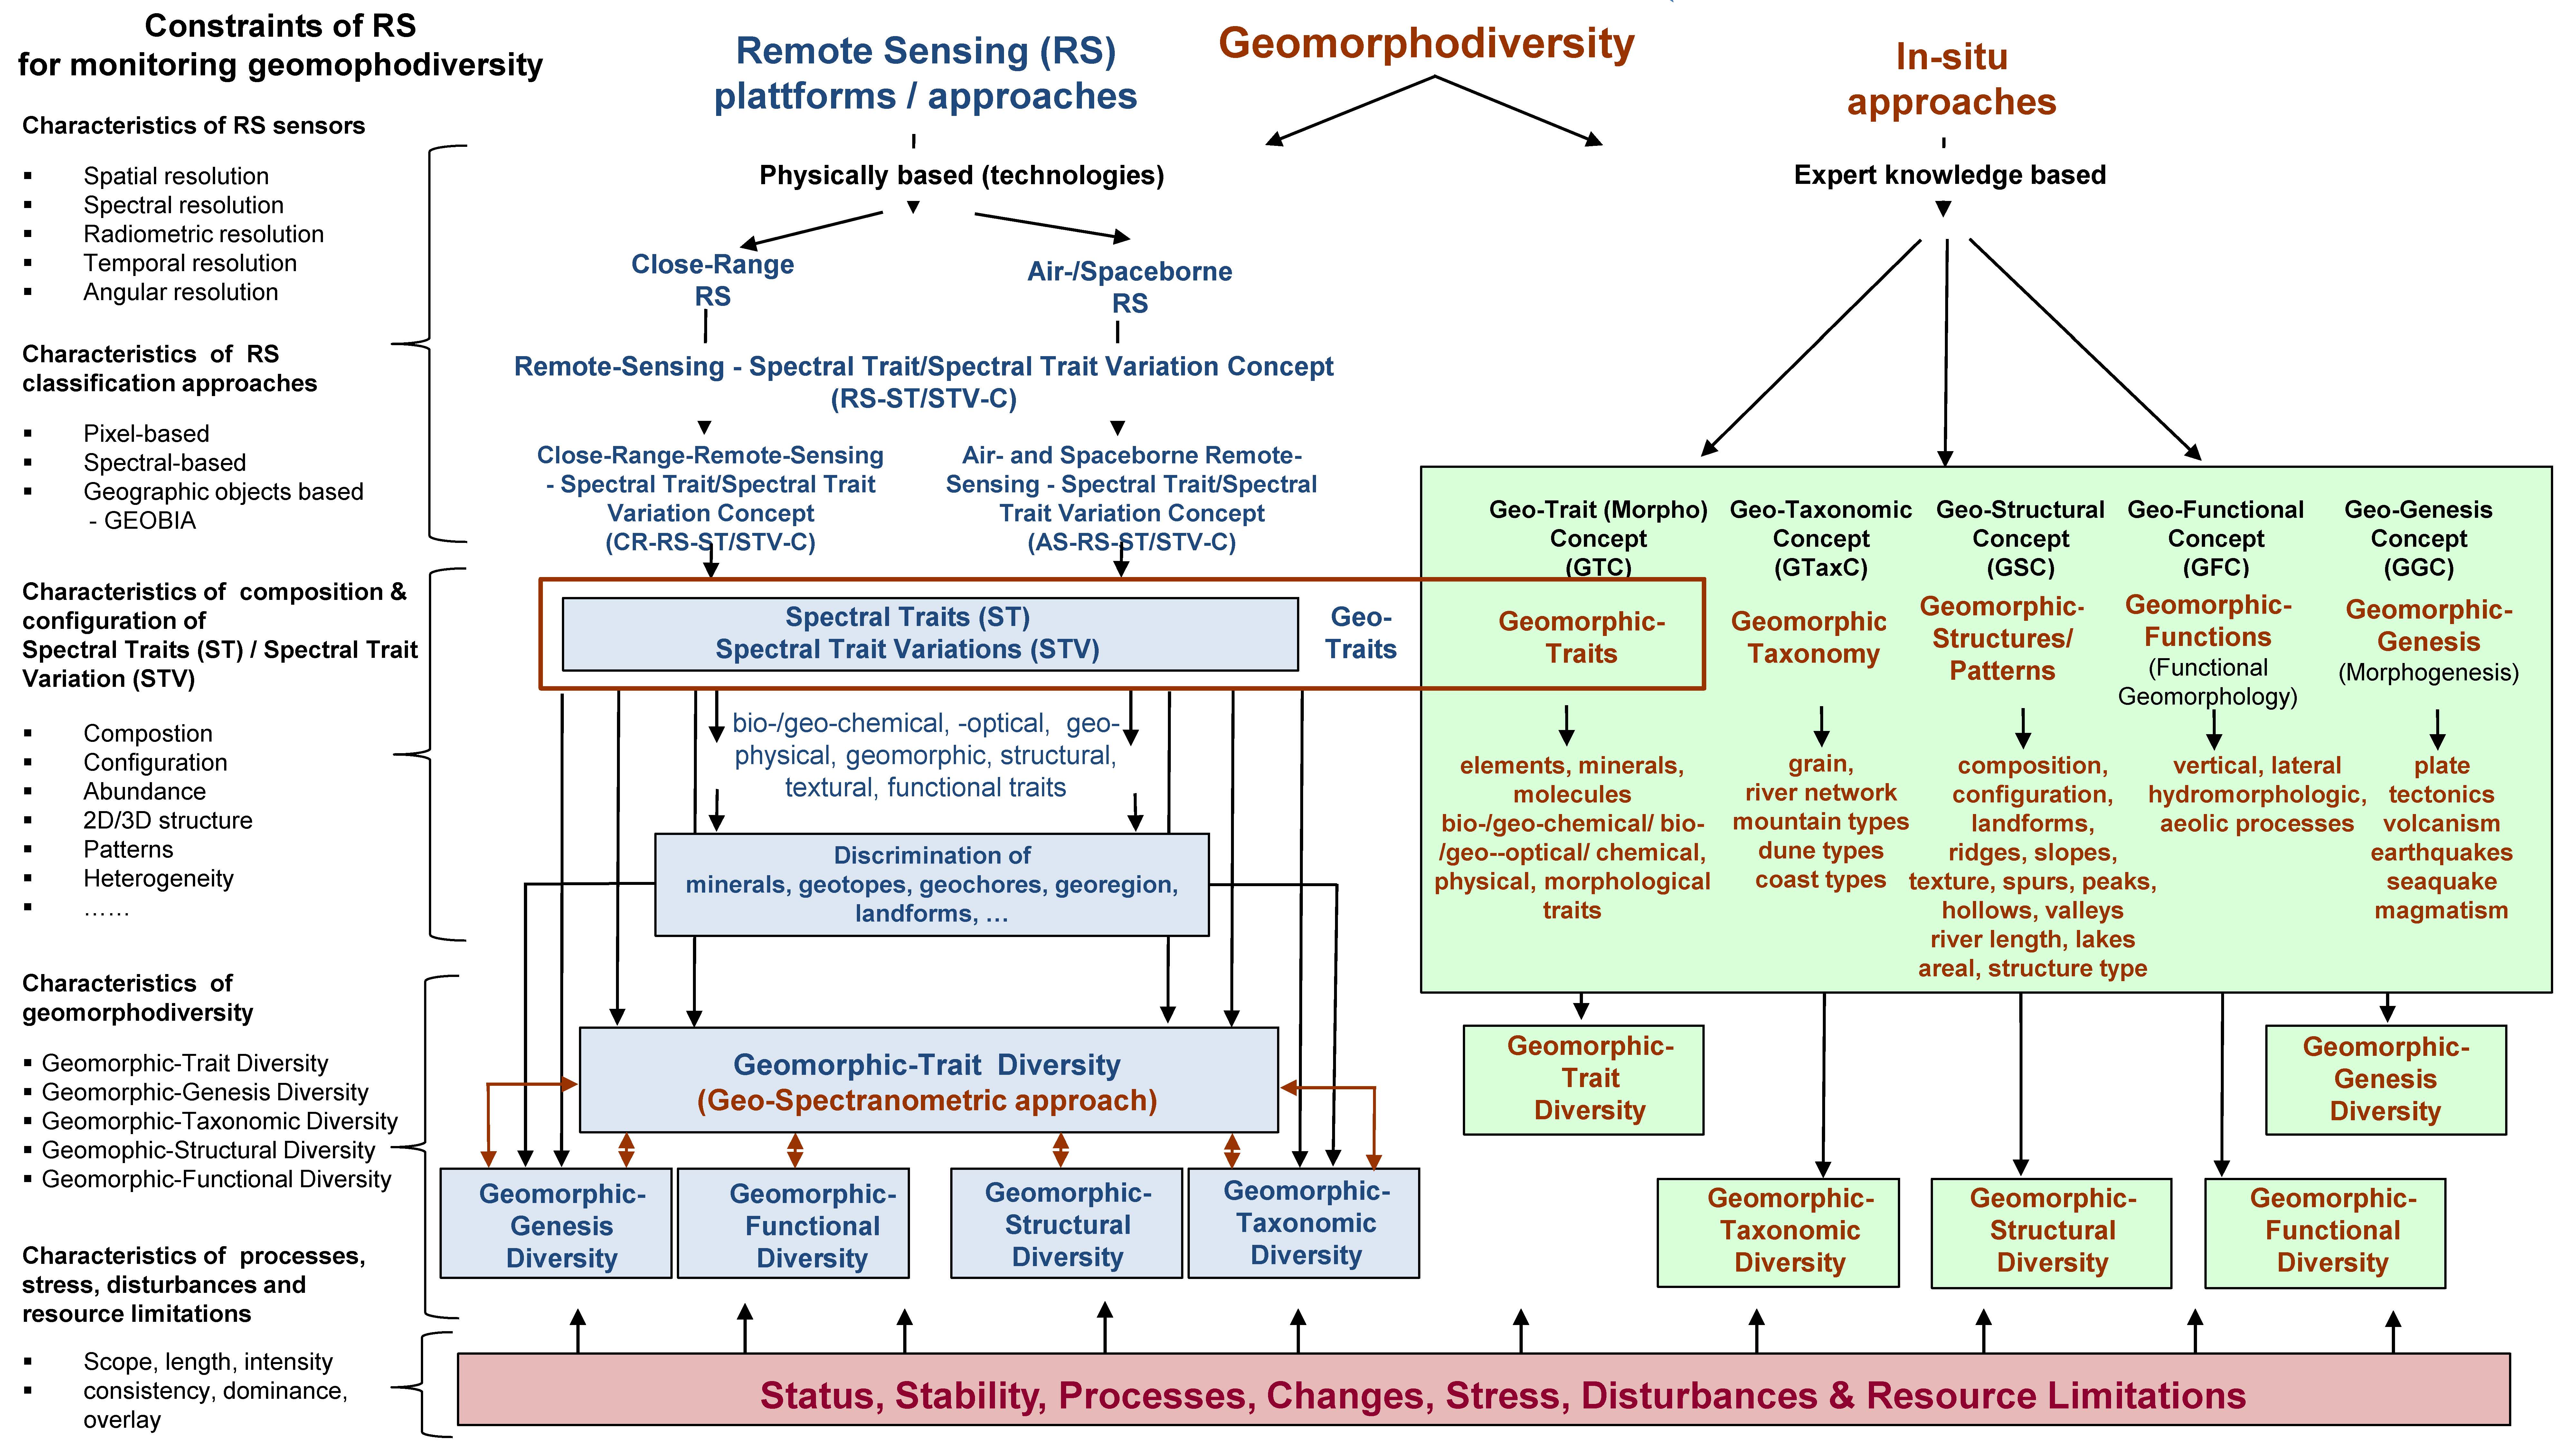 Figure 5. In situ and remote sensing (RS) approaches, common links, and the constraints of RS for monitoring the five characteristics of geomorphodiversity. Geomorphological traits are the crucial link between in situ and RS monitoring approaches (from Lausch et al. [1] ).
2. Geomorphic Trait Diversity and Its Changes Using RS
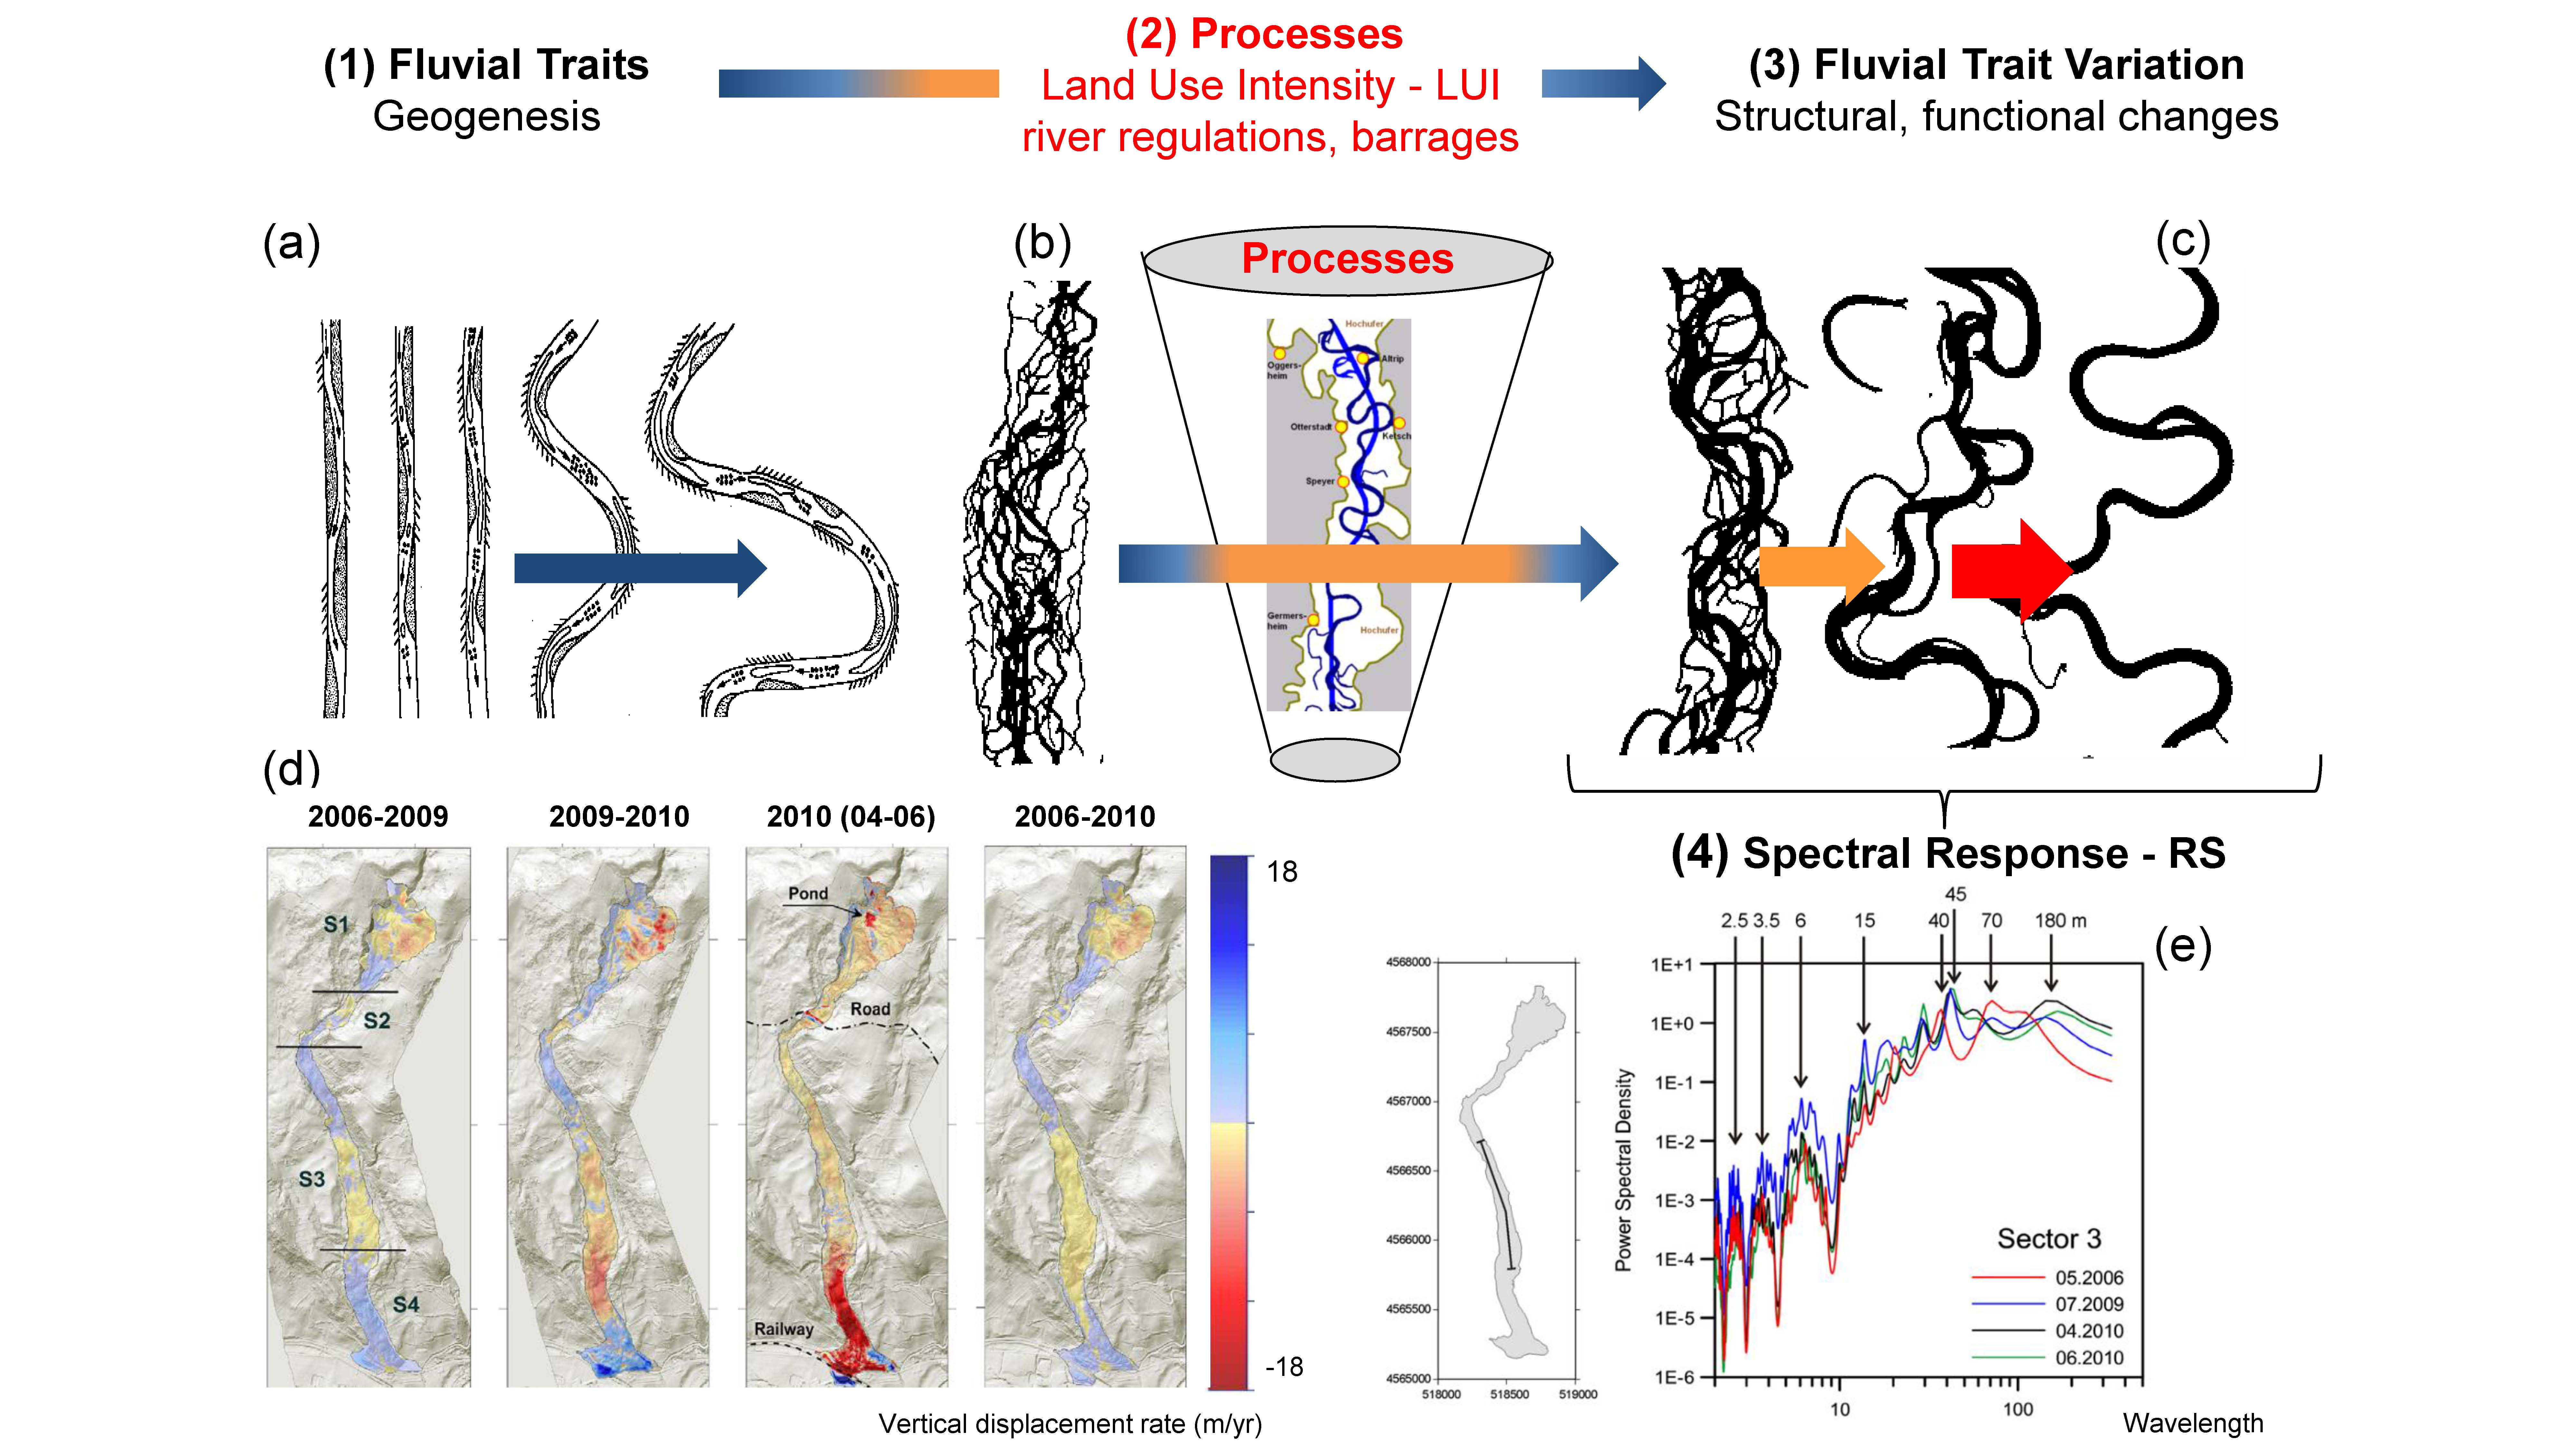
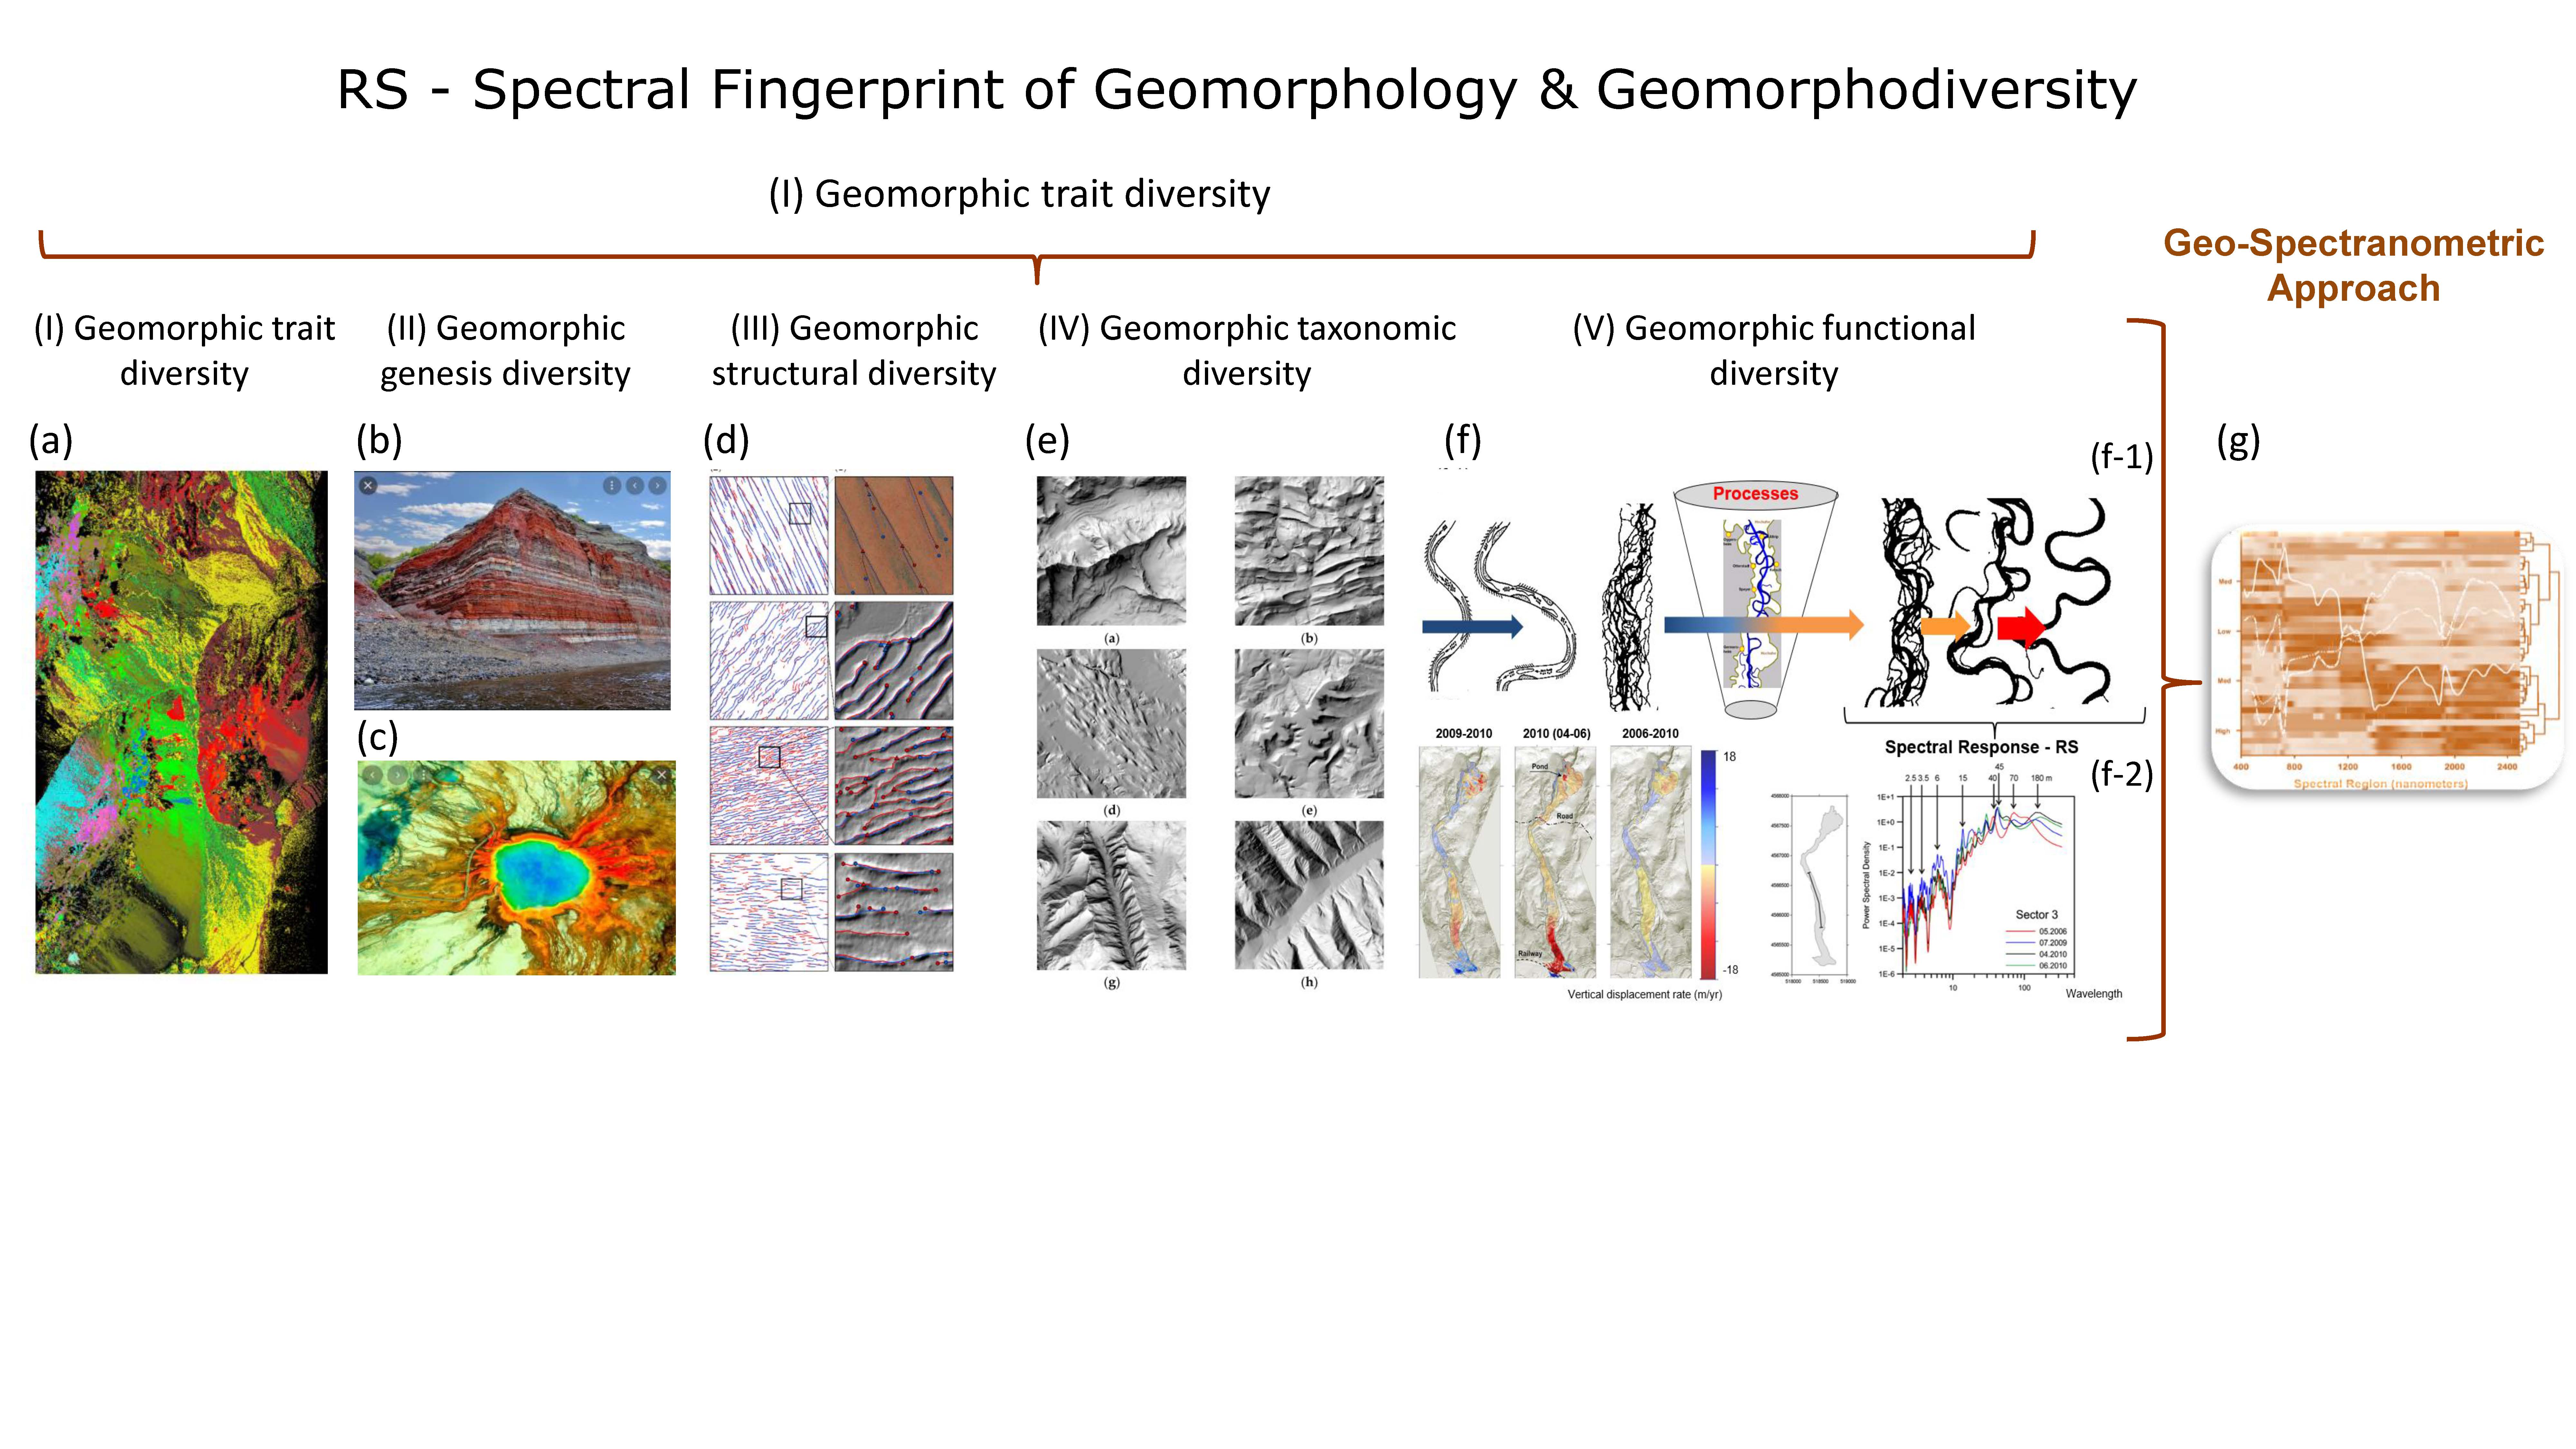 Figure 10. All five characteristics of geomorphodiversity can be recorded using RS technologies. The individual characteristics of geomorphodiversity are illustrated by means of examples, which are: (I) geomorphic trait diversity, (a) AVIRIS hyperspectral RS data was used to classify the mineral distribution and the geomorphic traits in the Cuprite area, Nevada (from Clark et al. [3]); (II) geomorphic genesis diversity, (b) photo of the characteristic relief forms created by the exogenous and endeogenous genesis processes genesis, (c) TIR image of part of th Siberian Trap supervolcano; (III) geomorphic structural diversity, (d) derivation of dune pattern mapping with RS (from Shumack et al. [4]); (IV) geomorphic taxonomic diversity, (e) classification of different mountain types using RS (from Farmakis-Serebryakova et al. [5]); (V) geomorphic functional diversity, (f-1) processes of geogenesis and river degradation lead to changes in morphometric river features, (f-2) the morphometric changes can be recorded using RS data, reprinted with permission from Ventura et al. [6], 2021, Elsevier. license number: 4856041399548; (g) The integration and combination of all five features form the basis of the geo-spectranometric approach and lead to the ‘spectral fingerprint of geomorphology and geomorphodiversity’. All features and individual figures are explained in detail in the following chapters.
3. Geomorphic Genesis Diversity Using RS
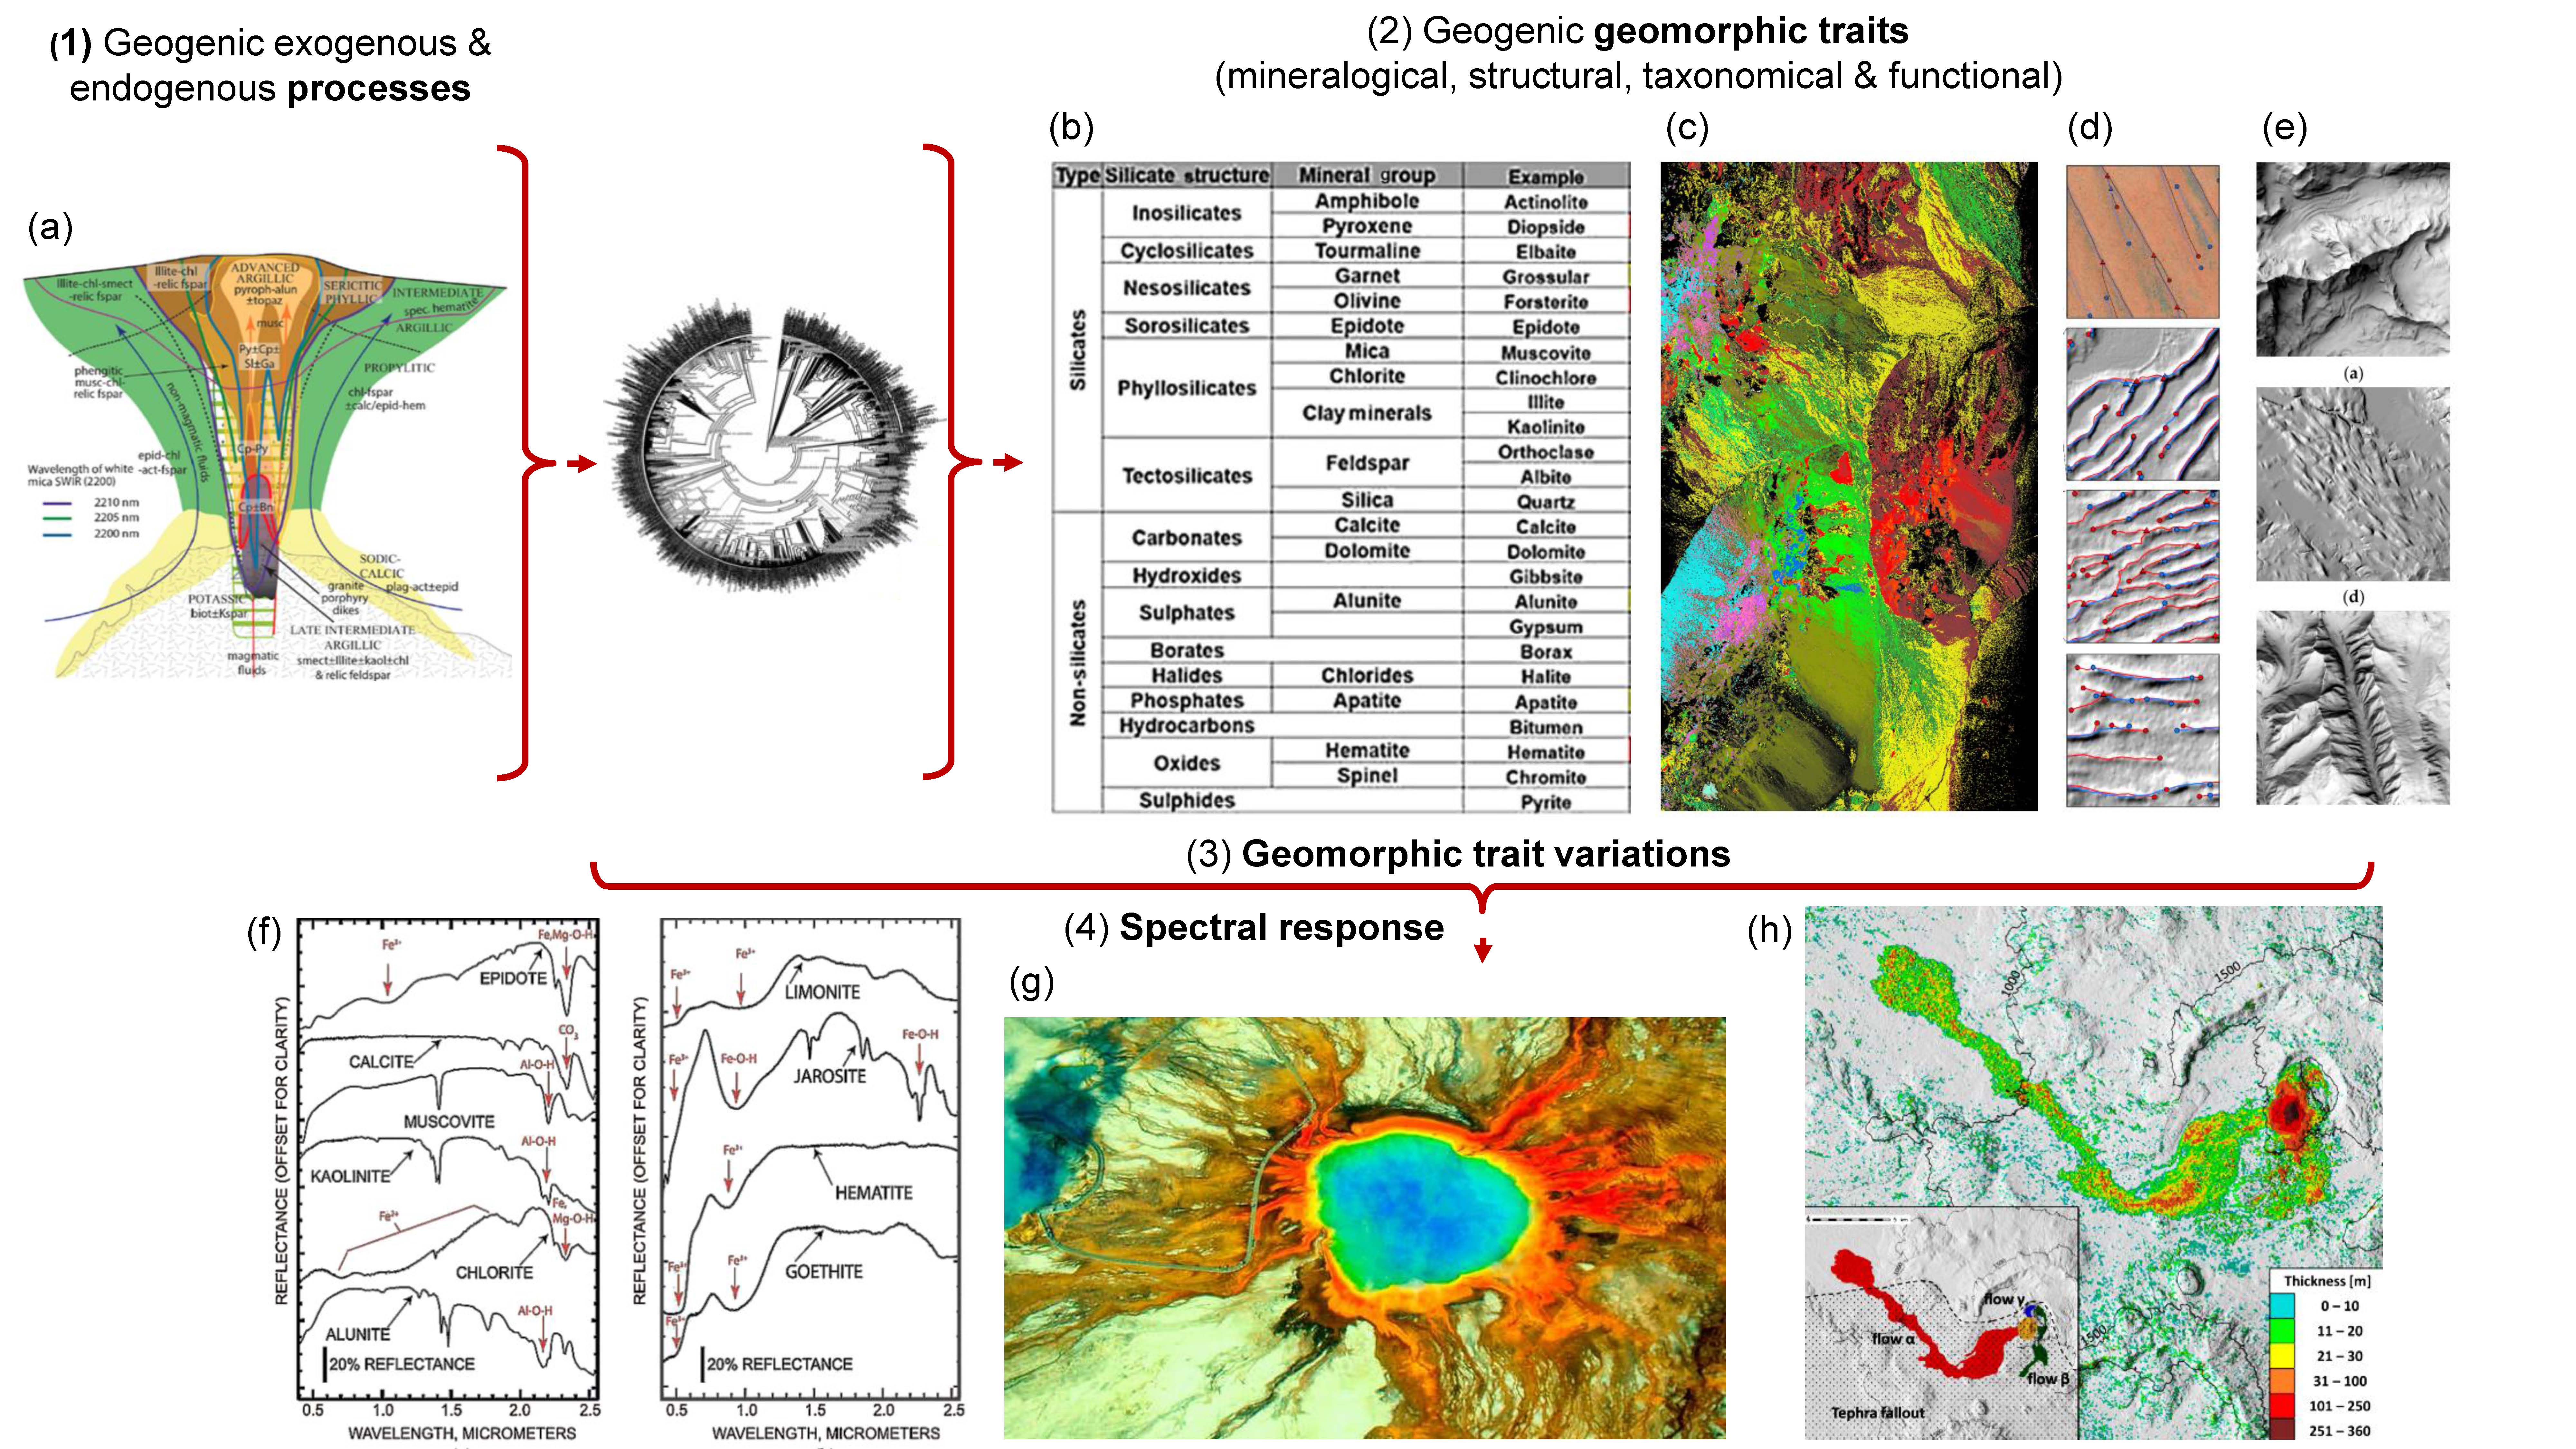 Figure 11. (1) Geogenic exogenous and endogenous processes, such as in such as a volcanic eruption (a) leads to characteristic geogenic geomorphic traits. (2) Geomorphic traits can be: mineralogical, structural, taxonomic and functional traits, such as: (b,c) different minerals, (d) different sturcural forms and form complexes, (e) different rock types. Consequently, the processes, e.g., volcanic eruptions lead to (3) geomorphic trait variations and the shaping of terrain and mountains. Geomorphic traits and trait variations produce a morphologogically specific (4) spectral response, which can be detected using different RS technologies. (f) Laboratory spectral features of different hydrothermal minerals and mapping results from RS analysis are crucial for mineral classification, (c) VNIR-AVIRIS hyperspectral data from the Cuprite area (Nevada) show results of lithography classification using hyperspectral RS data, (g) Representation of a volcanic eruption using RS of the Siberian Trap, (h) Distribution of volcanic deposits optained by differencing pre-eruptive and post-eruptive DEMs derived from ASTER and PlanetScope RS Data, location—Nabro volcano; Image sources: (a,b) from Peyghambari and Zhang [17], (c,f) from Clark et al. [3], (d) from Shumak et al., [4], (e) from Farmakis-Serebryakova et al. [5], (h) reprinted with permission from Calvari et al., [18], 2022, Elsevier. license number: 5303110916041.
4. Geomorphic Structural Diversity Using RS
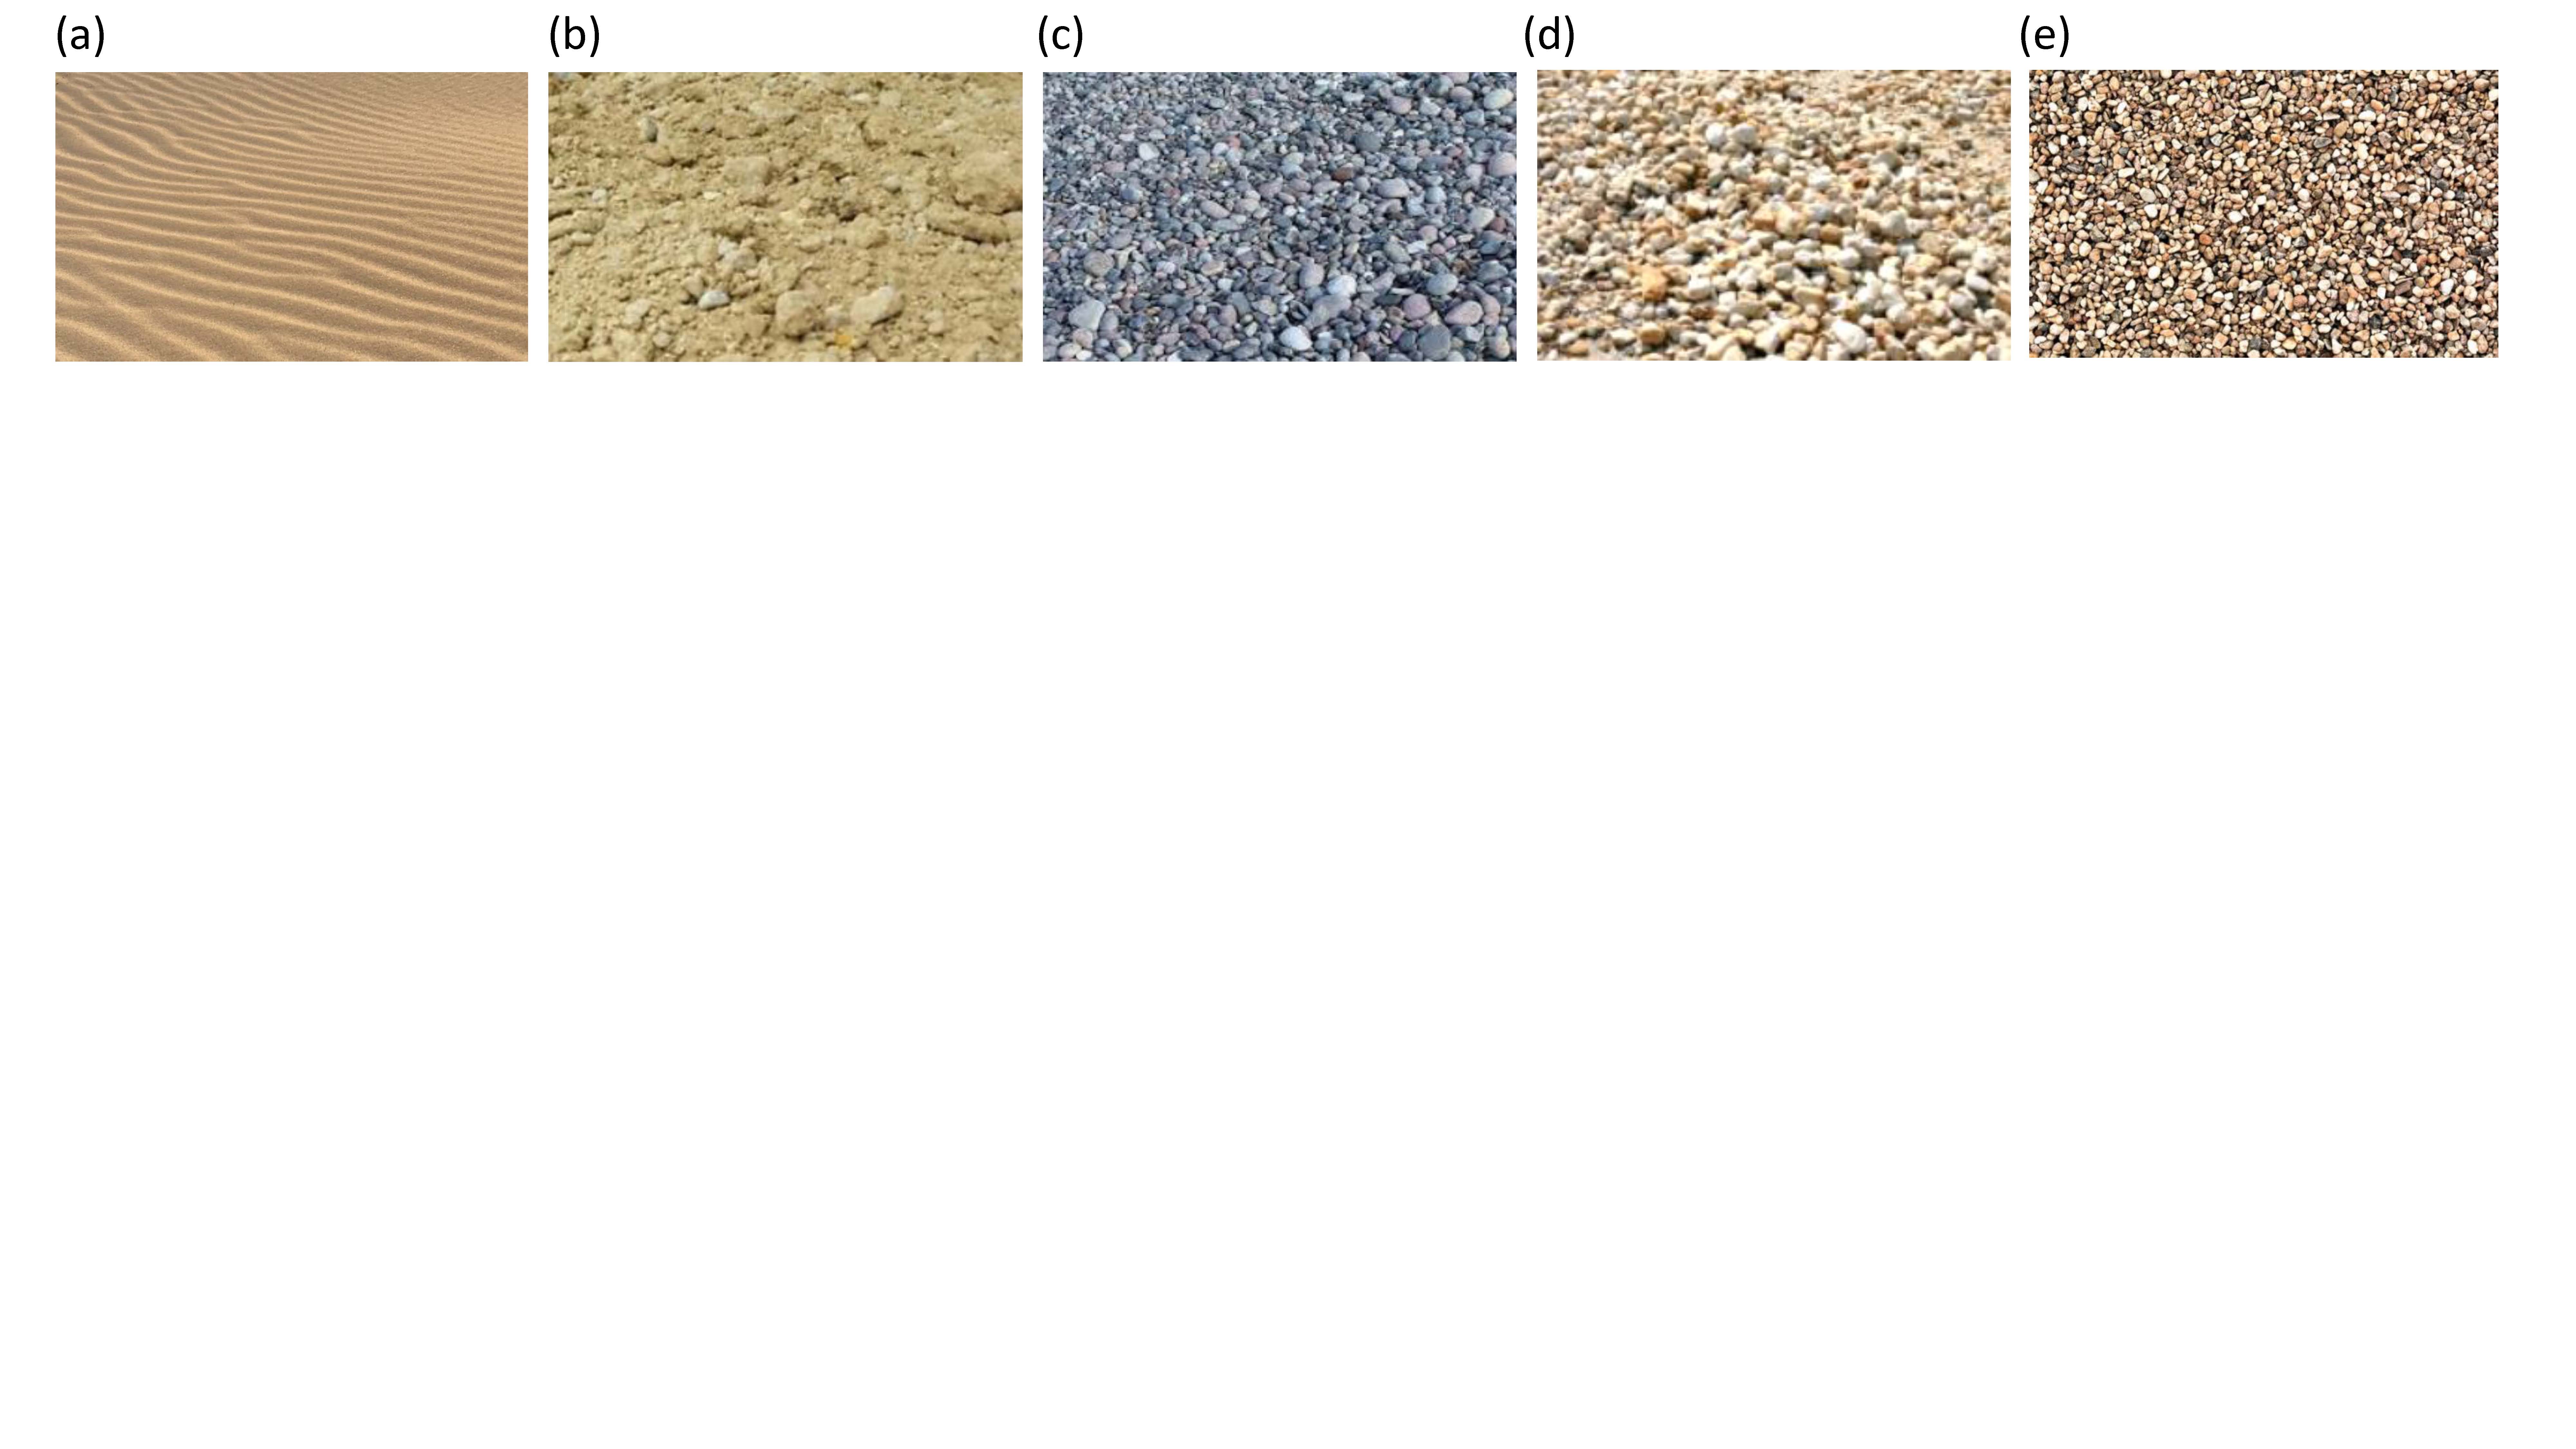 Figure 12. Geomorphic structural diversity, monitored with remote sensing technology. Examples of dune-field landscape patterns on remotely sensed data. (a) Barchan dunes, (b) linear dunes, (c) dome dunes, (d) reticulate dunes, and (e) longitudinal dunes (reprinted with permission from Zeng et al. [28], 2021, Elsevier. license no. 5176660806321).
5. Geomorphic Taxonomic Diversity Using RS
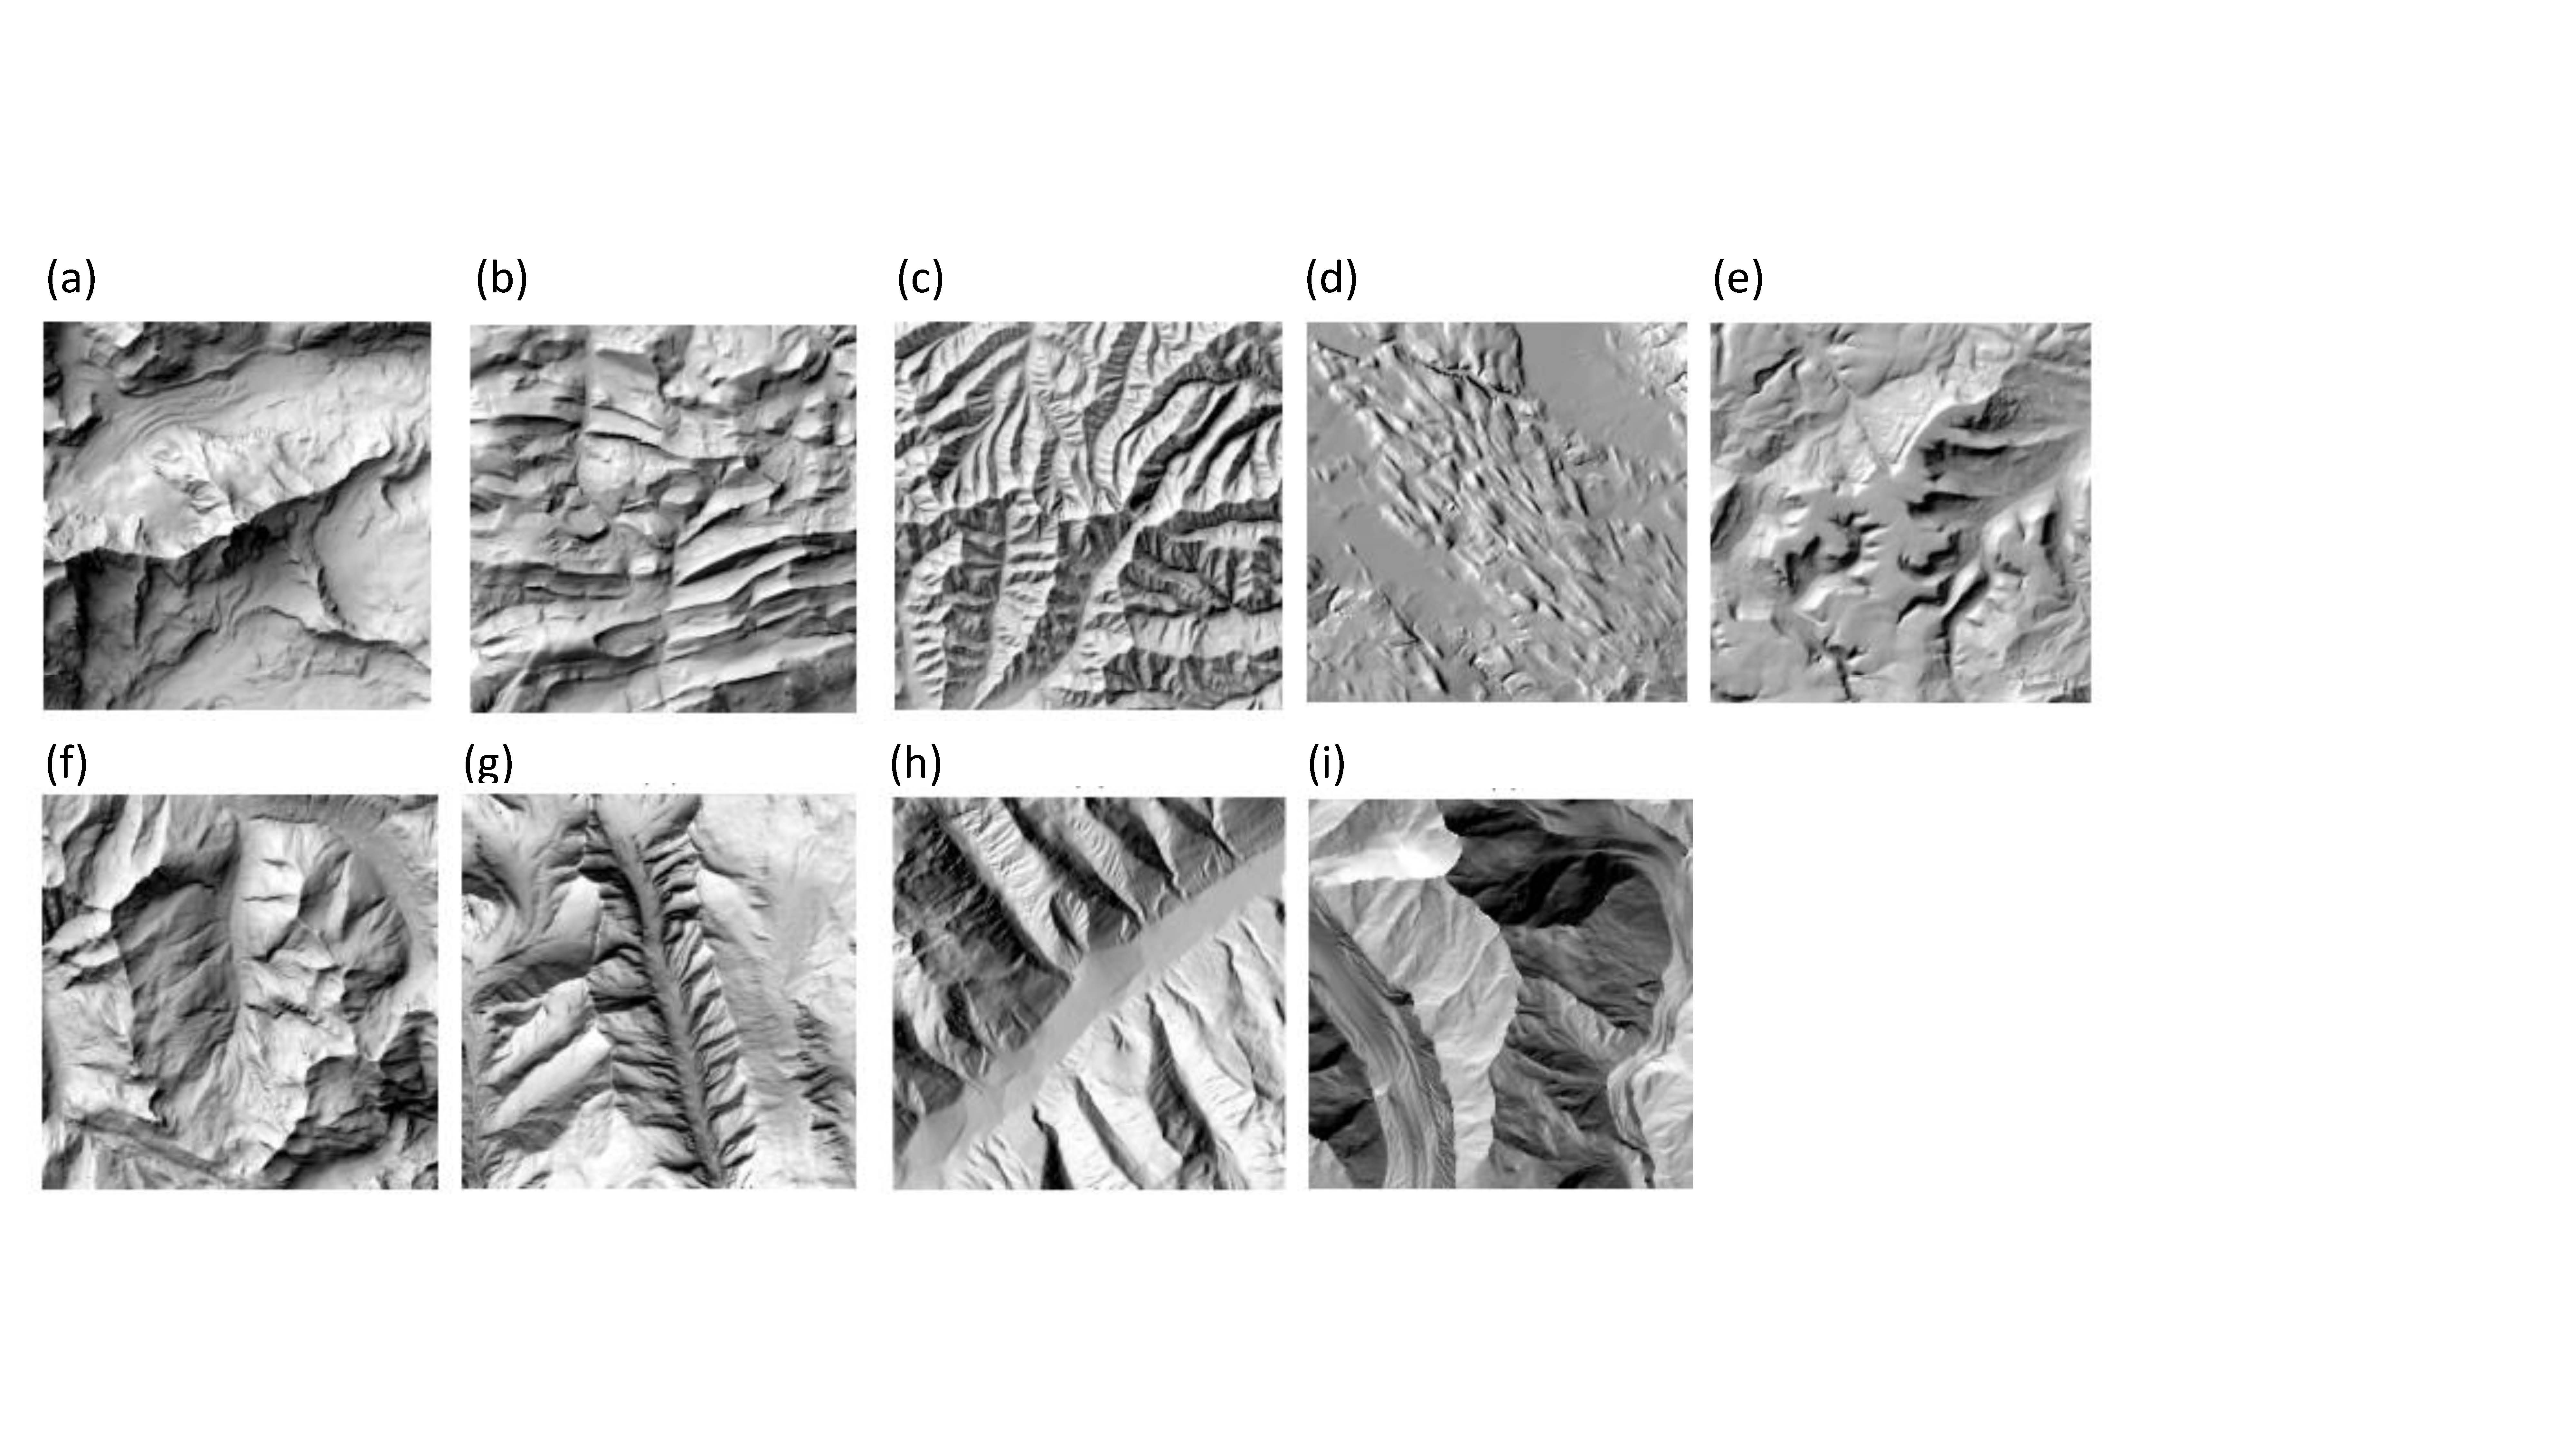 Figure 13. Geomorphic taxonomic diversity using RS. The most suitable relief shading methods per landform based on the survey results: the clear sky model method for (a) block mountains; (b) folded mountains; (c) mountains formed by erosion processes; (d) cluster shading for drumlins; (e) plateaus; and (f) V-shaped valleys; (g) clear sky model with custom illumination (here, S) for U-shaped valleys; (h) standard hill-shading with custom illumination (here, W) for alluvial fans; and (i) aspect shading for glaciers (from Farmakis-Serebryakova et al. [98]).
6. Geomorphic Functional Diversity Using RS
This entry is adapted from the peer-reviewed paper 10.3390/rs14092279
References
- Lausch, A.; Schaepman, M.E.; Skidmore, A.K.; Truckenbrodt, S.C.; Hacker, J.M.; Baade, J.; Bannehr, L.; Borg, E.; Bumberger, J.; Dietrich, P.; et al. Linking the Remote Sensing of Geodiversity and Traits Relevant to Biodiversity—Part II: Geomorphology, Terrain and Surfaces. Remote Sens. 2020, 12, 3690. [CrossRef]
- Lausch, A.; Baade, J.; Bannehr, L.; Borg, E.; Bumberger, J.; Chabrilliat, S.; Dietrich, P.; Gerighausen, H.; Glässer, C.; Hacker, J.; et al. Linking Remote Sensing and Geodiversity and Their Traits Relevant to Biodiversity—Part I: Soil Characteristics. Remote Sens. 2019, 11, 2356.
- Clark, R.N.; Swayze, G.A.; Livo, K.E.; Kokaly, R.F.; Sutley, S.J.; Dalton, J.B.; McDougal, R.R.; Gent, C.A. Imaging spectroscopy: Earth and planetary remote sensing with the USGS Tetracorder and expert systems. J. Geophys. Res. Planets 2003, 108, 5.
- Shumack, S.; Hesse, P.; Farebrother,W. Deep learning for dune pattern mapping with the AW3D30 global surface model. Earth Surf. Process. Landf. 2020, 45, 2417–2431.
- Farmakis-Serebryakova, M.; Hurni, L. Comparison of Relief Shading Techniques Applied to Landforms. ISPRS Int. J. Geo.-Inf. 2020, 9, 253.
- Ventura, G.; Vilardo, G.; Terranova, C.; Sessa, E.B. Tracking and evolution of complex active landslides by multi-temporal airborne LiDAR data: The Montaguto landslide (Southern Italy). Remote Sens. Environ. 2011, 115, 3237–3248.
- Dasgupta, S.; Mukherjee, S. Remote Sensing in Lineament Identification: Examples from Western India. In Problems and Solutions in Structural Geology and Tectonics; Elsevier Inc.: Amsterdam, The Netherlands, 2019; Volume 5, pp. 205–221. ISBN 9780128140482
- Dasgupta, S.; Mukherjee, S. Remote Sensing in Lineament Identification: Examples from Western India. In Problems and Solutions in Structural Geology and Tectonics; Elsevier Inc.: Amsterdam, The Netherlands, 2019; Volume 5, pp. 205–221. ISBN 9780128140482.
- Mather, T.A.; Schmidt, A. Environmental Effects of Volcanic Volatile Fluxes from Subaerial Large Igneous Provinces, 1st ed.; GeophysicalMonograph 255; Ernst, R.E., Dickson, A.J., Bekker, A., Eds.; Wiley Online Library: Hoboken, NJ, USA, 2021; ISBN 9781119507444.
- Dasgupta, S.; Mukherjee, S. Remote Sensing in Lineament Identification: Examples fromWestern India. J. Dev. Struct. Geol. Tecton. 2019, 15, 205–221.
- Prost, G.L. Remote Sensing for Geoscientists; T & F Group, Ed.; CRC Press: Boca Raton, FL, USA; London, UK; New York, NY, USA, 2013; ISBN 9781466561755.
- Gupta, R.P. Remote Sensing Geology; Springer: Berlin/Heidelberg, Germany, 2018; ISBN 978-3-662-55874-4.
- Lausch, A.; Bannehr, L.; Beckmann, M.; Boehm, C.; Feilhauer, H.; Hacker, J.M.; Heurich, M.; Jung, A.; Klenke, R.; Neumann, C.; et al. Linking Earth Observation and taxonomic, structural and functional biodiversity: Local to ecosystem perspectives. Ecol. Indic. 2016, 70, 317–339.
- Lausch, A.; Bastian, O.; Klotz, S.; Leitão, P.J.; Jung, A.; Rocchini, D.; Schaepman, M.E.; Skidmore, A.K.; Tischendorf, L.; Knapp, S. Understanding and assessing vegetation health by in situ species and remote-sensing approaches. Methods Ecol. Evol. 2018, 9, 1799–1809.
- Kulkarni, H. Delineation of shallow Deccan basaltic aquifers from Maharashtra using aerial photointerpretation. J. Indian Soc. Remote Sens. 1992, 20, 129–138.
- Kulkarni, H. Delineation of shallow Deccan basaltic aquifers from Maharashtra using aerial photointerpretation. J. Indian Soc. Remote Sens. 1992, 20, 129–138.
- Fisher, G.B.; Amos, C.B.; Bookhagen, B.; Burbank, D.W.; Godard, V. Channel widths, landslides, faults, and beyond: The new world order of high-spatial resolution Google Earth imagery in the study of earth surface processes. In Google Earth and Virtual Visualizations in Geoscience Education and Research; Geological Society of America: Boulder, CO, USA, 2012.
- Peyghambari, S.; Zhang, Y. Hyperspectral remote sensing in lithological mapping, mineral exploration, and environmental geology: An updated review. J. Appl. Remote Sens. 2021, 15, 031501.
- Calvari, S.; Ganci, G.; Victória, S.; Hernandez, P.; Perez, N.; Barrancos, J.; Alfama, V.; Dionis, S.; Cabral, J.; Cardoso, N.; et al. Satellite and Ground Remote Sensing Techniques to Trace the Hidden Growth of a Lava Flow Field: The 2014–2015 Effusive Eruption at Fogo Volcano (Cape Verde). Remote Sens. 2018, 10, 1115.
- Sofia, G. Combining geomorphometry, feature extraction techniques and Earth-surface processes research: The way forward. Geomorphology 2020, 355, 107055.
- Elosegi, A.; Díez, J.; Mutz, M. Effects of hydromorphological integrity on biodiversity and functioning of river ecosystems. Hydrobiologia 2010, 657, 199–215.
- Corenblit, D.; Baas, A.C.W.; Bornette, G.; Darrozes, J.; Delmotte, S.; Francis, R.A.; Gurnell, A.M.; Julien, F.; Naiman, R.J.; Steiger, J. Feedbacks between geomorphology and biota controlling Earth surface processes and landforms: A review of foundation concepts and current understandings. Earth-Sci. Rev. 2011, 106, 307–331.
- Stein, A.; Gerstner, K.; Kreft, H. Environmental heterogeneity as a universal driver of species richness across taxa, biomes and spatial scales. Ecol. Lett. 2014, 17, 866–880.
- Sukopp, H. Der Einfluss des Menschen auf die Vegetation. Veg. Acta Geobot. 1969, 17, 360–371.
- Lausch, A.; Blaschke, T.; Haase, D.; Herzog, F.; Syrbe, R.-U.; Tischendorf, L.; Walz, U. Understanding and quantifying landscape structure—A review on relevant process characteristics, data models and landscape metrics. Ecol. Modell. 2015, 295, 31–41.
- Tarolli, P.; Cao,W.; Sofia, G.; Evans, D.; Ellis, E.C. From features to fingerprints: A general diagnostic framework for anthropogenic geomorphology. Prog. Phys. Geogr. Earth Environ. 2019, 43, 95–128.
- Kulp, S.A.; Strauss, B.H. New elevation data triple estimates of global vulnerability to sea-level rise and coastal flooding. Nat. Commun. 2019, 10, 4844.
- Zheng, Z.; Du, S.; Du, S.; Zhang, X. A multiscale approach to delineate dune-field landscape patches. Remote Sens. Environ. 2020, 237, 111591.
- Brown, A.G.; Tooth, S.; Bullard, J.E.; Thomas, D.S.G.; Chiverrell, R.C.; Plater, A.J.; Murton, J.; Thorndycraft, V.R.; Tarolli, P.; Rose, J.; et al. The geomorphology of the Anthropocene: Emergence, status and implications. Earth Surf. Process. Landf. 2017, 42, 71–90.
- Le Provost, G.; Thiele, J.; Westphal, C.; Penone, C.; Allan, E.; Neyret, M.; van der Plas, F.; Ayasse, M.; Bardgett, R.D.; Birkhofer, K.; et al. Contrasting responses of above- and belowground diversity to multiple components of land-use intensity. Nat. Commun. 2021, 12, 3918.
- Mock, J. Auswirkungen des Hochwasserschutzes. In Eine Einführung in die Umweltwissenschaften; Böhm, H.R., Deneke, M., Eds.; Wissenschaftliche Buchgesellschaft: Darmstadt, Germany, 1992; pp. 176–196.
- Mock, J. Auswirkungen des Hochwasserschutzes. In Eine Einführung in die Umweltwissenschaften; Böhm, H.R., Deneke, M., Eds.; Wissenschaftliche Buchgesellschaft: Darmstadt, Germany, 1992; pp. 176–196.