Your browser does not fully support modern features. Please upgrade for a smoother experience.
Please note this is an old version of this entry, which may differ significantly from the current revision.
Monitoring water quality is an essential tool for the control of pollutants and pathogens that can cause damage to the environment and human health. However, water quality analysis is usually performed in laboratory environments, often with the use of high-cost equipment and qualified professionals. With the progress of nanotechnology and the advance in engineering materials, several studies have shown, in recent years, the development of technologies aimed at monitoring water quality, with the ability to reduce the costs of analysis and accelerate the achievement of results for management and decision-making.
- water quality
- in situ
- sensors
- green technology
1. Introduction
Water is an important natural resource for life on earth and for human activities and, therefore, it is necessary to have abundant clean water to quench thirst, irrigate fields, and sustain all forms of life in the environment [1]. Several sources contribute negatively to changing water quality, mainly caused by human action, such as population growth, industrialization, urbanization, agriculture, domestic sewage, and poor management [2][3]. To improve water quality, the 2030 Agenda for Sustainable Development established, as a goal for 2030, the availability and sustainable management of water and basic sanitation for all human beings, with the improvement of water quality, the reduction in pollution, and the elimination of dangerous pollutants [4].
Water quality monitoring allows the identification and quantification of polluting substances that can be compared to acceptable standards for each location, being a strategic management tool for decision-making and the improvement of water quality [5][6]. Tamm, Nõges, and Jävet [7], for example, monitored the load supply of dissolved organic carbon (DOC) to Lake Võrtsjärv (Estonia) between 1990 and 2002 by ground and surface flow—parameters affected by hydrological factors—highlighting the importance of assessing the parameter both currently and under changing climatic conditions. Unfortunately, there is still a large gap in water quality data, especially in remote locations and in developing countries [8], raising concerns about the sustainability of water resources and risks to human health. Furthermore, the main conventional techniques for monitoring water are often expensive, requiring qualified professionals and complex equipment, and which, in many circumstances, do not allow direct analysis in the field with immediate results.
However, several studies have tried to fill the gap and overcome the lack of data provision, such as the incorporation of citizen science [9][10], for example, or the development of low-cost and in situ technologies, as will be described throughout this work. The development of low-cost, accessible, and easy-to-handle devices and sensors for water quality analysis can be a viable alternative for obtaining data, improving water quality, and, consequently, the security of the water [11][12]. Furthermore, in situ measurement contributes to cost minimization, as it eliminates the need for sampling, sample preservation, transport, and laboratory water analysis [13].
The combination of technologies and water quality sensors with components of microsystems, associated with a software architecture and cloud computing (online), allows the development of a system in the conception of Smart Water Quality Monitoring Systems (SWQMS), from the point of view of the Internet of Things (IoT) [14][15][16]. In addition, integration with the Big Data system can improve the modeling of the water system, reducing model uncertainties and ensuring more information in the management of risk analysis [17][18]. Pehme et al. [19], for example, highlighted the necessity of an advanced understanding of landfill hydrological regime, by modeling tools and evaluating the risks to environmental and human health related to landfill geomorphology and hydrological balance.
According to Webb et al. [11] and Hoolohan et al. [20], digital technologies are seen as resilient, innovative, and efficient devices that can enhance the relationship between water and society, being a progression toward solving challenges in water systems and helping to mitigate social and environmental problems. An approach to water quality improvement, for example, is also the association of Real-Time Control systems (RTC) and Nature-Based Solutions (NBS) in urban drainage infrastructures, as described by Brasil et al. [21].
2. Water Monitoring Parameters
Although there are several parameters for monitoring water quality, only a few are used as key parameters in the monitoring, which can vary according to the location or the purpose of water use [22]. Regarding water use, according to Boyd [22] and Alley [23], when intended for human consumption, such as drinking, for example, the water must not have high concentrations of minerals, taste, or odor, and must be free of toxins or pathogenic organisms; for recreation, despite being unsuitable for consumption, the water must not present risks of contagion or diseases through direct contact; for the environment, the water must not contain pollutants that cause adverse effects on flora and fauna. Alam et al. [24], Rahman and Bakri [25], Mohamed et al. [26], and Rahmanian et al. [27], for example, present water quality monitoring studies whose monitoring parameters were established according to the needs of each location.
For monitoring water quality, Boyd [22], Alley [23], the World Health Organization [28], Spellman [29], Cotruvo [30], and Omer [31] present a variety of physical, chemical, and biological parameters for drinking water, superficial water (fresh and saltwater) and groundwater, the sources of pollutants, types of speciation, and the main analysis techniques. In this work, the following were considered as physical parameters: (i) color, (ii) temperature, and (iii) turbidity; and as chemicals: (iv) chlorine, (v) fluorine, (vi) phosphorus, (vii) metals, (viii) nitrogen, (ix) dissolved oxygen, (x) pH, and (xi) redox potential or ORP (Oxidation–Reduction Potential).
In biological monitoring, although it is possible to identify numerous pathogenic species in water, the methods of isolation and the enumeration of such microorganisms make this a complex and time-consuming task, making it impractical to monitor all microorganisms that may be present in water [32]. To solve this problem, the monitoring of biological contamination is conventionally carried out by the analysis of key microorganisms present in human and warm-blooded animal feces, (xii) total coliforms and Escherichia coli being the most-used parameters to assess the microbiological safety of drinking and surface water supplies [33][34].
The monitoring of (xiii) algae and cyanobacteria is also important, since in many aquatic ecosystems, including drinking water supplies, there is a proliferation of these microorganisms called Harmful Algal Blooms (HAB) [35]. As emerging contaminants, the occurrence of HAB depends on several environmental conditions, such as the presence of nutrients and water temperature, and it is responsible for producing a variety of toxins released into water, which are dangerous for public health [36][37][38].
Many of the parameters mentioned above make up the Water Quality Index (WQI), such as dissolved oxygen, total coliforms, pH, temperature, nitrogen, phosphorus, and turbidity [39]. The WQI appeared in 1960 (Horton Index), being a simple and concise tool that allows the expression of the quality of water bodies and their derivations, such as for recreation, irrigation, and public supply, for example [40][41]. Nowadays, there are different numbers of models developed by different international organizations and used for WQI calculation, such as the National Sanitation Foundation Water Quality Index (NSFWQI) and the Weighted Arithmetic Water Quality Index (WAWQI), for example [42].
3. Development of Technologies for Water Quality Monitoring
The main technologies under development are based on colorimetric techniques or electrochemical sensors to analyze drinking water, rivers, lakes, and salt water [16][43][44]. However, as will be presented later, there are also technologies and methodologies capable of simplifying and improving existing water monitoring techniques, reducing costs, integrating them with the IoT, and accelerating data acquisition, such as the use of automatic samplers and autonomous analyzers.
According to Alberti et al. [43], with the progress of nanotechnology and materials science, various sensors and biosensors based on nanomaterials, such as nanoparticles (NPs), quantum dots (QDs), carbon nanotubes and nanofibers (CNTs/CNFs), nanowires, and graphene, for example, were developed for monitoring the environment. Figure 1 shows the evolution of the number of publications per year in research related to the topic, considering the terms water quality, low-cost, in situ, real-time, online, and portable. It is possible to identify a significant growth in this topic since 2012, with about 641 works published in 2021.
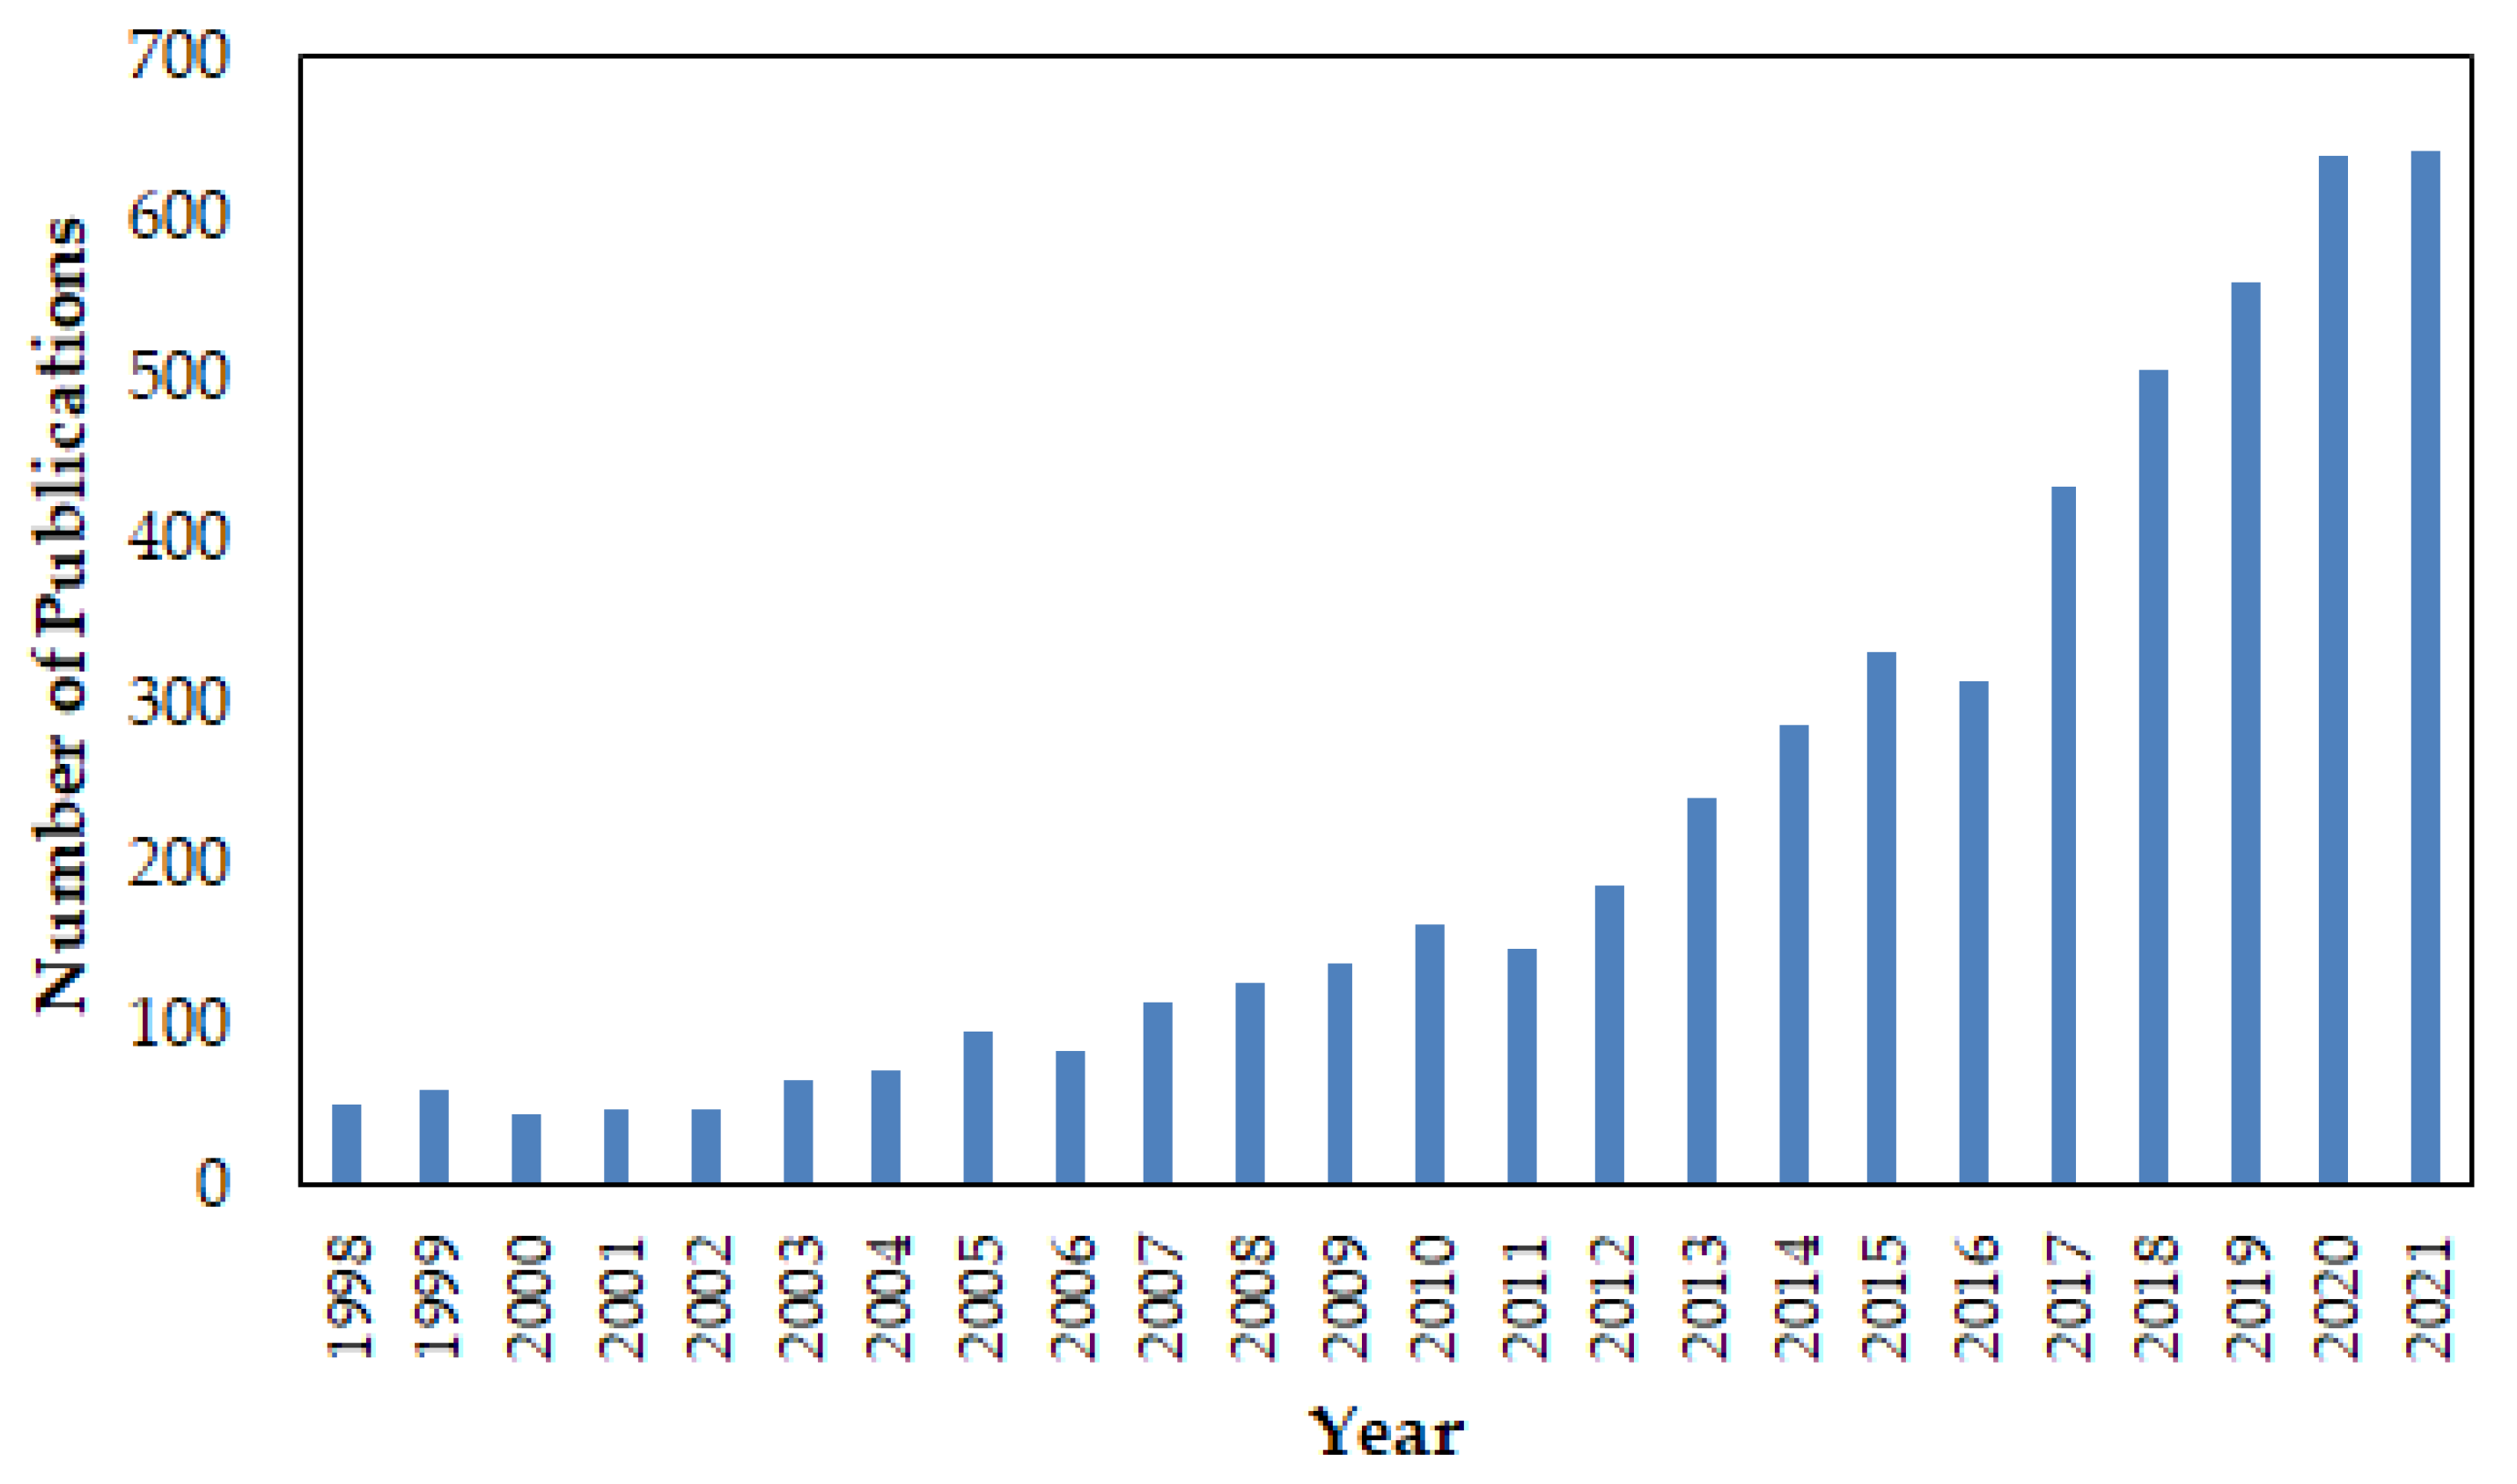
Figure 1. Evolution of the number of studies published per year related to the topic.
3.1. Technologies for Physical Monitoring of Water Quality
3.1.1. Color
The color of water refers to the reflection of light in tiny particles of organic or mineral origin, being an old indicator of water quality, even before technological development and the emergence of environmental sensors. However, when technology became part of the society’s configuration, there was research directed toward water color measurements, such as Edwards [45], for example, who developed a sensor to measure the color and turbidity of natural waters using a four-beam intensity compensation technique for robust measurement. This prototype was operated in a water treatment plant, and at the time, it was considered very visionary research. The development of new technologies for color measurement will be described below, as well as presented in Table 1.
With the evolution of optical physics, studies such as Murphy et al. [46] reported a low-cost optical sensor for water monitoring, in which the sensor is based on a multi-wavelength light source with two photodiode detectors capable of measuring the transmission and lateral scattering of light at the detector head, estimating the parameters of color and turbidity. The tests were carried out in the laboratory, but the researchers’ intention is to test the sensor in the future as a real-time water pollution monitoring system.
Given the importance of understanding the variation of color with other water quality parameters, Yang [47] developed a multisensory system for measuring water quality parameters (temperature, dissolved oxygen content, pH value, ammonia nitrogen, and color) for fish farming through algorithmically optimized sensors, in which the measurement of color parameters in the water is sent in real-time via the ZigBee communication standard [48]. Further, Saravanan et al. [49] also described a real-time IoT-based water quality monitoring system, which includes color as one of the parameters to be monitored in situ. In India, the real-time monitoring of water quality was integrated through an innovative alternative, as reported by George et al. [50], who described the initiative as a network of citizen scientists to monitor the color of water through Mini Secchi Disks, with Forel–Ule color scale stickers. This technique utilized a mobile app called “TurbAqua” to facilitate near real-time data transmission.
Table 1. Summary of studies that present new alternative technologies for monitoring the color parameter in water.
| Author(s) | Type | Description | Research Findings |
|---|---|---|---|
| Murphy et al. [46] | Optical | Developed a low-cost Optical Colorimetric Sensor (OCS), equipped with telecommunication to assess the transmission of light in water. | The results show strong linear correlations between the signal response and the studied parameters. |
| Yang [47] | Introduced a multi-sensory system to monitor water quality parameters in fish ponds, with Zigbee wireless interface communication. | The system was able to collect water quality parameters and transmit them to the central station host computer, being a tool for fishing pond production management. | |
| Saravanan et al. [49] | Proposed a low-cost system, called Supervisory Control and Data Acquisition (SCADA), to monitor various water quality parameters with remote communication (using a GSM module). | The device was able to measure the selected parameters in drinking water (including color) in real-time and with good accuracy. | |
| George et al. [50] | Developed Mini Secchi Disks, with Forel–Ule color scale stickers used to measure water color and clarity, and a mobile app, called TurbAqua, was developed to facilitate near real-time data transmission. | The study presents a low-cost method for monitoring water quality on a voluntary basis, where the data can be used to validate satellite water quality products and be a tool for decision-makers to improve water issues. |
3.1.2. Temperature
As with pH sensors, temperature sensors are present in most multi-parametric sensors. This is due, on the one hand, to the importance of temperature in relation to water quality; since several processes of other parameters occur as a function of temperature (e.g., biological activity, pH, dissolved oxygen, and conductivity), and, on the other hand, its easy monitoring, since there is a close linear relationship between temperature and resistivity, or electromotive force [51][52][53].
The measurement of water temperature can be performed by different methods, such as the thermal expansion of a material, thermoelectric processes, electrical resistance, semiconductors, optical fiber, and capacitance [54]. However, the most common low-cost temperature measurement process is the use of thermoelectric devices and/or resistive sensors. These techniques are mainly used for their accuracy, low cost for the operating temperature range required for water monitoring, robustness, and simplicity [55]. As most sensors and technologies show the temperature measurement combined with some technique, only a few articles reported in the literature will be described in order to present the different techniques applied in the delimitation of this article (real-time, in situ, and low cost), as described in Table 2 also.
The most-used method for measuring temperature is the resistive method. This is not only due to the ease of development of the sensors but also because thermoelectric sensors (specifically, thermocouples) often use resistive sensors to determine the standard temperature required for this technique [54]. Alam, Clyne, and Deen [56] used sensors based on the Wheatstone bridge configuration to obtain a high sensitivity temperature measurement with low variability between 0 and 50 °C. Two of the four bridge terminals were produced with P-type Silicon Wafers, with a high Temperature Coefficient Resistance (TCR)—the calculation of a relative change of resistance per degree of temperature change—and the other two were produced with polystyrene sulfonate (PEDOT:PSS), with negative TCR values. Alam et al. [57] developed a sensor using the same principles (Wheatstone bridges); however, it used two separate layers of a glass substrate using a bulk silicon wafer, poly(3,4-ethylenedioxythiophene), and PEDOT:PSS. The authors also integrated the sensor into an Arduino platform with an Android systems interface application.
Still related to resistive sensors, Wu et al. [55] developed a sensor for temperature measurement using a platinum (Pt) layer, since this material is a good conductor and has good characteristics for temperature measurement. Finally, another option for resistive temperature sensor measurement was presented by Simic et al. [58], using a low-cost and commercially available sensor (LM35). They performed a calibration of the device in the laboratory and obtained an accuracy of ±0.25 °C. Srivastava, Vaddadi, and Sadistap [59], aiming at a quick response of the temperature sensor and a low cost, used a K-type thermocouple. A K-type thermocouple is a thermocouple (a device that converts thermal energy into electrical energy) that uses a non-magnetic positive terminal (usually Chromel) and a magnetic negative terminal (usually Alumel) and performs the measurement based on the output voltage.
Finally, Huang [60] and Huang et al. [61] used optical fiber to measure the temperature. Despite being a method with a high cost, this technique is usually applied to temperature when the optical fiber is also used to measure other parameters. As the parameters monitored by the authors have high temperature sensitivity, two insulated fiber optic terminals were used. Thus, through the variation of the different central wavelengths, it was possible to find a linear relationship with the temperature, therefore calibrating the device.
Table 2. Summary of studies that present new alternative technologies for monitoring the temperature parameter in water.
| Author(s) | Type | Description | Research Findings |
|---|---|---|---|
| Alam, Clyne and Deen [56] | Electrical | Developed a temperature sensor fabricated with p-type Si and poly(3,4-ethylenedioxythiophene) polystyrene sulfonate (PEDOT:PSS) film in a Wheatstone bridge configuration. | The results show that the sensor was able to measure temperature between 0 and 50 °C with high sensitivity and low variability. |
| Alam et al. [57] | Presented a sensor-based using poly(3,4-ethylenedioxythiophene) and PEDOT:PSS to measure temperature in water. | The experiments present an accuracy above 85% for temperature sensor measurement. | |
| Wu et al. [55] | Developed a platinum (Pt)-based sensor for temperature measurement integrated into a micro-electro-mechanical system (MEMS). | The Pt thermistor with a three-wire orthogonal structure has a temperature response of 5.95 Ω/°C. | |
| Simic et al. [58] | Used a commercial sensor (LM35) to measure temperature in water. | The results show an accuracy of ±0.25 °C. | |
| Srivastava, Vaddadi and Sadistap [59] | Presented a K-type thermocouple sensor as a low-cost way to measure temperature integrated with a smartphone. | The system presents itself as a low-cost tool for monitoring water quality parameters in several urban locations. | |
| Huang [60] | Optical | A temperature sensor was developed using long-period fiber grating (LPFG). | The sensor can effectively monitor the temperature with a maximum difference of ±1 mm for water level, ±0.005 for refractive index, and 1 °C for temperature. |
| Huang et al. [61] |
3.1.3. Turbidity
The turbidity of water is a parameter that indicates the degree of interference that a light beam encounters when crossing it, mainly because of the presence of suspended solids such as inorganic particles and organic debris, which can give a murky appearance to that water [62]. Because of this, turbidity is a fundamental parameter to assess water quality, being able to identify whether the water is fit for consumption and, consequently, prevent waterborne diseases [63].
Given the importance of turbidity, there are several turbidity sensors, commercially available, that can be integrated into water quality monitoring systems, as used and described in much research, to develop IoT-based online monitoring combined with other water quality parameters. Some examples of these studies are presented by Geetha and Gouthami [16], Lambrou et al. [64], Samijayani et al. [65], and Chowdury et al. [66]. In addition, the following works present the development of new technologies applied to the monitoring of water turbidity, as shown in Table 3 also.
With the intention of optimizing, and reducing the costs associated with detecting turbidity, some recent research, such as Azman et al. [63], has developed low-cost technology based on a nephelometric turbidity sensor for the continuous monitoring of water quality. According to the authors, the electronic sensor’s operation is based on the intensity of scattered light in relation to light scattering in solids and liquids, using LED (Light Emitting Diode) as a transmitter, LDR (Light Dependent Resistor) as a receiver, and an RS232 module for communication between sensor and computer. Arifin et al. [67] researched the development of a sensor for water turbidity measurement using an infrared LED, a polymer optical fiber, and a photodetector as main materials, in which the experiments showed promising sensitivity results with 0.046 µW/NTU and 0.022 NTU resolution.
Wang et al. [68] also worked on a low-cost turbidity sensor and online water quality monitoring project, using an 850 nm infrared LED, dual orthogonal photodetectors, and, for communication, a custom IoT platform. The research showed that the device was able to measure the turbidity parameter with accuracy and robustness comparable to commercial sensors. Rahman et al. [69] also evaluated the performance of an LED-based sensor for water turbidity measurement, observing the response to different colors of light sources used for water turbidity measurement and determining the best photodetector according to the voltage variation during the ON/OFF condition. The authors showed that the white LED gives the best performance with less than 10% systematic error in most measurements and followed by the UV LED, but both lights were suitable for water turbidity measurements ranging from 0 to 1000 NTU. Finally, Schima et al. [70] developed an open-source optical sensor system for real-time and in situ turbidity monitoring, using detectors in the infrared range of the electromagnetic spectrum, which presented high accuracy when compared to standards methods in the laboratory. In addition, a Python script used on the Raspberry Pi was responsible for communication with the sensor, with which it was possible to show, even in the laboratory phase, that open-source technology can be a key to resilient and promising systems.
Table 3. Summary of studies that present new alternative technologies for monitoring the turbidity parameter in water.
| Author(s) | Type | Description | Research Findings |
|---|---|---|---|
| Azman et al. [63] | Optical | Presented a low-cost nephelometric turbidity sensor for the continuous monitoring of water quality and communication using the RS232 module. | The results show that the developed low-cost sensor presented results as a commercial turbidity sensor. |
| Arifin et al. [67] | Developed a polymer optical fiber sensor for measuring turbidity in water. | The experiments provided promising results, with 0.046 µW/NTU and 0.022 NTU resolution for the sensor. | |
| Wang et al. [68] | Presented a low-cost and online monitoring sensor for turbidity using an infrared LED and photodetectors. | The device was able to measure turbidity with high accuracy as a commercial device. | |
| Rahman et al. [69] | Evaluated the performance of an LED-based sensor for measuring turbidity in water. | The use of visible and UV LED was able to measure turbidity between 0 and 1000 NTU. | |
| Schima et al. [70] | Developed an open-source optical system for real-time and turbidity monitoring using detectors in the infrared range of the electromagnetic spectrum. | The developed in situ sensor system showed a very high agreement with the results obtained using a laboratory photometer but with less methodological effort. |
3.2. Technologies for Chemical Monitoring of Water Quality
3.2.1. Chlorine
Chlorine is one of the main disinfectants in public water supplies since its oxidizing characteristic can eliminate pathogenic microorganisms present in the water [71]. Therefore, detecting the concentration of free chlorine in the water is essential for monitoring and detecting the presence of contaminants. The consolidation of free chlorine sensors in water has taken place gradually, so that, even after many years have passed since the first attempts, many sensors are still under development and improvement. The development of new technologies for chlorine measurement will be described below, as well as presented in Table 4.
Table 4. Summary of studies that present new alternative technologies for monitoring the chlorine parameter in water.
| Author(s) | Type | Description | Research Findings |
|---|---|---|---|
| Cassidy et al. [72] | Optical | Developed a spectrophotometric device for chlorine detection in real-time using a xenon light source and a flow sample chamber. | Device performed well, but improvements are needed for field application. |
| Hall et al. [73] | Optical and Electrical | Assessed electrical and optical sensors for chlorine detection in water. | The sensors were able to determine chlorine with good accuracy, but more analysis is needed to improve the devices. |
| Gimenez-Gomez et al. [74] | Electrical | Presented a low-cost, compact portable multisensory electronic system to measure parameters of water quality. | The device presented good performance compared to commercial equipment, including free chlorine analysis. |
| Cui et al. [75] | Described the development of a microcontroller system, with wireless communication, to measure water quality parameters. | The device allowed online communication and the commercial residual chlorine sensor used (free chlorine and monochloramine) showed good results. | |
| Yen et al. [76] | Developed a low-cost chemo-resistive sensor based on nanohybrid paper to measure free chlorine ions. | The developed sensor showed a linear range of 0.1−500 ppm, and the limit of detection was 0.18 ppm. | |
| Alam et al. [77] | Proposed a reusable, reagent-free sensor based on a thin gold film for chlorine measurement. | The sensor showed high-sensitivity accuracy, like commercial sensors. |
Cassidy et al. [72], for example, studied a low-cost spectrophotometric sensor for chlorine detection with real-time data collection capability, aimed at increasing the acquisition time and improving the mechanical stability of chlorine sensors. The main components of this optical system were a xenon light source and a flow sample chamber. For communication, a DSP (Digital Signal Processor, EVM56303, produced by Motorola, Austin, TX, USA) board was used, which provides control signals and interacts with external devices. Overall, the device performed positively in the laboratory, but improvements are still pending for field applications and real-world scenarios.
Hall et al. [73] focused on the detection of parameters online to indicate contamination in the distribution system, using commercial sensors, including free chlorine sensors. Altogether, three sensors with different chlorine detection principles (colorimetric, polarographic, and voltammetric) were tested with costs ranging from US$3000 to US$10,000. The free chlorine was the best parameter, among the analyzed parameters, which responded to the presence of contaminants, but the authors point out that the technologies used were still in the consolidation phase and needed future improvements.
The quest to improve and reduce the costs of chlorine measurement was also presented by Gimenez-Gomez et al. [74], who proposed a compact portable device to simultaneously measure five water quality parameters, including amperometric parameters, using microelectronic technology with low power consumption. The electronic system was tested, and the analytical signals were compared with commercial equipment. In addition, the authors claim that the communication between the computer and the portable device can be carried out using a wireless protocol, such as a Wi-Fi or a low-power ZigBee interface.
To facilitate and modernize the detection of contaminants, Cui et al. [75] designed a Water Quality Monitoring System based on the STM32F103 microcontroller integrated system and the nRF24L01 wireless communication module. Various types of sensors were used to detect harmful components in the water, including the commercial residual chlorine sensor CLE3-DMT to detect free chlorine and monochloramine. The system’s proposal was to allow users to use their smartphones to carry out the real-time and online monitoring of various parameters in water quality. As the system has been successful in experiments, the authors believe that the device can be widely used with further research.
With the objective of facilitating portability, Yen et al. [76] also broke new ground in chlorine monitoring and presented a chemo-resistive sensor based on a nanohybrid paper that can be used with smartphones to detect free chlorine ions. The sensor was manufactured using a simple, standardized coating process on graphene paper and PEDOT:PSS, whose results presented a linear range of 0.1–500 ppm for free chlorine measurement, with a detection limit of 0.18 ppm. The sensor was integrated into an electrical reading system, using Arduino Uno Rev3 SM (Arduino, Genoa, Italy), designed for miniaturization and wireless transmission to a smartphone by a Bluetooth module. The authors emphasize that the system is advantageous for its portability, low cost, and allowing real-time readings on a smartphone.
Furthermore, the innovation of chlorine sensors is ongoing, as shown by Alam et al. [77], who developed a reusable, reagent-free sensor based on a thin gold film. The sensor presented high sensitivity, which is often a challenge for other commercial sensors, and due to simple fabrication and good detection performance, the proposed device enables mass production and future application in distant regions with low investment.
3.2.2. Dissolved Oxygen (OD)
Dissolved oxygen (DO) is an important parameter in water quality and essential for aquatic life. According to Hou et al. [78], when the DO concentration is less than 3 mg/L, there is an impact on the health of the fish, which can even lead to death by asphyxia. Furthermore, according to Hsu et al. [79], a low concentration of DO can negatively affect a water system by facilitating the excessive growth of anaerobic bacteria. The DO concentration can also indicate various contaminants in water bodies, making DO one of the most important parameters for monitoring.
There are two types of DO sensors: electrochemical and optical. Electrochemical DO sensors are based on the electrical current produced to measure the concentration of dissolved oxygen in water and can be polarographic or galvanic [80]. Optical DO sensors, also called luminescent DO sensors (LDO), measure the concentration of dissolved oxygen in water according to the extinction of luminescence in the presence of oxygen, being able to measure the intensity or lifetime of luminescence, since oxygen affects both [81].
Research to optimize DO measurement technologies is directed towards both electrochemical and optical sensors, however, DO electrochemical sensors are currently seen as more promising and are more widely used, mainly because they perform online in situ measurements [80]. The following works present the advances in technologies for DO measurement in water, as summarized in Table 5 also. Thus, in situ and online monitoring systems for aquaculture and other water uses have been using commercial dissolved oxygen sensors with electrochemical detection, as described by Liu [82], Luo et al. [83], Vijayakumar and Ramya [84], and He [85]. Liu [82] and He [85] were able to monitor OD and other water quality parameters (turbidity, pH, temperature, and electrical conductivity) for fishery management based on the IoT concept. From the same approach, Vijayakumar and Ramya [84] also were able to measure DO in water for aquaculture management using a Raspberry PI B+ core controller and an IoT module (USR WIFI 232). Finally, Luo et al. [83] used a commercial YCS-2000 dissolved oxygen sensor and Zigbee and GPRS modules to monitor water quality parameters in real-time at a low cost, including DO.
Table 5. Summary of studies that present new alternative technologies for monitoring the dissolved oxygen parameter in water.
| Author(s) | Type | Description | Research Findings |
|---|---|---|---|
| Liu [82] | Electrical | Designed an IoT system for monitoring the water quality environment for fishing in real-time. | The system was able to acquire DO, turbidity, pH, temperature, and electrical conductivity parameters in real-time, storing them in a database. |
| Luo et al. [83] | Developed a real-time monitoring system to measure DO in water using a YCS-2000 sensor. | The system could fulfill the real-time remote monitoring of aquaculture water quality and had great practical significance in the reduction in labor intensity. | |
| Vijayakumar and Ramya [84] | Present a low-cost system for real-time water quality monitoring (including DO) using a Raspberry PI B+ model. | The device was presented as a low-cost and real-time monitoring system, being capable of processing, analyzing, sending, and viewing the data in the cloud. | |
| He [85] | Designed and developed an embedded aquaculture intelligent water quality monitoring system based on STM32F103VET6. | The system could provide technical support for the design and development of an aquaculture monitoring system. | |
| Lee et al. [86] | Designed a DO sensor for in situ water quality analysis using a needle-like microelectrode arrangement (MEA). | The DO MEA exhibited a rapid 15 s linear response in the 0–9 mg/L (0–21% O2) range. | |
| Penso et al. [87] | Optical | Used a PDMS membrane coated with a platinum octaethylporphyrin (PtOEP) film to measure DO in water. | In a liquid medium, the sensor was able to measure DO in a range of 0–5.5 mg/L. |
| Mahoney et al. [88] | Optimized a multilayer optical-fluidic sensor for DO in situ measurement. | The results showed a comparable sensitivity and sensing range (0–20 ppm) compared to previously developed miniaturized DO sensors. |
The development of new technologies for DO sensors is ongoing, as presented, for example, by Lee et al. [86], who studied a new DO sensor for in situ water analysis with a needle-like microelectrode arrangement, obtained by microfabrication technologies, which aims to integrate sensors with IC (Integrated Circuit) chips for online data acquisition. Thus, the authors obtain a rapid 15 s linear response in the 0–9 mg/L (0–21% O2) range. Penso et al. [87] described the development, fabrication, and characterization of a low-cost, high-sensitivity optical sensor for DO detection with the potential for in situ measurement in a marine environment (between 0 and 5.5 mg/L) based on a PDMS membrane coated with a platinum octaethylporphyrin (PtOEP) film. Mahoney et al. [88] also innovated the optimization of a multilayer optical-fluidic sensor device based on the measurement of fluorescence suppression in a ruthenium-based oxygen-sensitive dye to obtain increased sensitivity in the in situ detection of DO in water between 0 and 20 ppm.
This entry is adapted from the peer-reviewed paper 10.3390/su14095059
References
- Vigil, K.M. Clean Water: An Introduction to Water Quality and Water Pollution Control, 2nd ed.; Oregon State University Press: Corvallis, OR, USA, 2003; Volume 1, ISBN 9780870718335.
- Owa, F.D. Water pollution: Sources, effects, control and management. Mediterr. J. Soc. Sci. 2013, 4, 65.
- Speight, J.G. Sources of Water Pollution. In Natural Water Remediation; Butterworth-Heinemann: Kidlington, UK, 2020.
- United Nations. Sustainable Development Goal 6-Synthesis Report on Water and Sanitation; United Nations: New York, NY, USA, 2018.
- Behmel, S.; Damour, M.; Ludwig, R.; Rodriguez, M.J. Water quality monitoring strategies—A review and future perspectives. Sci. Total Environ. 2016, 571, 1312–1329.
- Gallaher, S.; Heikkila, T. Challenges and Opportunities for Collecting and Sharing Data on Water Governance Institutions. J. Contemp. Water Res. Educ. 2014, 153, 66–78.
- Tamm, T.; Nõges, T.; Järvet, A.; Bouraoui, F. Contributions of DOC from Surface and Groundflow into Lake Võrtsjärv (Estonia). Hydrobiologia 2008, 599, 213–220.
- Eisenberg, J.N.S.; Bartram, J.; Wade, T.J. The water quality in rio highlights the global public health concern over untreated sewage. Environ. Health Perspect. 2016, 124, A180–A181.
- Hegarty, S.; Hayes, A.; Regan, F.; Bishop, I.; Clinton, R. Using citizen science to understand river water quality while filling data gaps to meet United Nations Sustainable Development Goal 6 objectives. Sci. Total Environ. 2021, 783, 146953.
- San Llorente Capdevila, A.; Kokimova, A.; Sinha Ray, S.; Avellán, T.; Kim, J.; Kirschke, S. Success factors for citizen science projects in water quality monitoring. Sci. Total Environ. 2020, 728, 137843.
- Sarni, W.; White, C.; Webb, R.; Cross, K.; Glotzbach, R. Digital Water: Industry Leaders Chart the Transformation Journey. International Water Association and Xylem Inc. 2019. Available online: https://iwa-network.org/publications/digital-water/ (accessed on 4 February 2022).
- Justino, C.I.L.; Duarte, A.C.; Rocha-Santos, T.A.P. Recent progress in biosensors for environmental monitoring: A review. Sensors 2017, 17, 2918.
- Crocker, J.; Bartram, J. Comparison and cost analysis of drinking water quality monitoring requirements versus practice in seven developing countries. Int. J. Environ. Res. Public Health 2014, 11, 7333–7346.
- Borgia, E. The internet of things vision: Key features, applications and open issues. Comput. Commun. 2014, 54, 1–31.
- Dong, J.; Wang, G.; Yan, H.; Xu, J.; Zhang, X. A survey of smart water quality monitoring system. Environ. Sci. Pollut. Res. 2015, 22, 4893–4906.
- Geetha, S.; Gouthami, S. Internet of things enabled real time water quality monitoring system. Smart Water 2016, 2, 1.
- Curl, J.M.; Nading, T.; Hegger, K.; Barhoumi, A.; Smoczynski, M. Digital Twins: The Next Generation of Water Treatment Technology. J. Am. Water Works Assoc. 2019, 111, 44–50.
- Shafiee, M.E.; Barker, Z.; Rasekh, A. Enhancing water system models by integrating big data. Sustain. Cities Soc. 2018, 37, 485–491.
- Pehme, K.M.; Burlakovs, J.; Kriipsalu, M.; Pilecka, J.; Grinfelde, I.; Tamm, T.; Jani, Y.; Hogland, W. Urban Hydrology Research Fundamentals for Waste Management Practices. In Proceedings of the Research for Rural Development 2019: Annual 25th International Scientific Conference Proceedings, Jelgava, Latvia, 15–17 May 2019; Volume 1.
- Hoolohan, C.; Amankwaa, G.; Browne, A.L.; Clear, A.; Holstead, K.; Machen, R.; Michalec, O.; Ward, S. Resocializing digital water transformations: Outlining social science perspectives on the digital water journey. Wiley Interdiscip. Rev. Water 2021, 8, e1512.
- Brasil, J.; Macedo, M.; Lago, C.; Oliveira, T.; Júnior, M.; Oliveira, T.; Mendiondo, E. Nature-based solutions and real-time control: Challenges and opportunities. Water 2021, 13, 651.
- Boyd, C.E. Water Quality an Introduction, 3rd ed.; Springer: Berlin/Heidelberg, Germany, 2020; ISBN 9783319705484.
- Alley, E.R. Water Quality Control Handbook, 2nd ed.; McGraw-Hill: New York, NY, USA, 2007; ISBN 0071508708.
- Alam, M.J.B.; Islam, M.R.; Muyen, Z.; Mamun, M.; Islam, S. Water quality parameters along rivers. Int. J. Environ. Sci. Technol. 2007, 4, 159–167.
- Rahman, A.; Bakri, D. Al A Study on Selected Water Quality Parameters along the River Buriganga, Bangladesh. Iran. J. Energy Environ. 2006, 1, 81–92.
- Mohamed, I.; Othman, F.; Ibrahim, A.I.N.; Alaa-Eldin, M.E.; Yunus, R.M. Assessment of water quality parameters using multivariate analysis for Klang River basin, Malaysia. Environ. Monit. Assess. 2015, 187, 4182.
- Rahmanian, N.; Ali, S.H.B.; Homayoonfard, M.; Ali, N.J.; Rehan, M.; Sadef, Y.; Nizami, A.S. Analysis of physiochemical parameters to evaluate the drinking water quality in the state of perak, Malaysia. J. Chem. 2015, 2015, 716125.
- World Health Organization. Guidelines for Drinking-Water Quality, 4th ed.; Library Cataloguing-in-Publication Data: Geneva, Switzerland, 2011; Volume 1.
- Spellman, F.R. The Drinking Water Handbook, 3rd ed.; CRC Press: Boca Raton, FL, USA, 2017.
- Cotruvo, J. Drinking Water Quality and Contaminants Guidebook; CRC Press: Boca Raton, FL, USA, 2018.
- Omer, N.H. Water Quality Parameters-Science, Assessments and Policy; Summers, K., Ed.; IntechOpen: London, UK, 2019.
- FAO. Fishery Harbour Manual on the Prevention of Pollution; FAO: Rome, Italy, 2014.
- Medema, G.J.; Payment, P.; Dufour, A.; Robertson, W.; Waite, M.; Hunter, P.; Kirby, R.; Andersson, Y. Safe drinking water: An ongoing challenge. In Assessing Microbial Safety of Drinking Water: Improving Approaches and Methods; IWA Publishing: London, UK, 2003; Volume 11.
- Zulkifli, S.N.; Rahim, H.A.; Lau, W.J. Detection of contaminants in water supply: A review on state-of-the-art monitoring technologies and their applications. Sens. Actuators B Chem. 2018, 255, 2657–2689.
- Hambrook Berkman, J.A.; Canova, M.G. Algal Biomass Indicators; USGS TWRI B. 9 Biol. Indic.; USGS: Washington, DC, USA, 2007.
- Pal, A.; He, Y.; Jekel, M.; Reinhard, M.; Gin, K.Y.H. Emerging contaminants of public health significance as water quality indicator compounds in the urban water cycle. Environ. Int. 2014, 71, 46–62.
- Wang, J.; Wu, J. Occurrence and potential risks of harmful algal blooms in the East China Sea. Sci. Total Environ. 2009, 407, 4012–4021.
- Schaap, A.; Rohrlack, T.; Bellouard, Y. Lab on a chip technologies for algae detection: A review. J. Biophotonics 2012, 5, 661–672.
- Uddin, M.G.; Nash, S.; Olbert, A.I. A review of water quality index models and their use for assessing surface water quality. Ecol. Indic. 2021, 122, 107218.
- Lumb, A.; Sharma, T.C.; Bibeault, J.-F. A Review of Genesis and Evolution of Water Quality Index (WQI) and Some Future Directions. Water Qual. Expo. Health 2011, 3, 11–24.
- Kachroud, M.; Trolard, F.; Kefi, M.; Jebari, S.; Bourrié, G. Water quality indices: Challenges and application limits in the literature. Water 2019, 11, 361.
- Tyagi, S.; Sharma, B.; Singh, P.; Dobhal, R. Water Quality Assessment in Terms of Water Quality Index. Am. J. Water Resour. 2020, 1, 3.
- Alberti, G.; Zanoni, C.; Magnaghi, L.R.; Biesuz, R. Disposable and low-cost colorimetric sensors for environmental analysis. Int. J. Environ. Res. Public Health 2020, 17, 8331.
- Rainbow, J.; Sedlackova, E.; Jiang, S.; Maxted, G.; Moschou, D.; Richtera, L.; Estrela, P. Integrated electrochemical biosensors for detection of waterborne pathogens in low-resource settings. Biosensors 2020, 10, 36.
- Edwards, H.O. An instrument for the measurement of colour and turbidity in natural waters. Water Sci. Technol. 1998, 37, 263–267.
- Murphy, K.; Heery, B.; Sullivan, T.; Zhang, D.; Paludetti, L.; Lau, K.T.; Diamond, D.; Costa, E.; O’Connor, N.; Regan, F. A low-cost autonomous optical sensor for water quality monitoring. Talanta 2015, 132, 520–527.
- Yang, Y. Water Quality Monitoring and Control for Fish Pond Based on Wireless Sensor Network. In Proceedings of the Automation, Mechanical and Electrical Engineering, Beijing, China, 19–20 August 2014; Volume 1.
- Haque, H.; Labeeb, K.; Riha, R.B.; Khan, M.N.R. IoT Based Water Quality Monitoring System by Using Zigbee Protocol. In Proceedings of the 2021 International Conference on Emerging Smart Computing and Informatics (ESCI), Pune, India, 5–7 March 2021.
- Saravanan, K.; Anusuya, E.; Kumar, R.; Son, L.H. Real-time water quality monitoring using Internet of Things in SCADA. Environ. Monit. Assess. 2018, 190, 556.
- George, G.; Menon, N.N.; Abdulaziz, A.; Brewin, R.J.W.; Pranav, P.; Gopalakrishnan, A.; Mini, K.G.; Kuriakose, S.; Sathyendranath, S.; Platt, T. Citizen Scientists Contribute to Real-Time Monitoring of Lake Water Quality Using 3D Printed Mini Secchi Disks. Front. Water 2021, 3, 662142.
- Martínez-Máñez, R.; Soto, J.; García-Breijo, E.; Gil, L.; Ibáñez, J.; Gadea, E. A multisensor in thick-film technology for water quality control. Sens. Actuators A Phys. 2005, 120, 589–595.
- Qin, Y.; Kwon, H.J.; Howlader, M.M.R.; Deen, M.J. Microfabricated electrochemical pH and free chlorine sensors for water quality monitoring: Recent advances and research challenges. RSC Adv. 2015, 5, 69086–69109.
- Zhou, B.; Bian, C.; Tong, J.; Xia, S. Fabrication of a miniature multi-parameter sensor chip for water quality assessment. Sensors 2017, 17, 157.
- Childs, P.R.N.; Greenwood, J.R.; Long, C.A. Review of temperature measurement. Rev. Sci. Instrum. 2000, 71, 2959–2978.
- Wu, Z.; Wang, J.; Bian, C.; Tong, J.; Xia, S. A MEMS-based multi-parameter integrated chip and its portable system forwater quality detection. Micromachines 2020, 11, 63.
- Alam, A.U.; Clyne, D.; Deen, M.J. A low-cost multi-parameter water quality monitoring system. Sensors 2021, 21, 3775.
- Alam, A.U.; Clyne, D.; Jin, H.; Hu, N.X.; Deen, M.J. Fully Integrated, Simple, and Low-Cost Electrochemical Sensor Array for in Situ Water Quality Monitoring. ACS Sens. 2020, 5, 412–422.
- Simic, M.; Stojanovic, G.M.; Manjakkal, L.; Zaraska, K. Multi-Sensor System for Remote Environmental (Air and Water) Quality Monitoring. In Proceedings of the 24th Telecommunications Forum, TELFOR 2016, Belgrade, Serbia, 22–23 November 2016.
- Srivastava, S.; Vaddadi, S.; Sadistap, S. Smartphone-based System for water quality analysis. Appl. Water Sci. 2018, 8, 130.
- Huang, Y. Fiber Optic Sensing System for in-Situ Simultaneous Monitoring of Water Stage, Quality, and Temperature. In Proceedings of the Sensors and Smart Structures Technologies for Civil, Mechanical, and Aerospace Systems, San Diego, CA, USA, 9–13 March 2014; Lynch, J.P., Wang, K.-W., Sohn, H., Eds.; SPIE: San Diego, CA, USA, 2014; Volume 9061.
- Huang, Y.; Chen, B.; Chen, G.; Xiao, H.; Khan, S.U. Simultaneous detection of liquid level and refractive index with a long-period fiber grating based sensor device. Meas. Sci. Technol. 2013, 24, 095303.
- Von Sperling, M. Introdução à Qualidade das Águas e ao Tratamento de Esgotos, 4th ed.; Departamento de Engenharia Sanitária e Ambiental (DESA), Universidade Federal de Minas Gerais (UFMG): Belo Horizonte, Brazil, 2014; ISBN 9788570411143.
- Azman, A.A.; Rahiman, M.H.F.; Taib, M.N.; Sidek, N.H.; Abu Bakar, I.A.; Ali, M.F. A Low Cost Nephelometric Turbidity Sensor for Continual Domestic Water Quality Monitoring System. In Proceedings of the 2016 IEEE International Conference on Automatic Control and Intelligent Systems, I2CACIS 2016, Selangor, Malaysia, 22 October 2016.
- Lambrou, T.P.; Anastasiou, C.C.; Panayiotou, C.G.; Polycarpou, M.M. A low-cost sensor network for real-time monitoring and contamination detection in drinking water distribution systems. IEEE Sens. J. 2014, 14, 2765–2772.
- Samijayani, O.N.; Sulistya, F.G.; Wulansari, M.T.; Mujadin, A.; Rahmatia, S. Wireless sensor network for pH and turbidity of river water monitoring. AIP Conf. Proc. 2018, 2043, 020019.
- Chowdury, M.S.U.; Emran, T.B.i.n.; Ghosh, S.; Pathak, A.; Alam, M.M.; Absar, N.; Andersson, K.; Hossain, M.S. IoT based real-time river water quality monitoring system. Procedia Comput. Sci. 2019, 155, 161–168.
- Arifin, A.; Irwan, I.; Abdullah, B.; Tahir, D. Design of Sensor Water Turbidity Based on Polymer Optical Fiber. In Proceedings of the 2017 International Seminar on Sensor, Instrumentation, Measurement and Metrology: Innovation for the Advancement and Competitiveness of the Nation, ISSIMM 2017, Surabaya, Indonesia, 25–26 August 2017; Volume 2017.
- Wang, Y.; Rajib, S.M.S.M.; Collins, C.; Grieve, B. Low-Cost Turbidity Sensor for Low-Power Wireless Monitoring of Fresh-Water Courses. IEEE Sens. J. 2018, 18, 4689–4696.
- Abd Rahman, M.F.; Samah, A.H.A.; Ahmad, K.A.; Boudville, R.; Yahaya, S.Z. Performance Evaluation of LED Based Sensor for Water Turbidity Measurement. In Proceedings of the International Conference on Sensing Technology, ICST, Sydney, Australia, 2–4 December 2019; Volume 2018.
- Schima, R.; Krüger, S.; Bumberger, J.; Paschen, M.; Dietrich, P.; Goblirsch, T. Mobile monitoring—open-source based optical sensor system for service-oriented turbidity and dissolved organic matter monitoring. Front. Earth Sci. 2019, 7, 184.
- Di Bernardo, L.; Dantas, Â.D.B. Métodos e técnicas de tratamento de água. Eng. Sanit. Ambient. 2006, 11, 107.
- Cassidy, C.S.; Matthews, L.R.; Church, K.H.; Taylor, R.M.; Teague, K.A. In Situ Chlorine Detection by Ultraviolet Absorption Spectroscopy. In Proceedings of the Midwest Symposium on Circuits and Systems, Tulsa, OK, USA, 4–7 August 2002; Volume 2.
- Hall, J.; Zaffiro, A.D.; Marx, R.B.; Kefauver, P.C.; Radha Krishnan, E.; Haught, R.C.; Herrmann, J.G. On-line water quality parameters as indicators of distribution system contamination. J. Am. Water Work. Assoc. 2007, 99, 66–77.
- Gimenez-Gomez, P.; Escude-Pujol, R.; Jimenez-Jorquera, C.; Gutierrez-Capitan, M. Multisensor Portable Meter for Environmental Applications. IEEE Sens. J. 2015, 15, 6517–6523.
- Cui, L.; Qiu, M.; Fan, H.; Wang, L.; Zhao, S.; Du, J. Design and Research of Water Quality Monitoring System Based on nRF24L01 Wireless Communication. Proc. IOP Conf. Ser. Earth Environ. Sci. 2018, 208, 012074.
- Yen, Y.K.; Lee, K.Y.; Lin, C.Y.; Zhang, S.T.; Wang, C.W.; Liu, T.Y. Portable Nanohybrid Paper-Based Chemiresistive Sensor for Free Chlorine Detection. ACS Omega 2020, 5, 25209–25215.
- Alam, A.U.; Clyne, D.; Lush, W.; Deen, M.J. A reusable, reagent-less free chlorine sensor using gold thin film electrode. Analyst 2021, 146, 2626–2631.
- Hou, Z.S.; Wen, H.S.; Li, J.F.; He, F.; Li, Y.; Qi, X. Environmental hypoxia causes growth retardation, osteoclast differentiation and calcium dyshomeostasis in juvenile rainbow trout (Oncorhynchus mykiss). Sci. Total Environ. 2020, 705, 135272.
- Hsu, L.; Selvaganapathy, P.R.; Brash, J.; Fang, Q.; Xu, C.Q.; Deen, M.J.; Chen, H. Development of a low-cost hemin-based dissolved oxygen sensor with anti-biofouling coating for water monitoring. IEEE Sens. J. 2014, 14, 3400–3407.
- Wei, Y.; Jiao, Y.; An, D.; Li, D.; Li, W.; Wei, Q. Review of dissolved oxygen detection technology: From laboratory analysis to online intelligent detection. Sensors 2019, 19, 3995.
- Wang, Q.; Zhang, J.M.; Li, S. Minreview: Recent advances in the development of gaseous and dissolved oxygen sensors. Instrum. Sci. Technol. 2019, 47, 19–50.
- Liu, S. Design for Fishery Water Environment Monitoring System Based on IOT. In Proceedings of the 2nd International Conference on Electronics, Network and Computer Engineering (ICENCE 2016), Yinchuan, China, 13–14 August 2016.
- Luo, H.P.; Li, G.L.; Peng, W.F.; Song, J.; Bai, Q.W. Real-time remote monitoring system for aquaculture water quality. Int. J. Agric. Biol. Eng. 2015, 8, 136–143.
- Vijayakumar, N.; Ramya, R. The Real Time Monitoring of Water Quality in IoT Environment. In Proceedings of the ICIIECS 2015—2015 IEEE International Conference on Innovations in Information, Embedded and Communication Systems, Coimbatore, India, 19–20 March 2015.
- He, Y. Design of Water Quality Monitoring Platform Based on Embedded System. IOP Conf. Ser. Earth Environ. Sci. 2021, 631, 012020.
- Lee, J.H.; Lim, T.S.; Seo, Y.; Bishop, P.L.; Papautsky, I. Needle-type dissolved oxygen microelectrode array sensors for in situ measurements. Sens. Actuators B Chem. 2007, 128, 179–185.
- Penso, C.M.; Rocha, J.L.; Martins, M.S.; Sousa, P.J.; Pinto, V.C.; Minas, G.; Silva, M.M.; Goncalves, L.M. PtOEP–PDMS-based optical oxygen sensor. Sensors 2021, 21, 5645.
- Mahoney, E.J.; Hsu, H.H.L.; Du, F.; Xiong, B.; Selvaganapathy, P.R.; Fang, Q. Optofluidic Dissolved Oxygen Sensing with Sensitivity Enhancement Through Multiple Reflections. IEEE Sens. J. 2019, 19, 10452–10460.
This entry is offline, you can click here to edit this entry!