Your browser does not fully support modern features. Please upgrade for a smoother experience.
Please note this is an old version of this entry, which may differ significantly from the current revision.
Water quality monitoring is an essential component of water quality management for water utilities for managing the drinking water supply. Online UV-Vis spectrophotometers are becoming popular choices for online water quality monitoring and process control, as they are reagent free, do not require sample pre-treatments and can provide continuous measurements. The advantages of the online UV-Vis sensors are that they can capture events and allow quicker responses to water quality changes compared to conventional water quality monitoring.
- online UV-Vis spectrophotometer
- real-time measurement
- online water quality monitoring
- drinking water
1. Introduction
Drinking water quality is a key performance indicator for water utilities, and it is important for public health. Water utilities are committed to drinking-water quality management to ensure that the supplied water meets the drinking-water standards. Water quality management systems have been developed by water utilities to manage the water supply from catchment to tap, covering source water, water treatment and the distribution system for the safe supply of drinking water. Most drinking water quality management systems have followed the World Health Organization drinking water quality guidelines, with individual countries developing their own to manage their local situations. Water quality monitoring and treatment are two vital aspects of water quality management systems to detect hazards and events that can compromise water quality and provide operational control for assuring safe and reliable drinking water as preventive measures.
Water quality monitoring is needed to ensure the supplied water to the consumers meets the standards. Conventionally, water quality monitoring for drinking-water treatment relies on a regular sampling program (collection and transportation, followed by laboratory analysis), which often only captures small snapshots over a period of time and may not represent the true variances of water quality. It also frequently suffers from feedback delay and is unable to provide a rapid response to water incidents [1], as water analysis using standard laboratory methods often requires a longer processing time, such as sample pre-treatment or adding reagents. There is also a higher risk that the conventional monitoring method may miss water events that could lead to negative impacts on water quality and treatment process management. In contrast, online monitoring measures water quality continuously, which allows real-time water quality measurements and process control [2]. In summary, online water quality monitoring can improve the treatment process with the real-time assessment of both source and treated water quality, identification of contaminants and control of treatment process [3]. It is also useful during the period of rapid water quality changes when quick responses are needed to optimise the process [4].
There are many well-established online water quality sensors, including chlorine, total organic carbon (TOC), turbidity, conductivity, temperature and pH sensors, which normally only measure one water quality parameter. Two main types of sensors, biosensors and optical sensors, have received a lot of attention in recent years for online water quality monitoring [1][5]. Biosensors are mainly based on fluorescence and are used for the detection of microorganisms such as bacteria and viruses. Optical sensors measure light absorption, light scattering or fluorescence. A classic example of an optical sensor is a turbidity meter. More advanced optical sensors are infrared, fluorescence and UV-Vis spectrophotometers. Infrared optical sensors can continuously measure organic compounds at wavelengths greater than 760 nm and can analyse water samples at liquid or gas phases [6]. The infrared sensors are not commonly used for online water quality for water treatment. Florescence sensors can continuously determine dissolved organic matter and indicators of the microbial quality of water by analysing fluorescence from a molecule according to its fluorescent properties. UV-Vis sensors can also continuously measure water quality parameters by determining the amount of light absorbed by compounds, such as TOC and dissolved organic carbon (DOC), colour, nitrate and specialist parameters. Both florescence and UV-Vis sensors do not require sample pre-treatment, are reagent free and allow fast measurements [5], but UV-Vis sensors can measure multiple parameters for water quality monitoring and treatment process control.
Water quality analysis using UV-Vis spectrophotometers is a simple but effective method to provide measurements of water quality parameters. For conventional laboratory-based water quality monitoring procedures using spectrophotometers, sample pre-treatment is needed, such as physical filtration using 0.45 μm filters to eliminate particle interference for measuring UV254 and reagents for nitrate determinations. However, some commercial online UV-Vis spectrophotometers have built-in particle compensation and other algorithms [7] to eliminate sample pre-treatment and can provide calculated equivalents of water quality parameters such as UV254, colour, nitrate, DOC and TOC.
In recent years, additional parameters have been included in water quality monitoring using online UV-Vis spectrophotometers [8], such as measurements of dissolved organic matter [9], chemical oxygen demand (COD) in water bodies [10] and disinfectant in drinking water [11]. It has gradually been applied for the process control of water treatment, particularly for the coagulation process [12]. However, it can also be challenging to obtain accurate water quality measurements for those online UV-Vis instruments with built-in algorithms, with issues including under-compensation, over-compensation and failure to generate reasonable measurements for real-time monitoring and process control [13][14][15][16]. In contrast, reliable measurements were also reported using the online UV-Vis instruments for water quality detection and water treatment process control [17][18][19]. Various studies have been conducted to develop algorithms based on certain wavelengths (regions) of UV-Vis spectra to determine water quality, such as the use of absorbance ratios to monitor the variation of DOC in the water and multiple linear regression to estimate the total carbon contents in water [20][21].
Applications of UV-Vis spectrophotometers for water quality analysis have been reported in several review articles. A brief product review on a submersible UV-Vis spectrophotometer (probe) was conducted in 2006 which summarised the typical applications for wastewater treatment, environmental monitoring and drinking water applications [22]. The use of UV-Vis spectrophotometers for dissolved organic matter studies was reviewed, which summarised the use of derivatives and differential absorption spectra methods for DOC determinations in 2017 [9]. A recent review has been conducted on the advances of water quality detection by UV-Vis spectrophotometers in 2020 [8].
2. Online UV-Vis Spectrophotometers
Online UV-Vis spectrophotometers can be effective and practical for measuring water quality parameters continuously and without the need for physical filtration using software particle compensation techniques. The water industry has deployed more online instruments to monitor water quality from catchment to tap for online and in-situ measurements as well as the treatment process control. However, the reputation of lacking reliability of the measurements is the general restriction of these instruments to expand to a wider range of water quality management applications. This section discusses those issues and limitations.
2.1. Online UV-Vis Spectroscopic Instrumentation
With the advancement of photodetectors’ development, there is an increasing variety of online UV-Vis spectrophotometers. Various UV-Vis sensors developed from different detection technologies and instrument designs are available for water quality monitoring and process control. The principle of UV-Vis spectrophotometry is based on the substance molecules in the water that can absorb UV-Vis light of a specific wavelength and the correlation between absorption spectrum and the concentration of the substance [8]. These sensing devices generally do not require sample filtrations (software particle compensation), are reagent free and allow fast measurements of water quality. They also have low maintenance requirements for parameters such as UV254 and the spectral absorption coefficient (SAC254); in addition, they are equipped with automatic ultrasonic cleaning systems without the need for manual cleaning; however, in some situations, particularly for turbid source waters, regular/on-demand manual cleanings of the measurement ports are still required to ensure reliable measurements. Commonly used commercially available online UV-Vis instruments are summarised in Table 1. There are mainly two categories of these online instruments: single wavelength (SW) and spectrum (full or partial).
Online SW UV-Vis instruments determine concentrations of a particular parameter in water based on the absorbance of a selected single wavelength [23]. The SW UV-Vis instruments, also called UV sensors, are usually manufactured with a specific wavelength to measure UV254 or nitrogen as nitrate and nitrite. The most common SW instruments are UV254 sensors which measure the absorbance at 254 nm with the absorbance at 550 nm for particle compensation. UV254 sensors can generate a surrogate parameter—SAC254 to determine dissolved organics and provide measurements of correlated parameters such as DOC and COD [23]. These surrogate parameters determined by the sensors are generated based on the correlations (often linear) of UV254 and the parameters, which is the wavelength of 254 nm absorbed by organic matter in the water. This concept is used by some commercial instruments including the HACH UV probe [24], Burkert SAC254 sensor [25] and YSI UV-Vis sensor; they use a single wavelength (absorbance at 550 nm) to compensate for the particle effect. These instruments are often SW instruments that use absorbance at 254 nm to determine the concentrations of a particular parameter, such as DOC.
In comparison to the SW UV sensors, UV-Vis spectral or full-spectrum sensors record the absorbances of a certain band of wavelengths or full spectra. These sensors produce fingerprints of spectra which are then used to determine and calculate concentrations of water quality parameters based on the instrument’s built-in algorithms. The spectral sensors can provide measurements for various parameters such as UV254, colour, DOC and turbidity using the algorithms. These instruments are generally factory calibrated for the particular water quality parameters using their proprietary algorithms but with site-specific re-calibration options. The instrument built-in proprietary algorithms are first used to remove the particle’s effect on the measurements of the water to replace the physical filtration step [26]. Some instruments, such as the IQ Sensor NET, provide surrogate parameters for DOC and COD, but the results are often not comparable to standard laboratory methods without specific calibration. This is because the correlations between the surrogate and standard analytical methods depend on the compositions of the water [18]. Re-calibration is often needed if significant changes happen in the compositions of water [18][27], which is different to the specific water type used in the original algorithm development [26].
Generally, when comparing the performance of full-spectrum and SW sensors, SW sensors can provide measurements and trends of the parameters varied during certain periods but may not compensate for the particle effect accurately, particularly when comparing the results with the standard laboratory procedures and measurements. The SW sensors may only provide a rough surrogate measurement of organic content and the total nitrogen content of nitrate and nitrite, and they do not have accurate particle compensation for most surface waters. In comparison, the spectral sensors provide better particle compensation and can be calibrated to specific locations with higher accuracy; they are better for precise applications, such as real-time water monitoring and treatment processes. In addition, the calibrations of online sensors are normally based on the grab sample collected at the same time of the measurement compared against laboratory measurement of that same water sample; these calibration procedures are more susceptible to the errors of grab samples.
Table 1. Summary of common online UV-Vis instruments for water quality monitoring and process control.
| Sensor | Manufacturer | Optical System | Measured Wavelength | Measured Parameter | Advantages | Accuracy | Operating Range | Source |
|---|---|---|---|---|---|---|---|---|
| AMI SAC254 | SWAN, Switzerland | Two-wavelength photometer with one optical channel, light-emitting diode (LED) light | 254 nm | Surrogate parameter to determine dissolved organics | Measuring interval: 30 s to 3 min | ±1% m−1 | UV absorption: 0–6 mg/L DOC, TOC: 0–6 mg/L SAC254: 0 to 300 m−1 Temperature: 5–30 °C |
[28] |
| ProPS-UV Photometer | Trios GmbH, Germany | Detector type: UV spectrometer, light source: deuterium lamp | 200–385 nm | nitrate, CODeq and TOCeq | Customize path lengths, Spectral analysing software, Additional calibration functions | ±0.01% mg/L | Temperature 0–30 °C, 32–86 °C; Measurements: 0.62–600 mg/L | [29] |
| IQ Sensor NET | WTW GmbH, Germany | 256 channel silicon photodiode array detector, deuterium lamp | 200–720 nm | A range of parameters, e.g., SAC, UVT | Data logger | ±3% mg/L | SAC: 0.0–3000 m−1 Temperature: 0–45 °C |
[30] |
| spectro::lyser | s::can Messtechnik GmbH, Austria | 256-pixel photodiode array detector, xenon flash lamp | 200–720 nm 220–390 nm | Various parameters | Various parametersDiffer path lengths | ±2% mg/L | Temperature: 0–45 °C; TOC: 0–180 mg/L; NO2-N: 0–40 mg/L; NO3-N: 0–100 mg/L; UV254: 0–500 abs/m | [31] |
| Real UV254 probe | RealTech, Germany | Mercury UV lamp and LED lamp | 253.7 nm | SAC254 | Various parametersVarious path lengthsField calibration | ±5% m−1 | Temperature: 0 to 45 °C UV254: 0–20 abs/cm |
[32] |
| UV absorption sensor | Endress+Hauser, Switzerland | Hotovoltatic cells detector, low-pressure mercury lamp | 254 nm | SAC254 | Data logger | ±3% m−1 | 0–2.5 abs/cm 0 to 90 °C |
[33] |
| IQ SensorNet system | YSI, Germany | Detector: LED and photodiode | 254 nm | UVT-254 and SAC254 | Has a controller | ±2% m−1 | Temperature 0 to 45 °C; UVT-254: 0–100; SAC254 0–3000 m−1 | [34] |
2.2. Water Quality Measurements with Proprietary Algorithms
As reported earlier, some advanced full-spectrum online UV-Vis spectrophotometers can determine a range of water quality parameters, including UV254, colour, DOC, turbidity and nitrate. The parameters can be computed based on the applications via the instrument’s built-in proprietary algorithms. According to the manufacturer literature, these algorithms were developed based on chemometrics techniques, such as partial least squares (PLS) and multiple linear regression, to establish the relationship between UV-Vis spectra and laboratory measurements of water samples [7]. The algorithms were created by hundreds of global datasets containing both UV-Vis spectra and reference laboratory data obtained from a wide range of water quality [7]. Instruments have default configurations to apply the generic calibration for particle compensation to the raw spectral data using the built-in algorithms.
UV254 measures the amount of light absorbed by conjugated organic compounds, which have been widely used as a rapid water quality measurement technique to control water treatment processes [35]. UV254 from the online UV-Vis instruments based on built-in algorithms generally performs well for the treated water as less interference exists [26]. However, performing site-specific calibrations may be needed if it is used for source water with a complex matrix. It is more difficult to judge the accuracy of the colour measurement than UV254 using the online UV-Vis instruments, as the standard laboratory colour measurement method relies on SW measurement. Besides, the wavelength selected to measure colour may be different based on regions and water sources; for instance, 456 nm is used by Australia and the USA, whereas 410 nm is used by Russia to measure colour in natural water [36]. To measure the colour of water, the online instrument needs to be set up according to the required wavelength. DOC is used to monitor water quality from catchment to tap water, and measurement is usually carried out using the laboratory-based standard method. Online UV-Vis instruments with built-in algorithms can be used as alternative measurements; however, they are often reported as water-specific and lacking accuracy and thus need additional calibrations against different water matrices [37]. Turbidity determined by the online UV-Vis spectrophotometers with the generic built-in algorithms is comparable to the turbidity results analysed in the laboratory [38][39]. Nitrates generated from the online instruments with the generic built-in algorithms are generally not satisfactory [38], but another group reported that the results are comparable with a laboratory analysis [39]; this could be related to the specific algorithm used and the monitoring application.
The measurements of water quality parameters using the online UV-Vis spectrophotometers are often source-water dependent. Thus, additional site-specific calibrations are needed to improve the accuracy of measurements [7][18][40][41][42] which is an instrument function provided to enter the laboratory-determined value of the collected grab sample measured at the same time by the online instrument. The site-specific calibration process involves modifying the slope and intercept of the built-in regression function using laboratory data from the reference grab samples [18][40]. To achieve the best calibration results, grab samples are needed to be representative and cover the whole measurement range of the water. Measurement accuracies can be enhanced with the use of an increased number of grab samples for the calibrations of the online UV-Vis spectrophotometers.
Applications of online UV-Vis instruments can reveal that the significant fluctuations of water quality could affect the accuracy of the measurements, and long-term monitoring required regular calibration to compensate for the variation of the particle character issue [16][26][40]. A site-specific calibration was conducted for a submersible UV-Vis instrument to monitor water quality in a forested catchment, and comparable results were achieved [41]. In contrast, a site-specific calibration was performed for a UV-Vis submersible instrument to measure the water quality of stream water, but concentrations were overestimated because of inaccurate particle compensation [42]. Therefore, accurate site-specific calibration of the UV-Vis instrument is crucial to obtain measurements for water quality monitoring.
Calibrations of online UV-Vis instruments should be performed as needed for situations such as an instrument being installed for the first time, changing the monitoring locations of the instrument, or the instrument being inaccurate to the reference water samples. Routine calibration may not be necessary for monitoring less variable source water or stable water quality, such as treated water, but routine verification of the measurements using lab references is recommended to ensure the accuracies of the instruments [37]. Site-specific calibrations have been approved to achieve the desirable measurement outcomes and can adequately account for the differences in large water quality changes or between different types of water [13][15][43][44][45].
2.3. User-Developed Algorithms for Spectral Absorbance Measurements
When there are difficulties to obtain accurate continuous measurements using online UV-Vis spectrophotometers with the instrument built-in algorithms or when the instruments do not come with built-in algorithms, alternative particle compensation (calibration) techniques can be developed by end-users. To better utilise the online instruments for water quality monitoring and water treatment process control, as well as lower the maintenance costs, more importantly gaining in-house experience and knowledge of the instruments, researchers and water utilities have been seeking techniques for particle compensation alternative to the built-in particle compensation methods. The particle compensation techniques based on the UV-Vis spectra can be categorised into direct subtraction compensation and chemometric modelling. Table 2 summarises particle compensation techniques from the literature for online water quality monitoring using the UV-Vis instruments.
Table 2. Summary of indirect particle compensation methods for online water quality monitoring.
| Methods | Wavelengths (nm) |
Parameter | Data Type | Sources | Literature |
|---|---|---|---|---|---|
| SW | 350 nm | COD | Lab | Ground water | [46] |
| SW | 546 nm | COD | Lab | Simulated water samples | [47] |
| SW | 545 nm | UV254 | Lab and field | Surface water | [48] |
| SW, MSC | 550 nm | UV254 | Field | Surface water, treated water | [26] |
| Two wavelengths | 254, 340 nm | DOC | Field data | Surface water | [49] |
| MSC | Full spectra | COD | Lab | Stream water, Simulated water | [50] |
| PLS | 200–400 nm | COD | Lab | Lake water | [19] |
| PLS | Full spectra | DOC | River water | [51] | |
| PLS | full | Nitrate | Lab | Simulated water | [52] |
| PLS | 380–750 nm | Nitrate, TOC, COD | Lab | Seawater | [53] |
| PLS | Full spectra | assimilable organic carbon | Pilot | Simulated lake water | [54] |
| MSC, PLS, PCR | 250–740 nm | DOC | Field | Surface water | [18] |
| PLS, lasso regression and MSR | Full spectra | Nitrate, DOC | Field | Brackish water | [55] |
| MSR | 250, 290, 307.5, 437.5, 447.5, 630, 645 nm |
DOC, Fe | Lab and Field | Stream water | [17] |
| PLS, MSR, local and global | 250–740 nm | DOC | Field | Surface water | [56] |
| Multiple linear regression | 260, 265, 280 and 285 nm | TOC | Lab | Drinking water, seawater, river water | [21] |
| SVM | Full spectra | Nitrate | Lab | River water | [57] |
Direct subtraction compensation is based on the absorbance of wavelength characterised by the particles in the water [7][58]. Wavelengths, including 275 nm, 350 nm, 545 nm, 546 nm and 550 nm, have been utilised to characterise the particles in the water and to remove the particle effect from the UV-Vis measurements [46][47][48]. The absorbance at 546 nm was used to remove the particle effect on the COD in river water [47]. The wavelength at 545 nm was used to reduce the particle influence on the UV for surface water [48]. The wavelength at 550 nm is commonly selected for SW particle compensation for individual water quality parameters and has often been used for the measurements of UV254 [26]. UV at 350 nm has been used to compensate for the online measurements of COD using UV spectrophotometry to detect groundwater quality to remove the influence from particles [46]. In the same study, the absorbance at 275 nm was also used to compensate for nitrate at 220 nm. Figure 1 shows an example of using an SW particle compensation method to remove the particle’s influence on a raw spectrum for surface water [26].
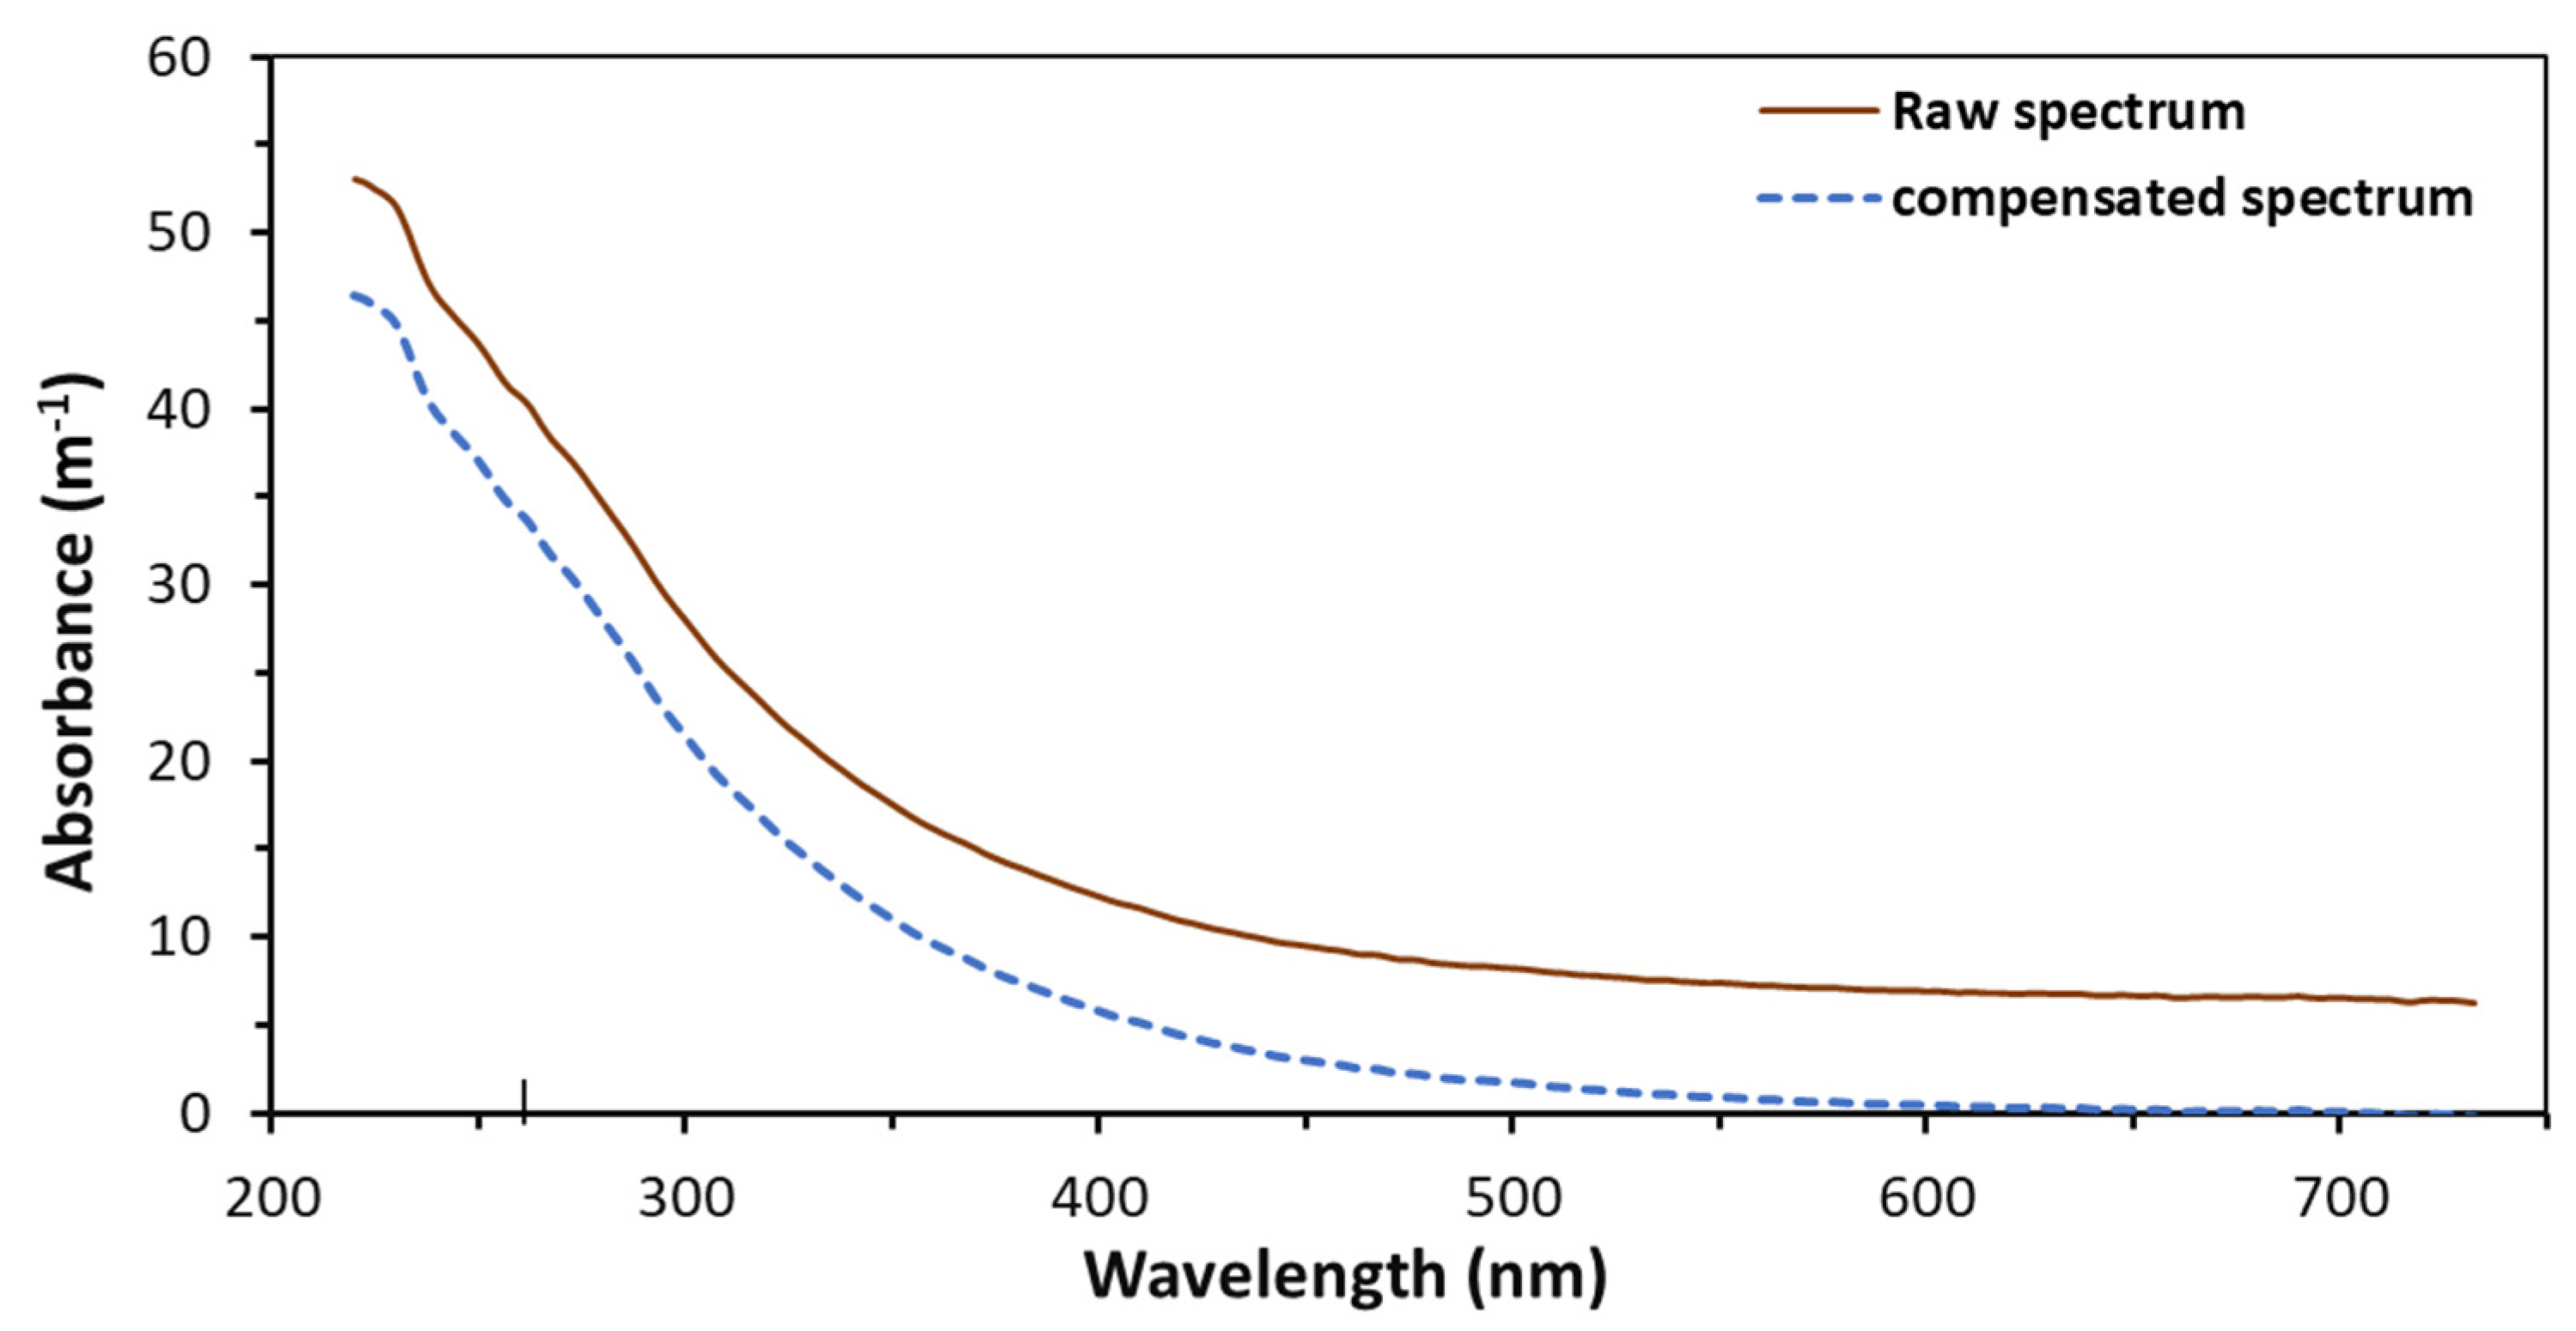 Figure 1. Illustration of particle compensation of a raw spectrum for surface water using a single-wavelength method.
The multi-wavelength particle compensation technique, also called chemometric modelling, includes a selection of chemometrics such as multiple linear regression (MLR), multiple stepwise regression (MSR), support vector machine (SVM), support vector regression (SVR), multiplicative scatter correction (MSC), principal-component analysis, and PLS. The multi-wavelength particle compensation technique is based on relationships between the raw spectra and laboratory reference values of the water quality parameters. The MLR determines the linear relationship between a dependent variable (the laboratory values) and independent variables (wavelengths of the raw spectra) which can directly define the coefficient of each variable. MLR was employed to remove the particle effect on the UV-Vis spectra of brackish water for the rapid measurement of water quality parameters [55]. Multiple linear regression was also used to quantify the DOC content in the stream water [17] and TOC in the drinking water, seawater and river water [21]. Multiple stepwise regression was used to compensate for the particle effect on the DOC measurements for surface water [56]. SVM is a machine learning algorithm that can be used for classification, regression and outlier detection. SVM was used to determine the concentration of dissolved nutrients in surface water using the full spectral wavelengths and laboratory values and demonstrated the effectiveness of the approach [57]. SVR is similar machine learning method as SVM, but it works with continuous values instead of classification, as in SVM. SVR was used to predict the combined nitrate and nitrite concentration for treated water samples using spectral features, and the predicted values were matched with the standard laboratory values [59]. MSC is a normalization technique to correct the particle’s effect on spectra by changing the scale and the offset based on the reference spectrum, which is the mean of the spectra. The MSC method was applied to compensate for the particle’s effect on the COD in lake water [19], UV254 in reservoir water [26] simulated surface water [50] and DOC in drinking water production [51].
PLS constructs components by projecting the predictor variables to a new space. Then, the linear regression models were built between new predictors and responses. PLS can be used to extract important information from a large data matrix [60]. PLS regression is a commonly used method to remove the particle’s effect on the measurements of water quality parameters based on the multiple wavelength spectra. It has been used to remove the particle’s effect on the water quality multi-parameter, such as COD in artificial seawater [61], suspended solid in brackish water [55], COD in lake water [62], COD and TOC in seawater [53] and stream water [17], nitrate in water [52], nitrate and nitrite in seawater [63], DOC in surface water [56] and drinking water [51] and ozone in drinking water [54].
The use of a subtraction method for particle compensation generally works well for low- and medium-turbid source water and treated water, but it may lead to less accurate measurements in some cases, such as highly turbid water [49][56]. The accuracies of the measurements such as DOC in the surface waters can be improved by using the multi-wavelength particle compensation methods. Water matrix-specific particle compensation is often recommended for water quality monitoring. There are some benefits of using alternative particle compensation methods to the built-in algorithms. Firstly, it creates simplicity and flexibility of custom-made particle compensation methods for water quality measurements of the particulate water matrix, as the details of the built-in algorithms for the commercial online instruments are often not accessible to the users. Secondly, the use of alternative particle compensation methods can lower the calibration costs of the instruments. Moreover, cost-effective UV-Vis instruments with a single wavelength or short wavelength band could be employed in the field to monitor water quality instead of using full-spectrum UV-Vis instruments.
This entry is adapted from the peer-reviewed paper 10.3390/s22082987
This entry is offline, you can click here to edit this entry!